3070
Spatial relationship between brain tumor regions assessed by PWI and 11C-Methionine using a fully hybrid PET/MRI system1Nuclear Medicine, IRCCS San Raffaele Scientific Institute, Milan, Italy, 2Neuroradiology and CERMAC, VIta-Salute University, IRCCS San Raffaele Scientific Institute, Milan, Italy, 3Vita-Salute San Raffaele University, Milan, Italy
Synopsis
Simultaneous PET/MRI offers a unique opportunity to investigate the relationship between concurrent phenomena measured by MET-PET and PWI-MR at the same physiological condition. Although 11C-Methionine uptake and perfusion are tightly coupled, it is not clear whether tumor regions (VOIs) defined by PWI and MET are overlapped and how the values of the corresponding parametric maps are distributed within each VOI. This preliminary work aims at studying the spatial relationship between PWI-MRI maps and MET-PET in brain tumors using a fully integrated PET/MRI system.
INTRODUCTION
MRI is the standard imaging technique for morphological evaluation in patients with cerebral tumors. However, in follow-up imaging in patients with prior surgery and radiotherapy (RT), the specificity of MRI may be low because of the presence of treatment-induced changes. Specifically, multiple enhancing cerebral lesions are frequently seen on MRI scans soon after combined radiotherapy and high-dose chemotherapy. Such findings pose a major diagnostic challenge in terms of their differential diagnosis versus recurrent tumor. PET imaging with 11C-Methionine (MET-PET), making use of the increased amino acid uptake in most tumors relative to healthy brain, may improve the detection of areas of progressive disease. Similarly, advance PWI-MR that reflects tumor angiogenesis has been shown to increase diagnostic accuracy compared with standard MRI1,2,3. Simultaneous PET/MRI offers a unique opportunity to investigate the relationship between concurrent phenomena measured by MET-PET and PWI-MR at the same physiological condition, and to evaluate their suitability and complementarity as imaging markers for brain tumors. Although 11C-Methionine uptake and perfusion are tightly coupled, it is not clear whether tumor regions (VOIs) defined by PWI and MET are overlapped and how the values of the corresponding parametric maps are distributed within each VOI. This preliminary work aims at studying the spatial relationship between PWI-MRI maps and MET-PET in brain tumors using a fully integrated PET/MRI system.METHODS:
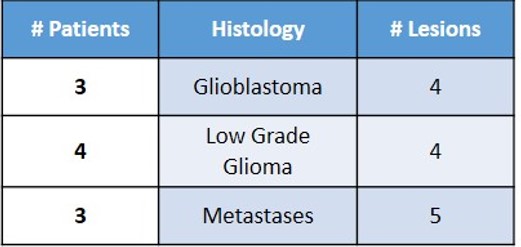
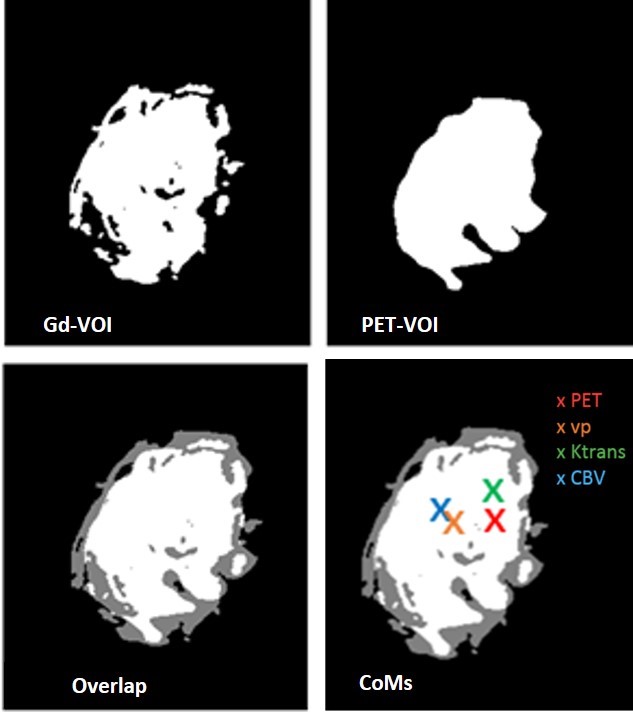
Ten patients (13 lesions – see Table 1) affected by primary or secondary cerebral neoplastic diseases, characterized by Gd enhancement, underwent a simultaneous 11C-MET PET/MRI examination on a SIGNA PET/MR system (General Electric Healthcare, Waukesha, WI). MR protocol included T1w, T2w and Flair volumetric acquisitions, DWI, DCE and DSC PWI studies with double Gd bolus injections and, finally, a 3D T1w post-contrast scan, according to a previously described protocol4. Simultaneous MET-PET acquisition has been collected for 20 minutes on the brain level. ZTE-based attenuation correction was used to account for the head bone. After the assessment of the perfect co-registration of PWI and MET-PET over 3D post-contrast T1w images, a neuro-radiologist and a nuclear medicine physician defined manually the segmentation of the lesions using PMOD software. MRI lesions (Gd-VOI) and PET lesions (PET-VOIs) have been defined on the T1w enhancement and on the PET images, respectively. The PET-VOIs were used to measure Standardized uptake value (SUV)max, metabolic tumour volume (MTV) and SUVmean for each lesion evident on MET. Ktrans, Vp and rCBV maps have been calculated using OLEA software and the Gd-VOIs have been used to mask Ktrans, Vp and rCBV maps. DICE coefficient for each lesion of each patient was calculated to measure the overlap between the corresponding VOIs on PET and Gd-enhanced MRI. Moreover, the Center of Masses (CoM) of each masked map (Ktrans, Vp, CBV and MET-PET) have been localized and the distances between Met-PET CoM and PWI CoMs have been calculated.RESULTS:
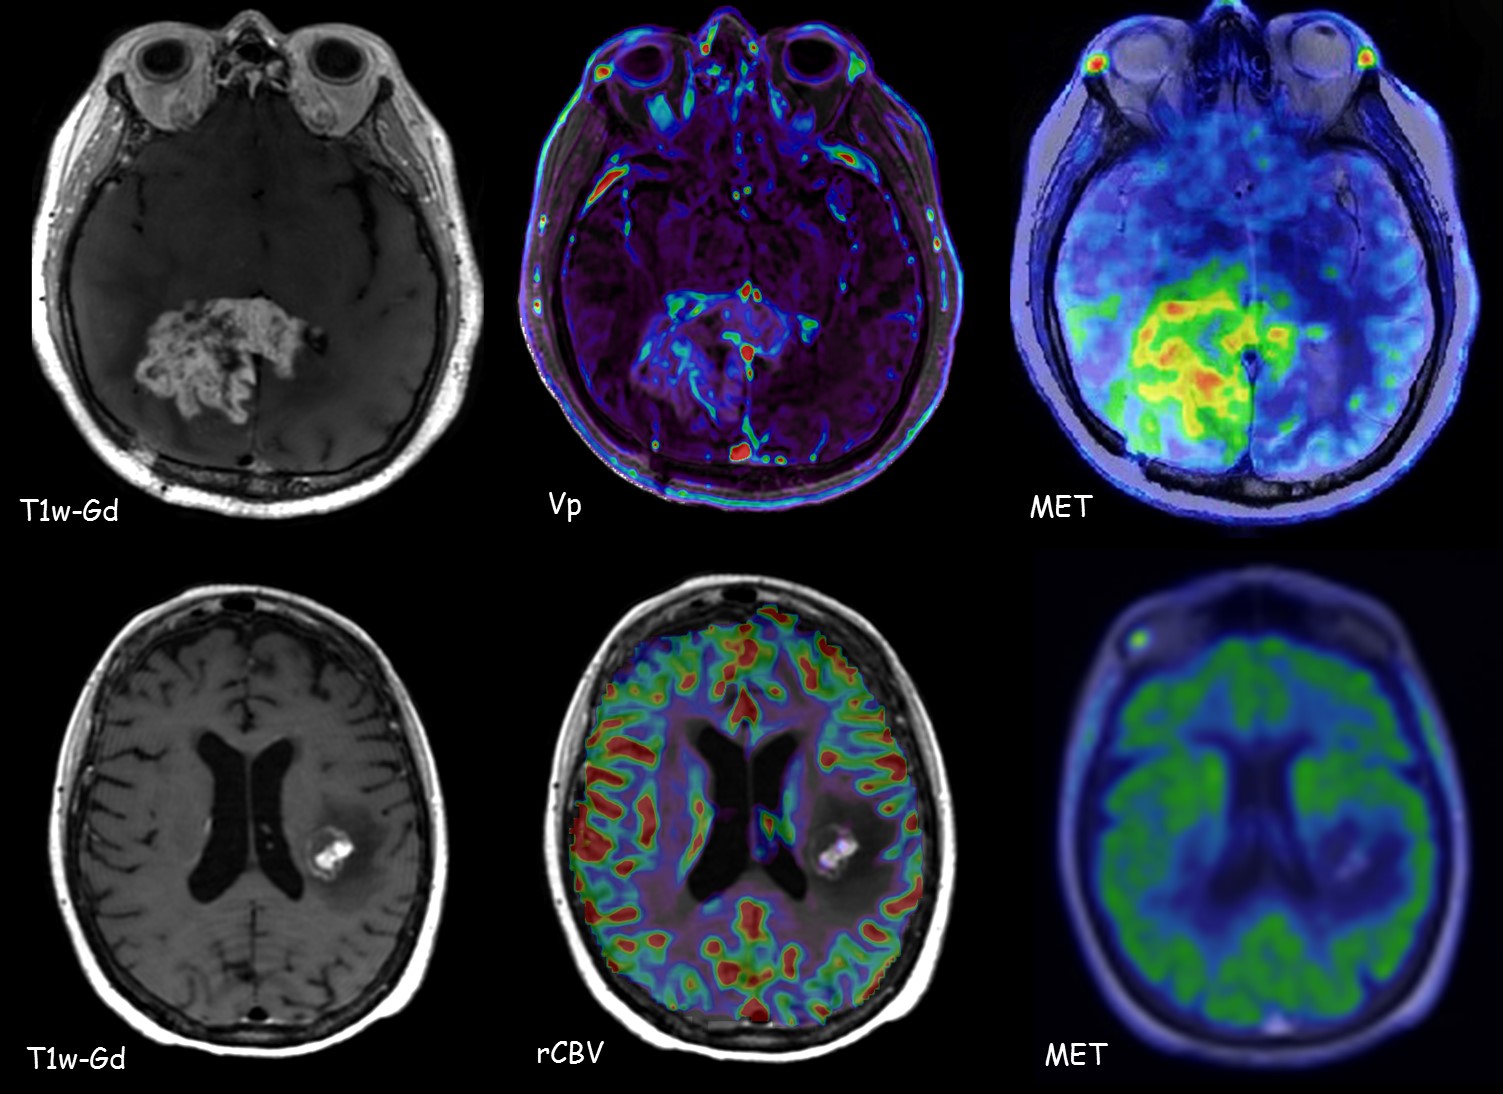
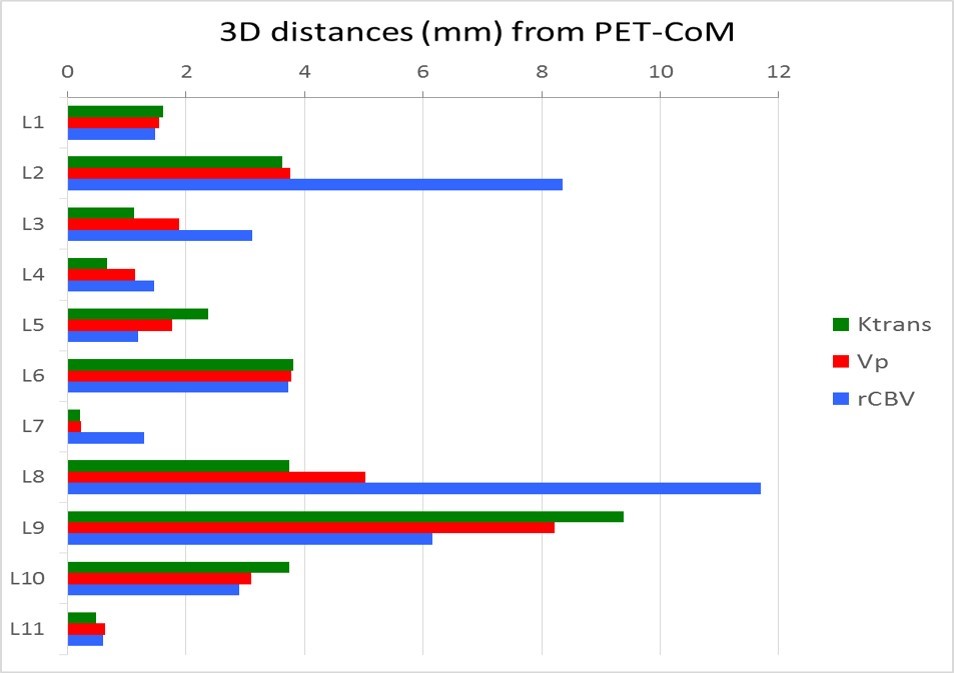
11/13 lesions with Gd-enhancement on MRI had also MET uptake (mean SUVmax: 4,5; range: 2,5-10,8; mean SUVmean: 2,7; range: 1,5-6,5; MTV: 21,7, range: 0,5-94,6). Figure 1 shows two examples of PET, Gd-T1 MRI and the fusion of the two images in two patients: one with MET-PET (upper panel), and one with negative PET-MET (lower panel). Figure 2 shows an example of PET-VOI, Gd-VOI and the overlap of the two VOIs in the same patient. PET-VOIs are significantly larger than Gd-VOIs (median PET-VOI: 47 cc; range 9,9-2499; median Gd-VOI: 33cc; range 4,4–1097). Mean DICE index between PET and Gd-VOIs of the lesions is moderate (0.58 ± 015). In Figure 3 the 3D distances between the PWI-CoMs and MET-CoMs are shown for all the lesions.DISCUSSION AND CONCLUSIONS:
From this preliminary spatial location analysis, it is evident that the areas defined by MET-PET SUV and Gd-MRI characterize different aspects of the tumor lesions (active lesions within not-enhancing areas and vice-versa) with moderate overlapping. Moreover, there is no statistical difference between distances of PWI-CoMs from PET-CoM, although the heterogeneous histology of the lesions included in this study may have impacted on this result. In conclusion, our findings indicate that MET-PET and PWI-MR provide complimentary information on cerebral tumor biology. Further analysis on a wider and more homogeneous cohort of patients will be useful to deeply investigate these potentially relevant aspects of recurrent brain lesions.Acknowledgements
No acknowledgement found.References
1. Ali FS, Arevalo O, Zorofchian S, Patrizz A, et al, Cerebral Radiation Necrosis: Incidence, Pathogenesis, Diagnostic Challenges, and Future Opportunities. Curr Oncol Rep. 2019 Jun.19;21(8):66.
2. Shah AH, Kuchakulla M, Ibrahim GM, et al, Utility of Magnetic Resonance Perfusion Imaging in Quantifying Active Tumor Fraction and Radiation Necrosis in Recurrent Intracranial Tumors. World Neurosurg. 2019 Jan;121:e836-e842.
3. Kim YH, Oh SW, Lim YJ, et al, Differentiating radiation necrosis from tumor recurrence in high-grade gliomas: assessing the efficacy of 18F-FDG PET, 11C-methionine PET and perfusion MRI. Clin Neurol Neurosurg. 2010 Nov;112(9):758-65,
4. Anzalone N, Castellano A, Cadioli M, et al, Brain Gliomas: Multicenter Standardized Assessment of DynamicContrast-enhanced and Dynamic Susceptibility Contrast MR Images. Radiology. 2018 Jun;287(3):933-943.
Figures