3067
Quantitative PET/MRI of Immunotherapy Response in Preclinical Epithelial Ovarian Cancer1Biomedical Translational Imaging Centre (BIOTIC), Halifax, NS, Canada, 2Dalhousie University, Halifax, NS, Canada, 3IWK Inc., Halifax, NS, Canada, 4Carleton University, Ottawa, ON, Canada, 5IMV Inc., Halifax, NS, Canada, 6Ottawa Hospital Research Institution, Ottawa, ON, Canada, 7University of Ottawa, Ottawa, ON, Canada
Synopsis
Epithelial ovarian cancers are highly aggressive tumor types making them a prime target for research using immunotherapies. Using simultaneous PET/MRI, we monitored an orthotopic ovarian cancer model to evaluate longitudinal tumor growth and metabolism in response to therapy while tracking immune cell subsets labeled with superparamagnetic iron oxide (SPIO). Treatment with the combination of immune therapies significantly decreased the volume of primary tumors and improved survival times. We quantified cytotoxic T lymphocytes (CTLs) and dendritic cells (DCs) recruited to the primary tumors and found treatment with the combination therapy increased recruitment of CTLs but resulted in decreased recruitment of DCs.
Introduction
Epithelial ovarian cancers are highly aggressive tumor types and advanced forms have poor survival outcomes after traditional therapies. This makes them a prime target for research using immunotherapies aimed at stimulating the immune system1-4. Many immunotherapies, including checkpoint inhibitors, are being tested on these cancers in clinical trials, but much is still unknown about why they work in some patients but not others. Given the highly variable and individualized nature of immunotherapy, imaging offers valuable opportunities to longitudinally assess individual level responses. Quantitative MRI cell tracking5-7 can accurately and longitudinally monitor migration of a wide range of immune cell types in a variety of cancer and immunotherapy models. Using simultaneous PET/MRI, we monitored an orthotopic ovarian cancer model to evaluate longitudinal tumor growth and metabolism in response to therapy while tracking immune cell subsets labeled with superparamagnetic iron oxide (SPIO). We also used flow cytometry for further evaluation of the immune microenvironment in the tumor ascites and the composition of tumor infiltrating lymphocytes.Methods
All preclinical research was done under the oversight of the Dalhousie UCLA. Humanized transgenic mice (HLA-A2.1-/HLA-DR1-transgenic (HHD) H-2 class I-/class-II knockout) are engineered to express the human leukocyte antigen. HHD mice were surgically implanted with 104 syngenic mouse ovarian cancer surface epithelial cells (MOSE) directly into the left ovarian bursa. HHD mice were untreated or treated with a combination of metronomic cyclophosphamide (starting on day 21), anti-PD1 (3 doses of 200ug/mouse/week every 2nd week beginning day 21), and a peptide-based immunotherapy (DPX-Survivac) given every 3 weeks starting at day 21. CD8+ cytotoxic T cells (CTLs) and dendritic cells (DCs) were isolated from disease- and treatment-matched mice, cultured in vitro, and passively loaded with Molday Rhodamine B SPIO (~30nm - Biopal, Worcester MA) for 24h. Mice received an i.v. tail injection of 5x10⁶ CTLs or 1x10⁶ DCs and were imaged ~24 hours post-injection.MRI data were acquired on a 3T pre-clinical scanner (Agilent, Santa Clara, CA). Balanced steady state free precession images were used for viewing anatomical features. TurboSPI7 was used for R2* mapping. R2* values are converted into quantitative estimates of cell concentration based on a calibration curve. Mice were imaged with PET/MRI on days 42, 49 and 56 post-tumor implants. Using a fully integrated PET/MRI system (NuPET, Cubresa, Winnipeg MB), PET data (~500mCi 18F-FDG) were acquired simultaneously with MRI to assess tissue metabolism. PET data was aligned with MR images using VivoQuant (Invicro, Boston MA). Mice were terminated as necessary due to the presence of excessive ascites, weight loss, or at study end (57 days post-implant). A full necropsy was done on all mice at endpoints and a sample of ascites were removed for flow cytometry. At the end of the study, tumors were digested and evaluated via flow cytometry and immunohistochemistry.
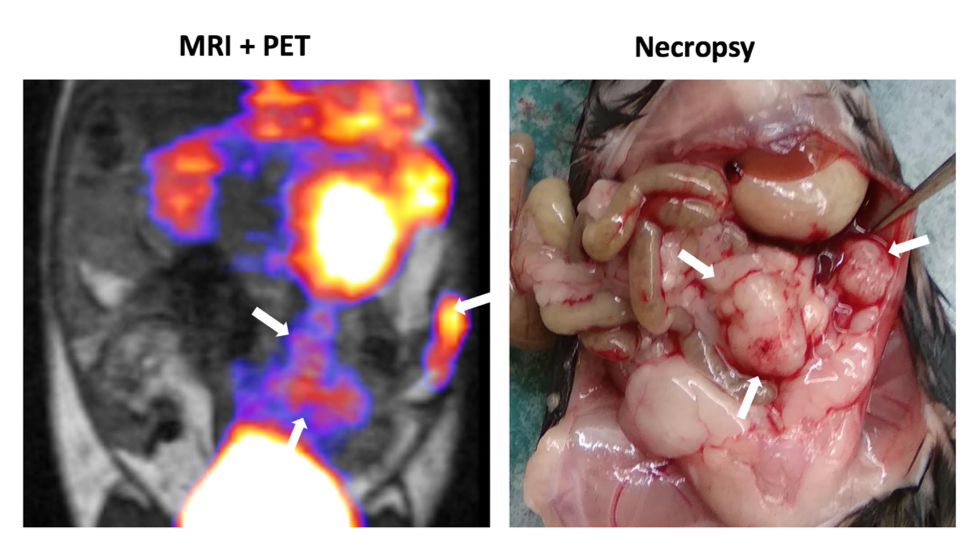
Results and Discussion
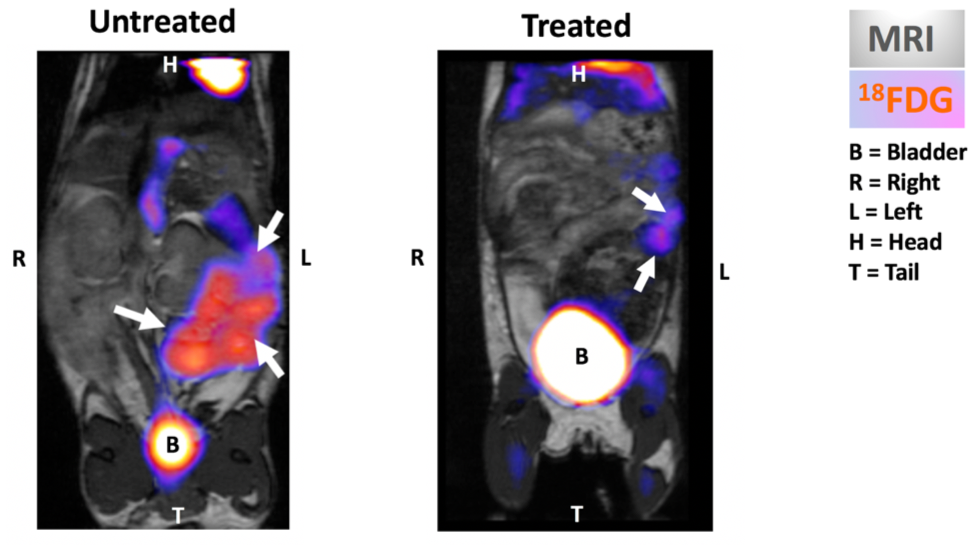
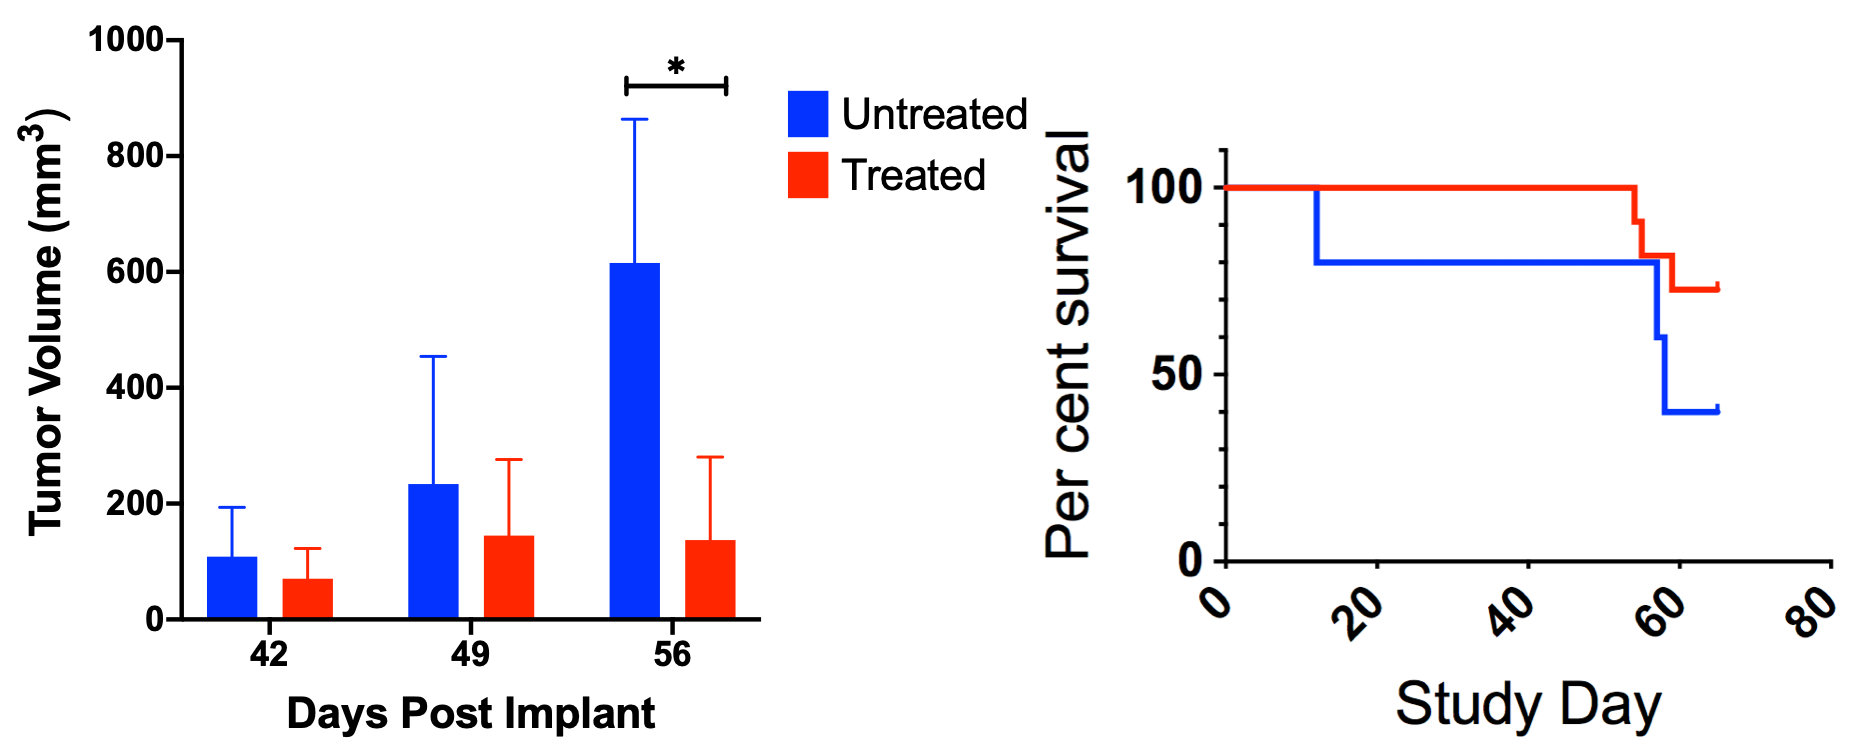
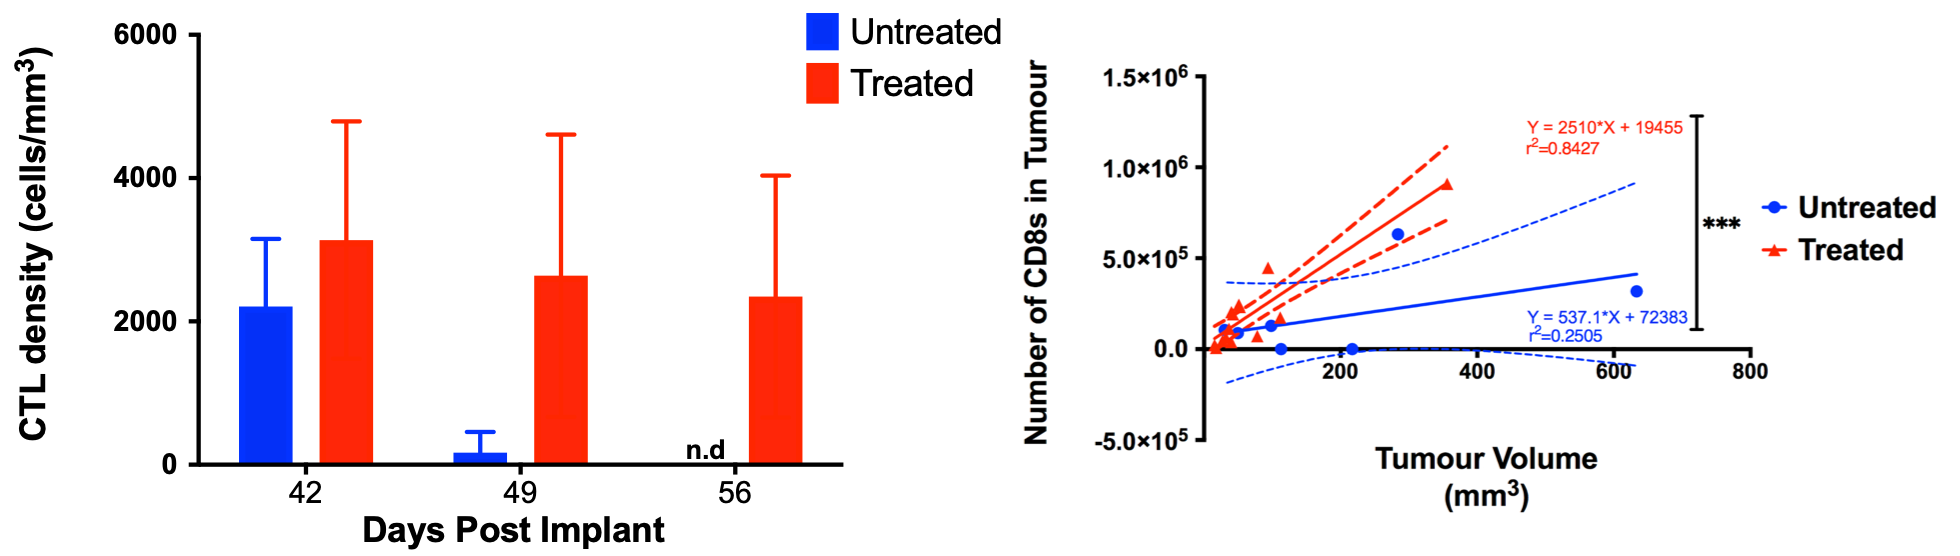
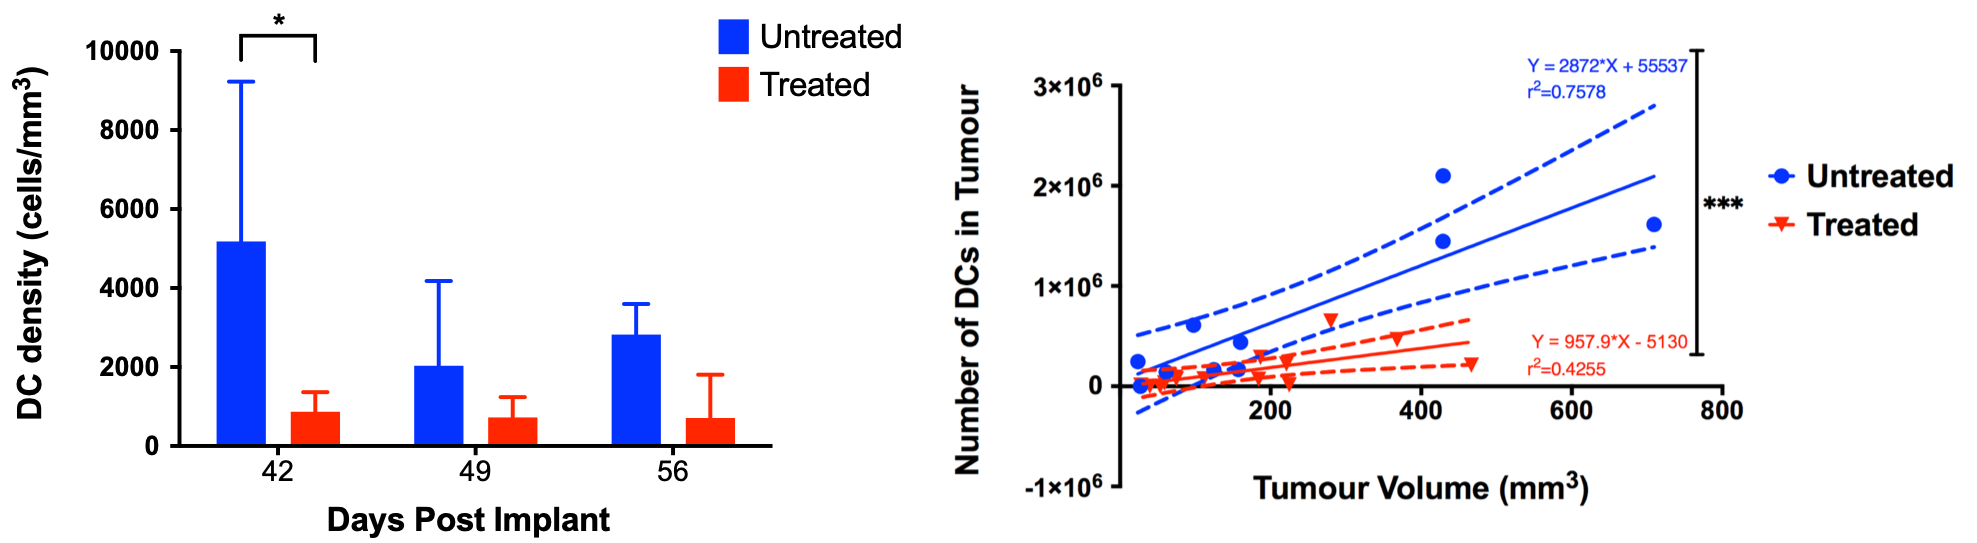
PET/MRI allowed monitoring of tumor progression and metabolism (Fig 1). We found that abdominal swelling (primarily due to ascites) was not necessarily correlated with increased primary tumor volume. PET demonstrated a reduction in metabolism in treated tumors (quantitative analysis ongoing). Treatment with the combination therapy significantly decreased the volume of primary tumors and improved survival times (Fig 2). We visualized CTLs and DCs recruited to the primary tumors in both treated and untreated mice. Treatment with the combination therapy increased recruitment of CTLs to the primary tumor and increased the overall density of CTLs (i.e. there were more CTLs/mm3 in treated tumors) (Fig 3). However, treated mice had fewer DCs recruited to the primary tumor, particularly at day 42 (Fig 4). Data analysis of DCs recruited to lymph nodes is ongoing. Treatment with the combination therapy also causes a relative increase in the volume ratio of the right lymph node (RLN; treatment-draining) to that of the left lymph node (LLN; tumor-draining), indicating that this may be a biomarker for therapeutic success (data not shown). We are currently assessing immune infiltrates, however initial results indicate that ascites infiltrates are primarily composed of T cells (as opposed to macrophages or B cells), consistent with clinical findings. Additionally, we were able to monitor individual level responses, such as the mouse that was lacking a RLN, and that consequently did not respond to the treatment as well as other group members (Fig 5).Conclusions
We demonstrated that simultaneous PET/MRI is an excellent tool for monitoring tumor growth and internal physiological changes and demonstrated that we can quantitatively assess tumor volumes over time. MRI cell tracking results indicate changes in the recruitment rates of two unique immune cell types over time in the group level with large amounts of variability at the individual level as expected. These individual variations in immune recruitment may offer indications of underlying therapeutic response or resistance.Acknowledgements
No acknowledgement found.References
1. Syrios, J., Banerjee, S. & Kaye, S. B. Advanced epithelial ovarian cancer: from standard chemotherapy to promising molecular pathway targets--where are we now? Anticancer Res. 34, 2069–2077 (2014).
2. Ojalvo, L. S., Nichols, P. E., Jelovac, D. & Emens, L. A. Emerging immunotherapies in ovarian cancer. Discov Med 20, 97–109 (2015).
3. Weiss, L., Huemer, F., Mlineritsch, B. & Greil, R. Immune checkpoint blockade in ovarian cancer. Memo 9, 82–84 (2016).
4. Stagg, J. & Allard, B. Immunotherapeutic approaches in triple-negative breast cancer: latest research and clinical prospects. Ther Adv Med Oncol 5, 169–181 (2013).
5. Srinivas, M. et al. Imaging of cellular therapies. Adv. Drug Deliv. Rev. 62, 1080–1093 (2010).
6. Kadayakkara, D. K., Korrer, M. J., Bulte, J. W. M. & Levitsky, H. I. Paradoxical Decrease in the Capture and Lymph Node Delivery of Cancer Vaccine Antigen Induced by a TLR4 Agonist as Visualized by Dual-Mode Imaging. Cancer Res. 75, 51–61 (2015).
7. Rioux, J. A., Beyea, S. D. & Bowen, C. V. 3D single point imaging with compressed sensing provides high temporal resolution R 2* mapping for in vivo preclinical applications. MAGMA (2016). doi:10.1007/s10334-016-0583-y
Figures