3060
Sigma-1 Receptor PET-MRI for Imaging Nociceptive Sources of Low Back Pain1Radiology, Stanford university, Stanford, CA, United States
Synopsis
Low back pain is a leading cause of job-related disability and missed workdays in the U.S. Unfortunately, the overall treatment effectiveness is significantly limited by our poor diagnostic capability, which fails to identify nociceptive sources in 80% to 90% of the cases. In this work, we introduce a PET/MRI approach for low back pain diagnosis using a novel radioligand to track the sigma-1 receptor, which is upregulated during nociceptive processes. Our early results demonstrate promise in achieving improved sensitivity and specificity to the local sources of low back pain.
Introduction
Low back pain is one of the most widespread pain conditions, with 50% to 80% of adults experiencing an episode at least once in their lifetime1. Diagnostic imaging methods such as MRI have received much clinical attention for localizing nociceptive sources of low back pain. However, their findings are generally non-specific to pain and often fraught with false positives2, resulting in up to an 8-fold increased rate of unnecessary surgery3. Therefore, there is a pressing need for an advanced imaging approach targeting a pain-specific biomarker.The sigma-1 receptor (S1R) is a highly promising biomarker of nociceptive activities causing pain. Its increased activation and upregulation in pain states has been shown to play a major role in nociceptive processes by their modulation of ion channels4. Our group recently demonstrated the feasibility of in vivo PET/MR imaging of the S1R using a novel radioligand, 18F-FTC-146, which demonstrated a high specificity to the S1R5,6. In this abstract, we present early results from our 18F-FTC-146 PET/MRI study on low back pain patients.
Methods
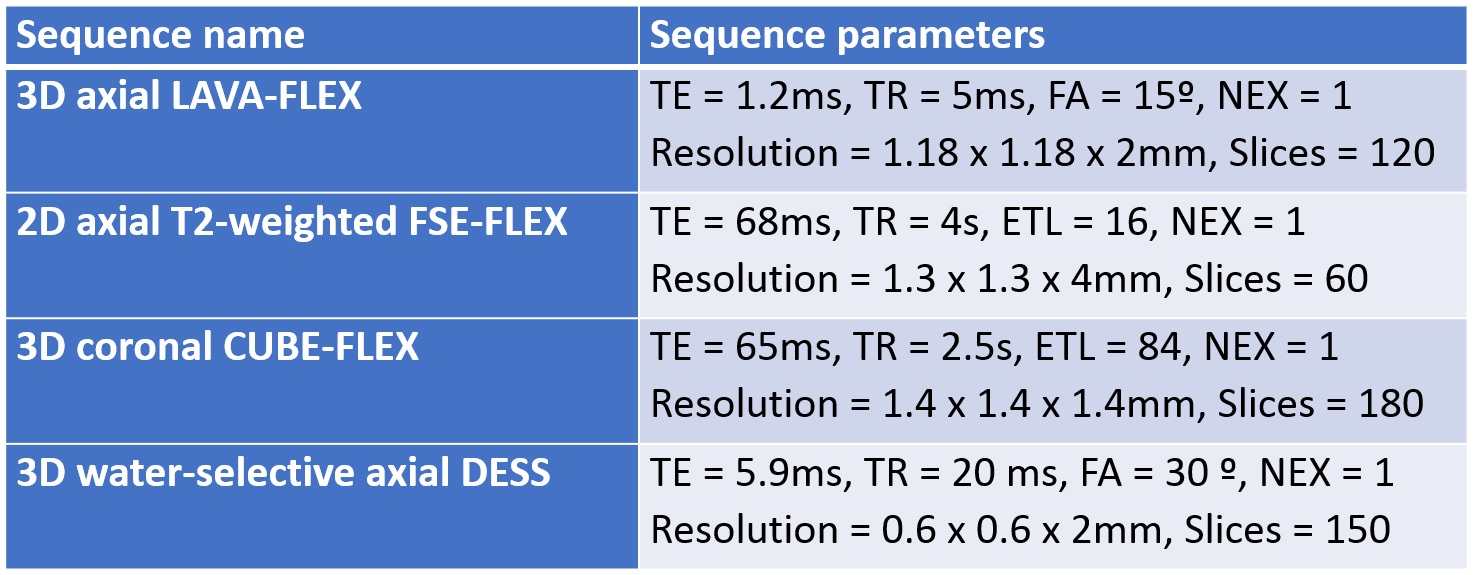
The study protocol was approved by the institutional review board, and all participants signed an informed consent form that included permission to publish data and images. Six patients with radiating low back pain and 2 with axial low back pain participated in our study for a total of 8 patients. A single 10 mCi dose of 18F-FTC-146 was injected to the patient about 40 minutes before the whole-body PET/MRI scan was conducted in a GE SIGNA PET/MRI scanner (GE Healthcare, Waukesha, U.S.). Depending on the patient’s height, 8 to 10 bed positions were adopted to scan the whole-body of the patient. In each bed position, 3D axial LAVA-FLEX and 2D axial T2-weighted FSE-FLEX sequences were performed, where, in the bed position covering lumbar spine, 3D coronal CUBE-FLEX and 3D water-selective axial DESS sequences were additionally performed (Figure 1).Two musculoskeletal radiologists reviewed the resulting whole-body PET/MRI images to identify lesions in the lumbar spine to the mid-thigh area that might be related with the patient’s symptoms. MRI image review focused on finding abnormally increased signal intensity on T2 contrast or gross structural changes while PET image review was on detecting focally increased 18F-FTC-146 uptake. Detected lesions were classified into three groups depending on the modality that detected abnormalities: 1) MRI only, 2) PET only, 3) both MRI and PET. We followed the treatment process of patients to evaluate the relevance of our image findings to the pain symptoms.
Results
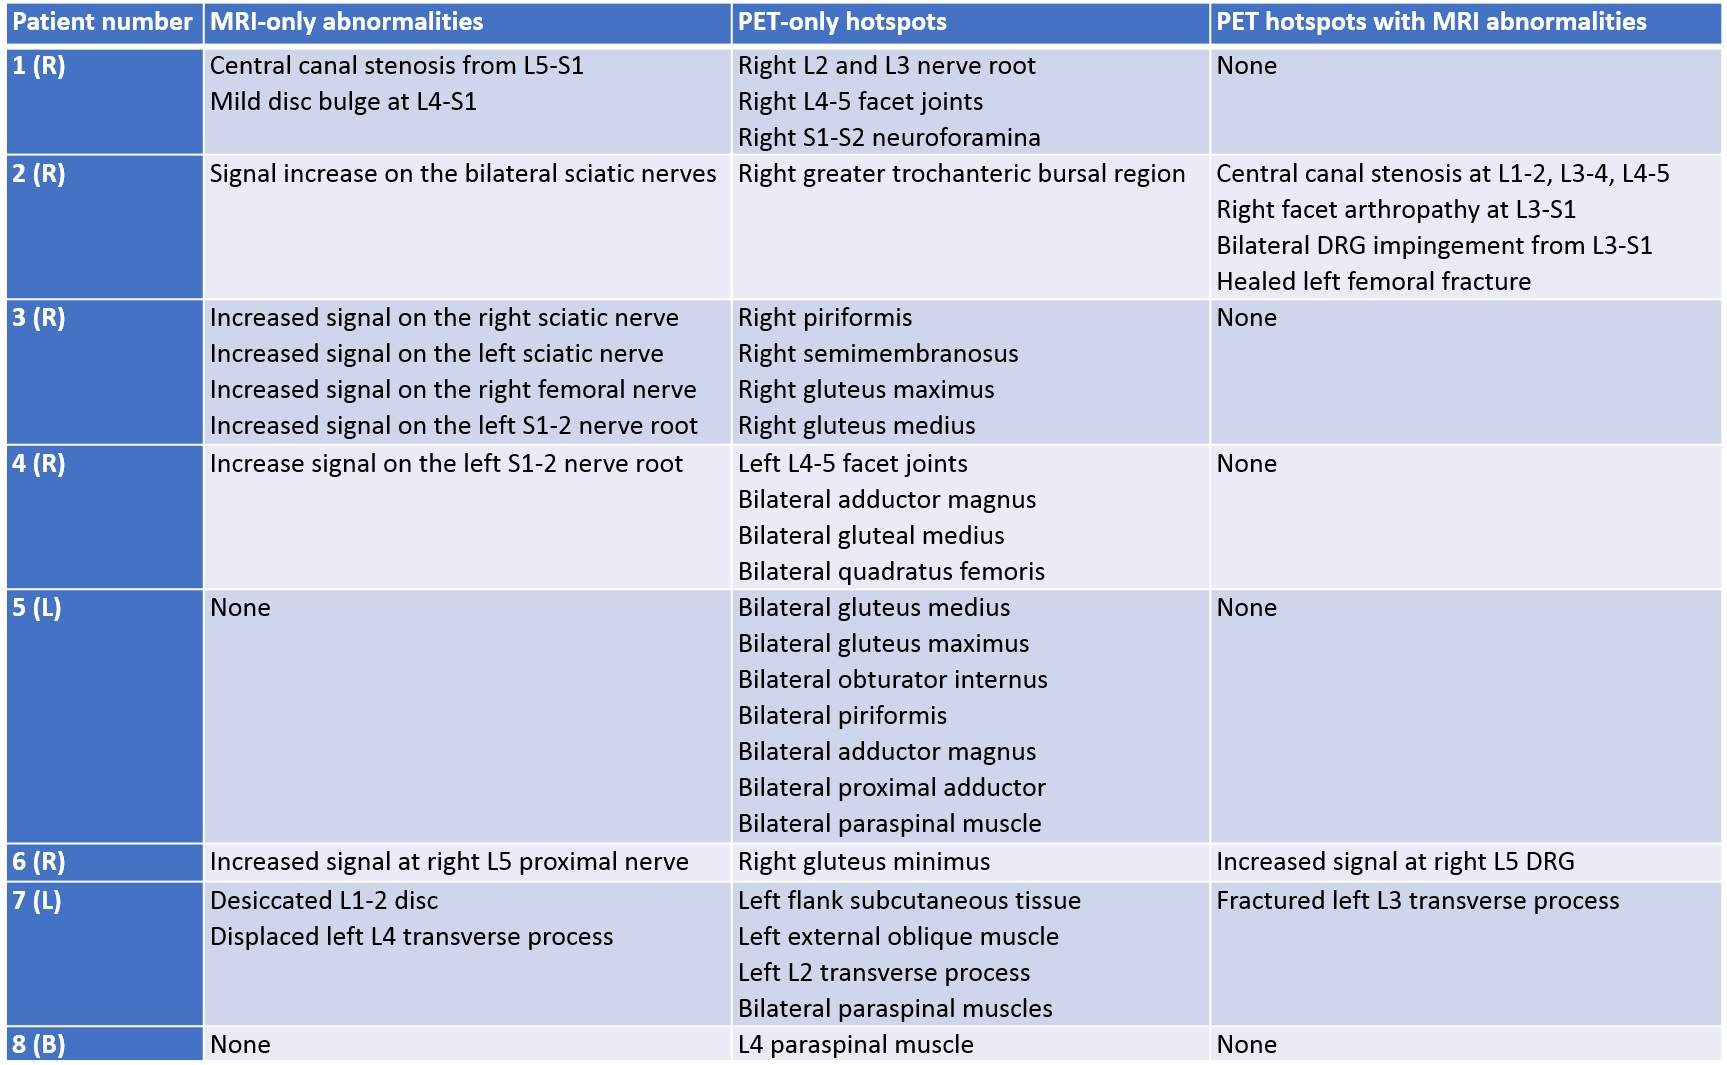
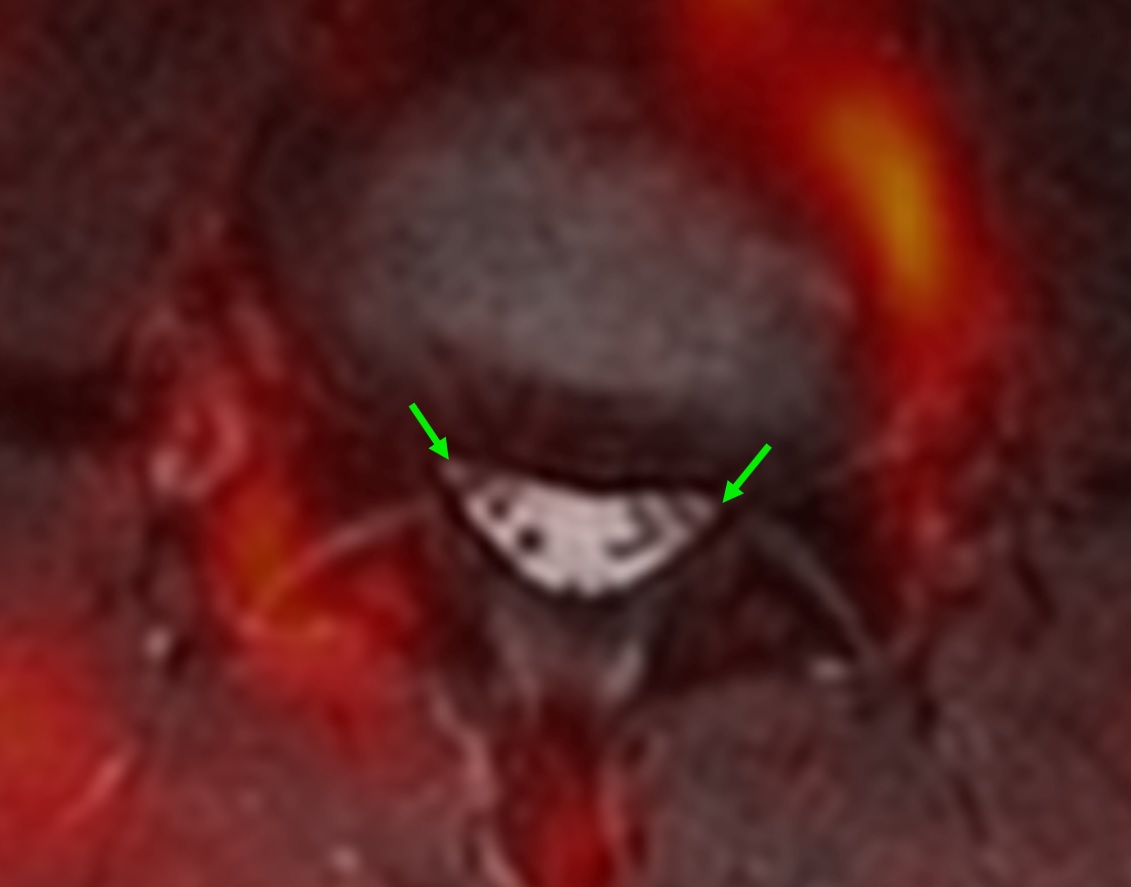
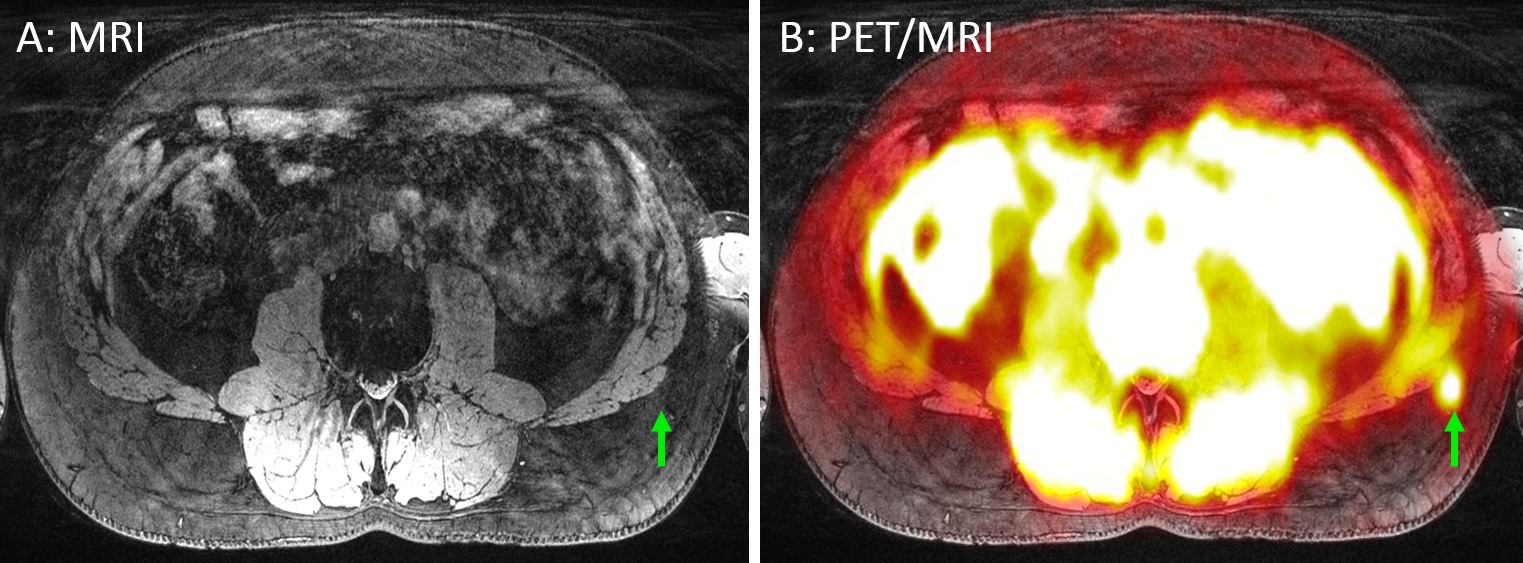
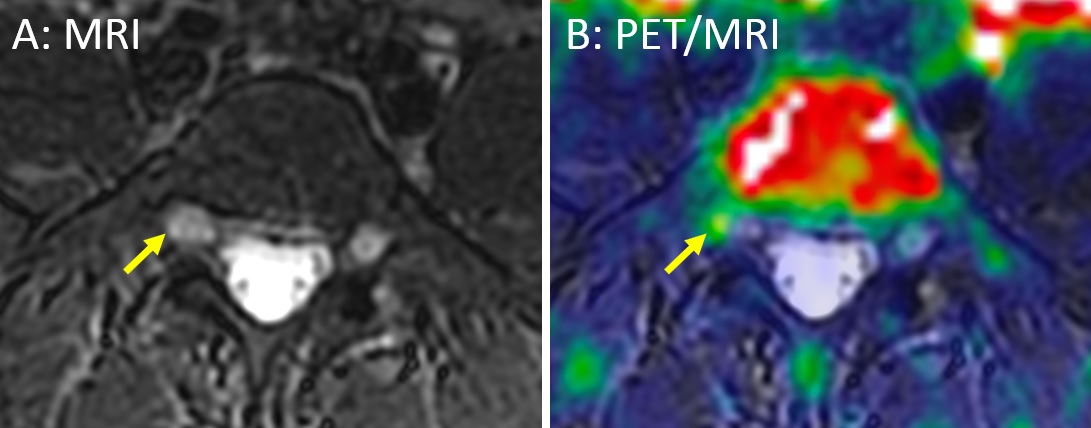
Abnormal lesions were found in all 8 patients, and 18F-FTC-146 PET images presented more abnormal changes than MRI images in general as summarized in Figure 2. Most of MRI-only abnormalities were increased signal on the sciatic nerve or spinal nerves (4 patients). Structural changes, such as central canal stenosis or disc bulge without the increased uptake of 18F-FTC-146, were also observed (Figure 3). Abnormally increased 18F-FTC-146 uptake on paraspinal and pelvic muscles without any abnormalities on MRI were detected in most patients (7 out of 8). Figure 4 shows a case of another PET-only abnormality where an increased focal uptake of 18F-FTC-146 was present on the left flank subcutaneous tissue.Lesions presenting abnormalities on both MRI and 18F-FTC-146 PET were identified on the structures on or proximal to the lumbar spine, such as spinal canal, facet joints, transverse process, and dorsal root ganglion (DRG). Figure 5 shows a case where increased signal was observed on the right L5 DRG in both MRI and PET images. During the follow-up process, we learned that the patient 7 had local anesthetic (bupivacaine) injection on the subcutaneous tissue with high 18F-FTC-146 uptake (Figure 4). The outcome was successful, temporarily reducing the pain score from 6 to 0 when the light med pressure with thumb was applied.
Discussion
In this work, we introduced early results of 18F-FTC-146 PET/MRI in attempt to identify the local sources of low back pain. In all patients, some form of structural or signal abnormalities were identified on either MRI or 18F-FTC-146 PET images. The findings from MRI and 18F-FTC-PET formed a synergistic, complementary impact in determining pain sources. For example, high 18F-FTC-146 uptake at the site of spinal canal stenosis or impinged neuroforamina strengthened its association with pain, which, otherwise, might not have been considered so because of the high false positive rate.Increased 18F-FTC-146 uptake was commonly observed on muscles at the site of pain, despite the absence of atrophy or fat infiltration on MRI. This may suggest the sensitivity of 18F-FTC-146 PET to early inflammatory processes before severe morphologic changes occur. The successful pain relief by anesthetic injection to the foci of high 18F-FTC-146 uptake without any MRI abnormality also indicates the promise of the improved sensitivity of our approach.
Conclusion
In summary, we have introduced early results of 18F-FTC-146 PET/MRI for low back pain diagnosis. Our approach showed the promise for the improved confidence and sensitivity in detecting local sources of pain.Acknowledgements
GE Healthcare, NIH P41 EB015891.References
1. National Institute of Neurological Disorders and Stroke. Low Back Pain Fact Sheet. https://www.ninds.nih.gov/Disorders/Patient-Caregiver-Education/Fact-Sheets/Low-Back-Pain-Fact-Sheet.
2. Chou R, Fu R, Carrino JA, et al. Imaging strategies for low-back pain: systematic review and meta-analysis. Lancet. 2009;373:463-472.3.
3. Webster BS, Cifuentes M. Relationship of early magnetic resonance imaging for work-related acute low back pain with disability and medical utilization outcomes. J Occup Environ Med. 2010;52:900-907.
4. Su TP, Su TC, Nakamura Y, & Tsai SY. The Sigma-1 Receptor as a Pluripotent Modulator in Living Systems. Trends Pharmacol Sci. 2016;37(4):262-278.
5. Shen B, et al. Visualizing Nerve Injury in a Neuropathic Pain Model with [(18)F]FTC-146 PET/MRI. Theranostics. 2017;7(11):2794-2805.
6. Hjornevik T, et al. Biodistribution and Radiation Dosimetry of (18)F-FTC-146 in Humans. J Nucl Med. 2017; 58(12):2004-2009.
Figures