3059
Construction of mGluR5 receptor based in vivo atlas using simultaneously acquired [11C]ABP688 PET / MR data1Institute of Neuroscience and Medicine 4, INM-4, Forschungszentrum Jülich, Jülich, Germany, 2Faculty of Physics, Technical University Dortmund, Dortmund, Germany, 3Department of Psychiatry, Psychotherapy and Psychosomatics, RWTH Aachen University, Aachen, Germany, 4JARA – BRAIN – Translational Medicine, Aachen, Germany, 5Institute of Neuroscience and Medicine 5, INM-5, Forschungszentrum Jülich, Jülich, Germany, 6Department of Nuclear Medicine, RWTH Aachen University, Aachen, Germany, 7Institute of Neuroscience and Medicine 11, INM-4, Forschungszentrum Jülich, Jülich, Germany, 8Department of Neurology, RWTH Aachen University, Aachen, Germany
Synopsis
This project aims to create a standard space in vivo atlas of the mGluR5 distribution in the healthy brain using structural and metabolic information from simultaneously acquired [11C]ABP688-PET / MR data. The structural MRI scans served as an anatomical reference to create a parametric MNI space atlas of mGluR5 non-displaceable binding potential. Validation of the atlas was performed and global as well as local reductions of mGluR5 availability in healthy smokers and schizophrenic smokers that are in line with the results of previous studies could be shown. Preliminary investigation of schizophrenic non-smokers showed slight, though not conclusive, reductions of mGluR5.
Introduction
[11C]ABP688 has been shown to be a promising PET ligand for studying the mGluR5 receptor distribution1. Several studies report possible involvement of mGluR5 in various psychiatric conditions2–4 including schizophrenia5 (SZ). However, a 3D atlas of the mGluR5 distribution in the human brain is not available yet. This study aims to create such an atlas in healthy subjects to enable direct quantitative comparison with schizophrenic patients on the basis of simultaneously acquired PET/MR data. Since an influence of nicotine addiction on mGluR5 availability was shown6, only non-smoking subjects are considered for atlas generation. The 3D in vivo atlas of mGluR5 distribution created in this study can be used in many ways: as a template for PET image transformation into a standard space, as covariate in modelling mGluR5 induced functional MR (fMRI) signal7 and also as a standard reference for investigation in other psychiatric conditions. Furthermore, the data processing pipeline implemented in python with NiPype8 is applicable to other multimodal studies and is not limited to a specific PET tracer.Methods
The study was approved by the Ethics Committee of the Medical Faculty of the RWTH Aachen University. Data processing was performed using NiPype8, FSL9, the MATLAB toolbox SPM1210 and ANTs11. Customizable scripts were written using the functions from the above-mentioned toolboxes to enable semi-automatic processing of PET/MR data. The processing steps and tools were chosen based on literature and visual inspection.The simultaneous trimodal data were acquired using a hybrid 3T MR-BrainPET scanner system (Siemens, Erlangen, Germany)12. Data from subjects 13 healthy male non-smokers (NS) (age = 27.6 ± 8.8) were considered for atlas generation. (429.0±57.4) MBq of [11C]ABP688 were injected as bolus + infusion (B/I ratio = 60 minutes) simultaneously with the start of PET data acquisition (65 minutes) in list mode.
MR processing:
The ANTs brain extraction script computed extraction masks which were manually corrected in case of inconsistencies. The extracted brains were used to calculate non-linear transformations into the MNI space with ANTs. A T1 MNI template (version 2009c non-linear asymmetric)13 was used as reference. The resulting forward and backward transformations were saved to be applied to preprocessed PET images later.
PET processing:
The first 40 minutes of PET acquisition were iteratively reconstructed into 20 frames (20x120 s), with a matrix size of 256x256x153 (voxel size: 1.25x1.25x1.25 mm3). Smoothing (2.5 mm Gaussian filter), motion correction and coregistration to the respective structural MR image were performed in SPM12. The coregistration quality was visually inspected for misalignments and the motion correction parameters were controlled for large values (motions of more than 2.5 mm translation or 7° rotation were rejected). PET frames between 28 - 36 min after injection were considered for later analysis because in this interval the radiotracer reached the expected equilibrium in the brain while the subject was at eyes-closed resting condition. The activity over the considered frames was summed and the non-displaceable binding potential (BPND) was calculated for all voxels in subject space using the equilibrium simple ratio method14,15 with the cerebellum as reference tissue. The resulting BPND images were then transformed into MNI-space by ANTs with the MR-based transforms. Finally, an average image of the MNI-space BPND images was created to be used as an in vivo mGluR5-atlas.
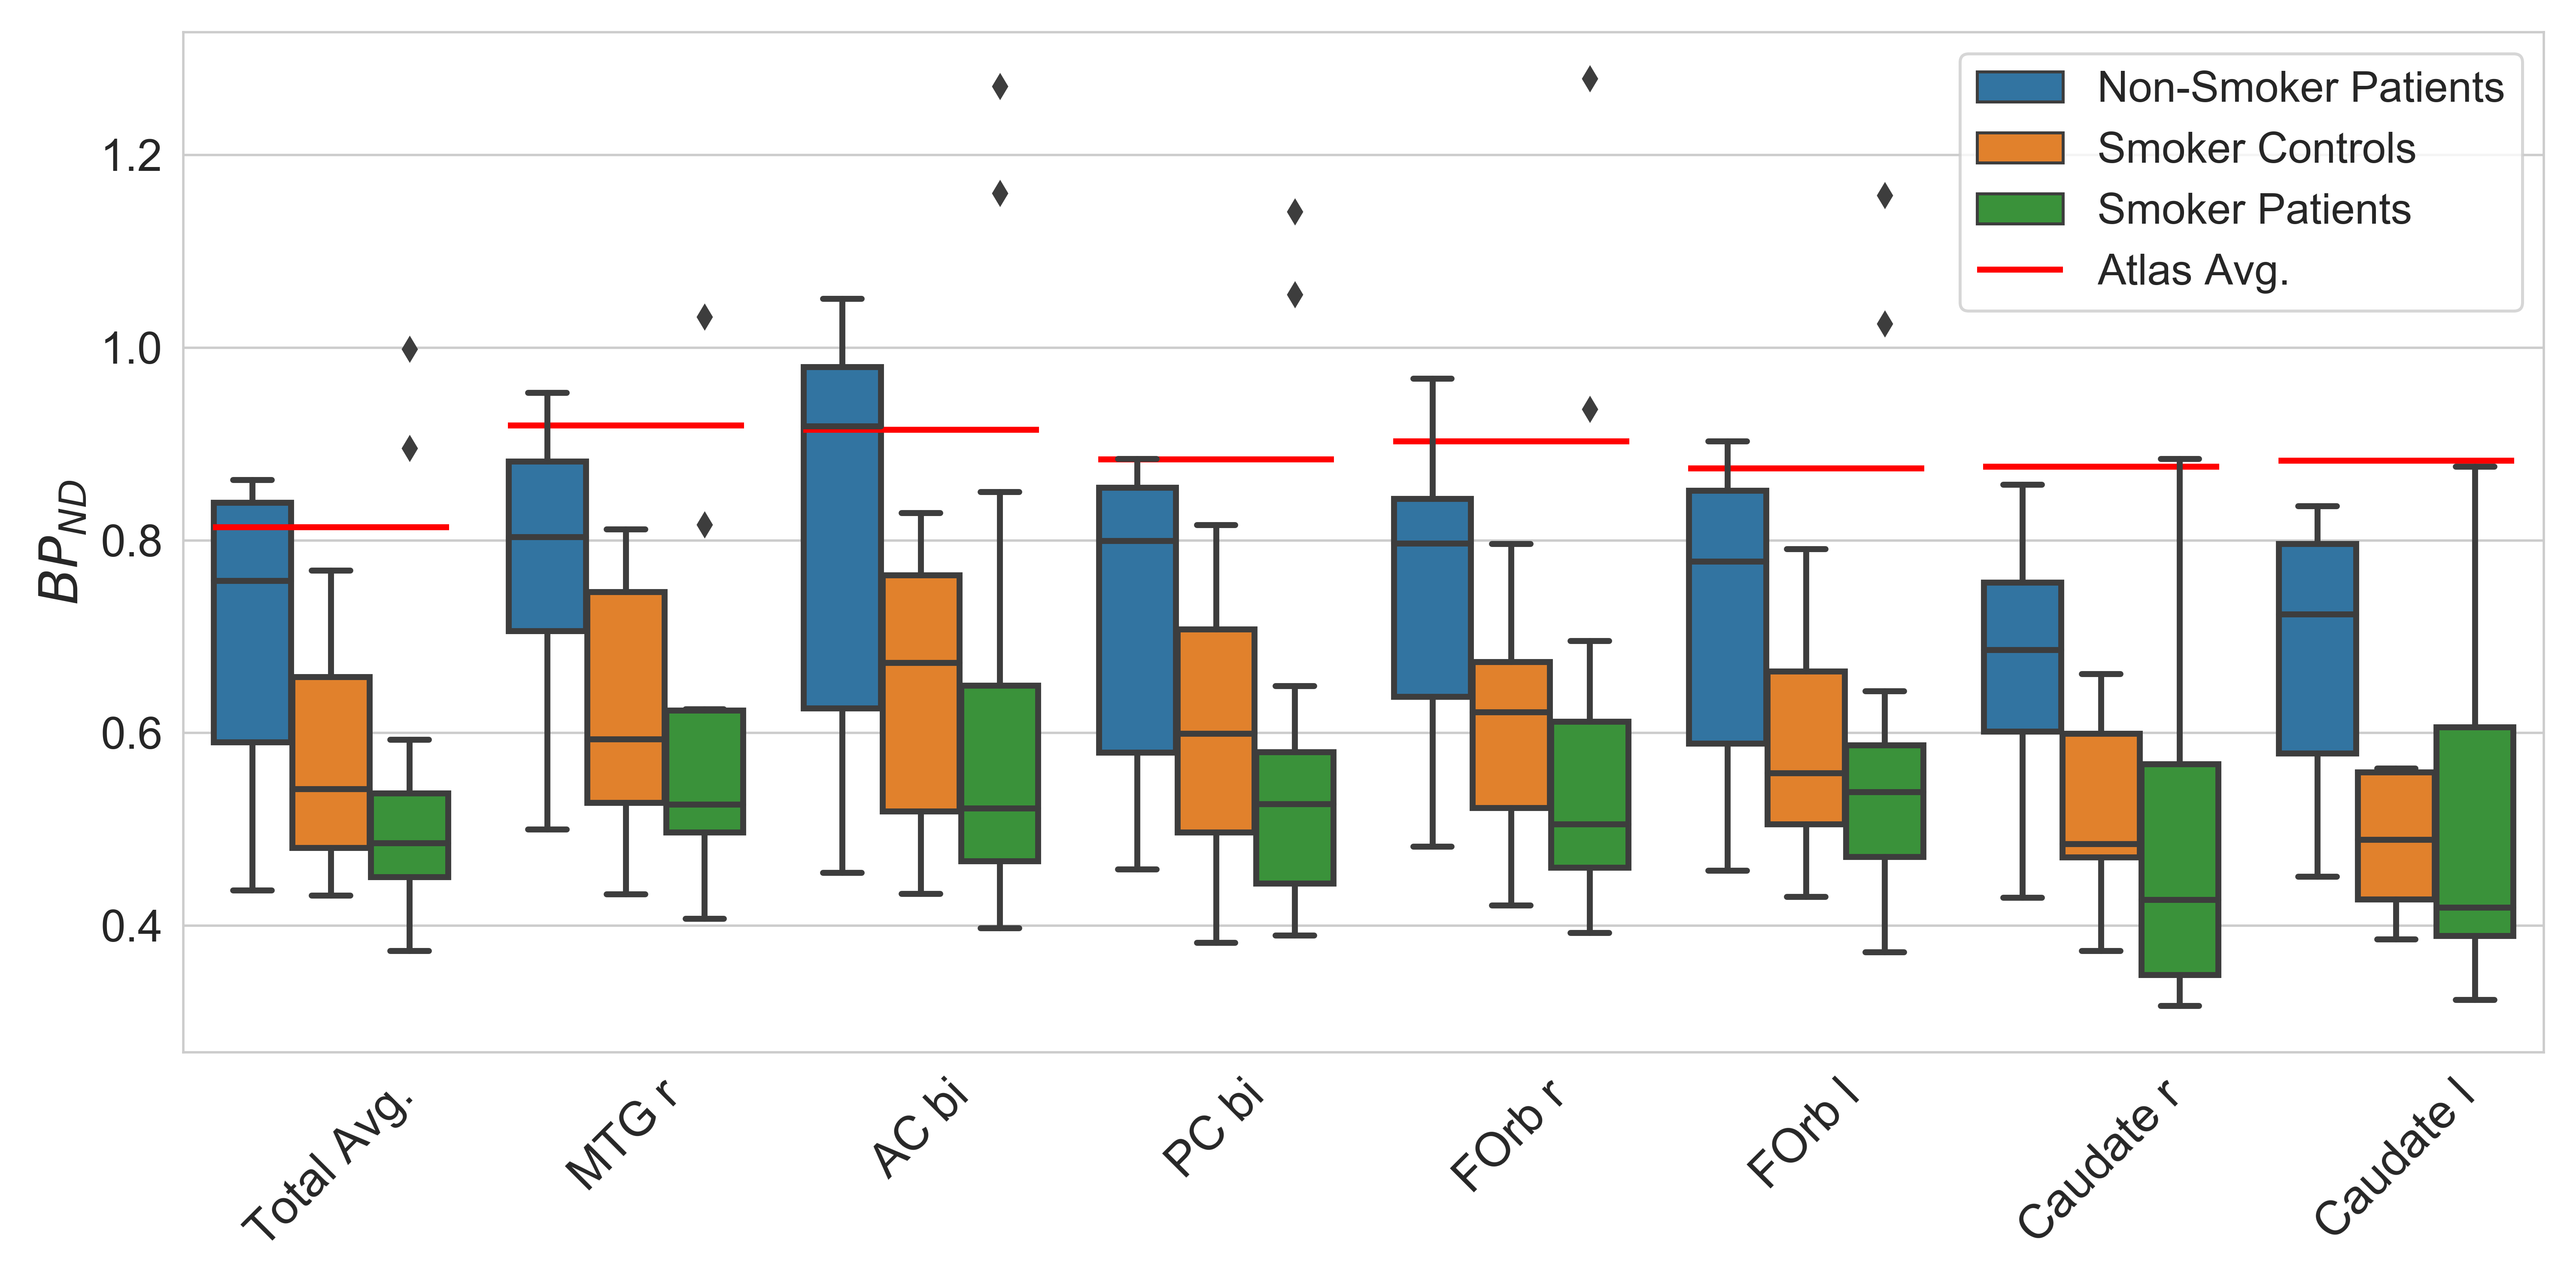
In order to validate the atlas, previously conducted studies of the mGluR5 distribution were considered. Regions reported to have particularly high receptor density1 or to be affected by smoking6 were analyzed. For region definition, the Harvard-Oxford cortical and subcortical atlas distributed with the CONN software package16 was used. The additional data required for validation were taken from the same study. Included was a group of smoker controls (SC) (n=7, age=46.3±10.0), a group of non-smoking (NS) SZ patients (n=7, age=34.0±10.8) and a group of smoker SZ-patients (SP) (n=13, age = 40.9±10.7).
Results
The atlas average in the respective region in comparison to all above groups is given in Fig. 1. The total BPND is clearly reduced for the SC and the SP group compared to the atlas reference value and the NS patients. In all selected regions the trend seems to be that the median of the NS patients is very close to the atlas value: diffNS = (11.5±6.1)%, whereas the mean difference of SC and the SP is diffSC = (35.5±5.0)% and diffSP = (44.1±4.8)% respectively. An example slice of the atlas for all orientations and the respective standard deviation slices are given in Fig. 2.Discussion
A 3D in vivo atlas reflecting the mGluR5 receptor distribution was successfully constructed. The validation results are in line with results of previous studies of the mGluR5 system1,6. The absolute BPND values compared to previous findings17 are similar in most regions but differ in a few. Furthermore, two subjects from the SP group are marked as outliers in almost all analyzed regions. The reasons for these inconsitencies are unclear and may need to be further investigated.Conclusions
Further investigation using the in vivo atlas of mGluR5 is justified. Initial comparisons to schizophrenics (NS & SP) show a visible trend of reduced BPND compared to healthy controls. This could hint towards a possible involvement of mGluR5 in schizophrenia which also motivates more thorough investigation.Acknowledgements
We thank Dr. Andreas Matusch for guidance with metabolite correction for PET imaging. We would like to acknowledge our gratitude to Claire Rick for proofreading the abstract. We thank Andrea Muren, Cornelia Frey, Silke Frensch, and Suzanne Schaden for their technical assistance. This study was in part supported by the EU FP7 funded project TRIMAGE (Nr. 602621).References
1. Ametamey, S. M. et al. Human PET studies of metabotropic glutamate receptor subtype 5 with 11C-ABP688. J. Nucl. Med. 48, 247–252 (2007).
2. Tatarczyńska, E. et al. Potential anxiolytic-and antidepressant-like effects of MPEP, a potent, selective and systemically active mGlu5 receptor antagonist. Br. J. Pharmacol. 132, 1423–1430 (2001).
3. Rouse, S. T. et al. Distribution and roles of metabotropic glutamate receptors in the basal ganglia motor circuit: implications for treatment of Parkinson’s disease and related disorders. Pharmacol. Ther. 88, 427–435 (2000).
4. Spooren, W. P. J. M. et al. Anxiolytic-like effects of the prototypical metabotropic glutamate receptor 5 antagonist 2-methyl-6-(phenylethynyl) pyridine in rodents. J. Pharmacol. Exp. Ther. 295, 1267–1275 (2000).
5. Uno, Y. & Coyle, J. T. Glutamate hypothesis in schizophrenia. Psychiatry Clin. Neurosci. 73, 204–215 (2019).
6. Akkus, F. et al. Marked global reduction in mGluR5 receptor binding in smokers and ex-smokers determined by [11C] ABP688 positron emission tomography. Proc. Natl. Acad. Sci. 110, 737–742 (2013).
7. Mandeville, J. B. et al. A receptor-based model for dopamine-induced fMRI signal. Neuroimage 75, 46–57 (2013).
8. Gorgolewski, K. et al. Nipype: a flexible, lightweight and extensible neuroimaging data processing framework in python. Front Neuroinform 5, (2011).
9. Jenkinson, M., Beckmann, C. F., Behrens, T. E. J., Woolrich, M. W. & Smith, S. M. Fsl. Neuroimage 62, 782–790 (2012).
10. Penny, W. D., Friston, K. J., Ashburner, J. T., Kiebel, S. J. & Nichols, T. E. Statistical parametric mapping: the analysis of functional brain images. (Elsevier, 2011).
11. Avants, B. B. et al. A reproducible evaluation of ANTs similarity metric performance in brain image registration. Neuroimage 54, 2033–2044 (2011).
12. Herzog, H. et al. High resolution BrainPET combined with simultaneous MRI. Nuklearmedizin 50, 74–82 (2011).
13. Fonov, V. S., Evans, A. C., McKinstry, R. C., Almli, C. R. & Collins, D. L. Unbiased nonlinear average age-appropriate brain templates from birth to adulthood. Neuroimage S102 (2009).
14. Carson, R. E. et al. Comparison of bolus and infusion methods for receptor quantitation: application to [18F] cyclofoxy and positron emission tomography. J. Cereb. Blood Flow Metab. 13, 24–42 (1993).
15. Ito, H., Hietala, J., Blomqvist, G., Halldin, C. & Farde, L. Comparison of the transient equilibrium and continuous infusion method for quantitative PET analysis of [11C] raclopride binding. J. Cereb. Blood Flow Metab. 18, 941–950 (1998).
16. Whitfield-Gabrieli, S. & Nieto-Castanon, A. Conn: a functional connectivity toolbox for correlated and anticorrelated brain networks. Brain Connect. 2, 125–141 (2012).
17. Akkus, F. et al. Association of long-term nicotine abstinence with normal metabotropic glutamate receptor-5 binding. Biol. Psychiatry 79, 474–480 (2016).
18. Hunter, J. D. {Matplotlib}: A {2D} Graphics Environment. Comput. Sci. Eng. 9, 90–95 (2007).
19. Waskom, M. et al. seaborn: v0.5.0 (November 2014). (2014) doi:10.5281/zenodo.12710.
20. Oliphant, T. E. {NumPy}: {Python} for Scientific Computing. Comput. Sci. Eng. 9, 10–20 (2007).
21. McKinney, W. Data Structures for Statistical Computing in Python. in Proceedings of the 9th Python in Science Conference (eds. van der Walt, S. & Millman, J.) 51–56 (2010).
Figures