3058
Hippocampal Subfield Tau Progression Identified using Simultaneous Tau-PET/MRI at 3T in Alzheimer’s Disease1Bioengineering, Stanford University, Stanford, CA, United States, 2Neurology, Stanford University, Stanford, CA, United States, 3Radiology, Stanford University, Stanford, CA, United States
Synopsis
We found structural changes and tau protein accumulation within the hippocampus that can be simultaneously assessed at the subfield level in Alzheimer’s Disease. We found more separation among AD, mild cognitive impairment (MCI), and control groups when considering subfields than whole hippocampal SUVr. This study highlights the potential of our combined subfield analysis technique in disentangling pathologic derangements accompanying AD in the hippocampus and for providing more nuanced imaging-based measures for tracking and staging disease in vivo.
Introduction
Tau protein accumulation is one of the pathological hallmarks of Alzheimer’s Disease, and the distribution pattern of neurofibrillary pathology has been characterized well in histology and correlates with symptomatology. Hippocampal involvement begins in the transentorhinal region, progresses to the entorhinal region, then the hippocampal formation, before spreading into the adjacent neocortex.1 Tau-PET studies have shown that patterns of tracer uptake correspond with Braak staging but have been limited to whole-hippocampal analysis due to low resolution in PET-CT imaging. Here, we show that by using simultaneous tau-PET/MRI and fine-tuned registration, we can detect subtle differences in tau tracer accumulation and volume within hippocampal subfields that is consistent with known histological patterning. We are using a tracer that has relatively low choroid plexus binding, PI-2620, that would otherwise obscure hippocampal uptake.Methods
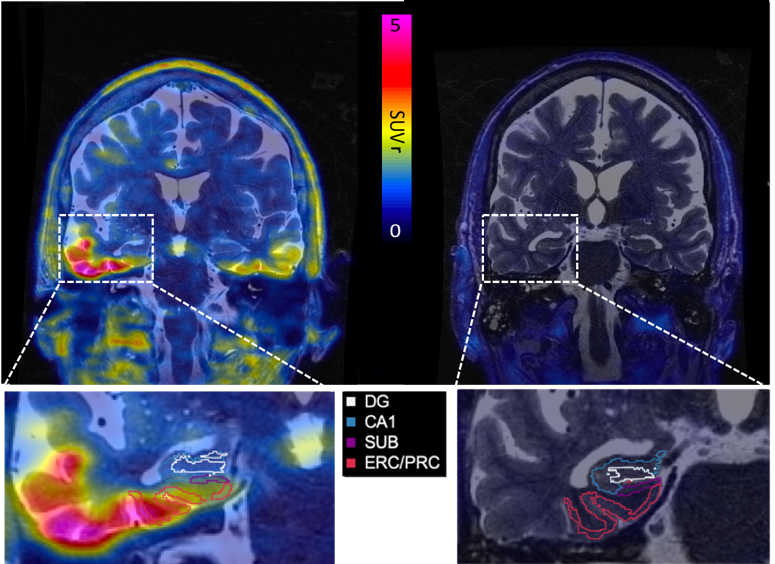
A total of 24 subjects, 5 probable AD (68.8±10.64 years old), 6 mild cognitive impairment (71.2±8.47 years old), and 13 healthy control (71.5±8.75 years old), underwent a dynamic 90-minute tau-PET scan on a 3T PET-MR (SIGNA, GE, WI, USA) using time-of-flight (TOF) capability following a 5mCi intravenous injection of PI-2620 (Life Molecular Imaging, Inc.). During the PET acquisition, we acquired a sagittal T1-weighted inversion recovery spoiled gradient echo (TR 7.6ms, TE 3.1ms, FA 11, 1x1x1.2mm resolution, 5m46s scan time) and a coronal-oblique T2-weighted fast spin echo (TR 14111ms, TE 102.4ms, FA 111, 0.43x0.43x1.9mm resolution, 3m24s scan time). Standardized uptake value (SUV) maps were calculated from 60-90 minute summed PET data and normalized to the inferior cerebellar cortex of each subject using a modified FreeSurfer segmentation to produce SUV ratio maps (SUVr). SUVr maps were precisely registered to coronal T2 MR image space using the T1-w IRFSPGR as an intermediate registration volume with niftireg. Hippocampal subfields were segmented using Automated Segmentation of Hippocampal Subfields (NASHS, Penn Image Computing & Science Lab) using a tailored atlas.2 Four subfields were included in our analyses: cornu ammonis 1 (CA1), dentate gyrus and CA2-4 as one combined subfield (DG), subiculum (SUB), and entorhinal and perirhinal cortices (ERC/PRC). Hippocampal subfields volumes were calculated in coronal T2 MR space, and PET images were mapped into the same space to quantify mean SUVr (Figure 1). In calculating mean SUVr, subfields were 1-voxel 2D-eroded in the oblique coronal plane to avoid partial volume effects. Statistics were calculated using a linear regression model correcting for head size (estimated by FreeSurfer) and age, comparing the combined AD/MCI cohort with controls.Results
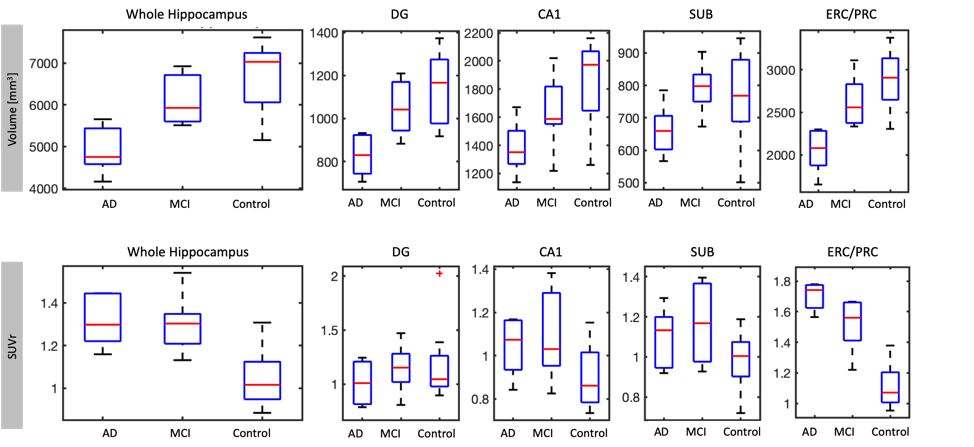
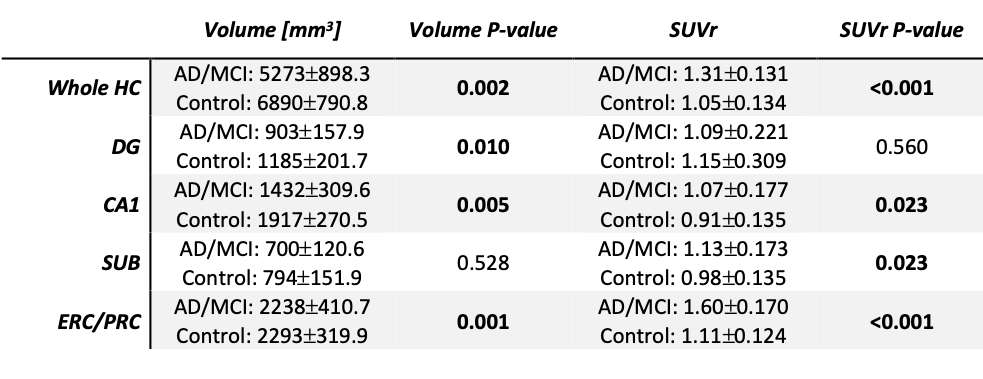
Volume: The combined group of AD/MCI subjects had lower whole hippocampal volume compared to controls (p=0.002). All subfields except subiculum had significantly smaller volume in AD/MCI than controls (Figure 2, Table 1). Volume difference between AD and MCI was significant in the whole hippocampus (p=0.023) and all subfields except CA1. Volume difference between controls and MCI was only significant for ERC/PRC (p=0.038).SUVr: Whole hippocampus SUVr was statistically higher in AD/MCI than controls (Figure 2, Table 1, (p<0.001)). SUVr was also significantly higher in AD/MCI than controls in the ERC/PRC (p<0.001), SUB (p=0.023), and CA1 (p=0.023), but not DG (p=0.560). SUVr difference between AD and MCI was not significant in any subfield or the whole hippocampus, but closest in ERC/PRC (p=0.08). SUVr difference between controls and MCI was also significant in ERC/PRC (p<0.001), CA1 (p=0.045), subiculum (p=0.028) and whole hippocampus (p=0.002).
Discussion
By using simultaneous time-of-flight PET and high-resolution MRI acquisition along with improved segmentations and a tracer with relatively low choroid plexus uptake, we were able to analyze metabolic and volumetric differences while minimizing partial volume effects in hippocampal subfields of AD, MCI, and healthy subjects. We identified the progression of tau in the medial temporal lobe that has been presumed by post-mortem pathology, with the most significant involvement in the ERC/PRC, less significant in CA1, and no differences in this small cohort in the DG.Conclusion
Simultaneous TOF tau-PET/MRI allows us to investigate subtle differences in hippocampal subfields along the spectrum of Alzheimer’s Disease. Comparisons among AD, MCI, and control subjects show statistically significant differences in tracer uptake and volume that correspond with known neurofibrillary pathological progression (transentorhinal/entorhinal cortices, followed by CA1, followed by DG). This method may serve useful to interrogate different stages of the disorder and the effect of therapeutics.Acknowledgements
No acknowledgement found.References
1. Braak, H., Alafuzoff, I., Arzberger, T., Kretzschmar, H., & Del Tredici, K. (2006). Staging of Alzheimer disease-associated neurofibrillary pathology using paraffin sections and immunocytochemistry. Acta neuropathologica, 112(4), 389–404. doi:10.1007/s00401-006-0127-z
2. Parivash, S. N., Goubran, M., Mills, B. D., Rezaii, P., Thaler, C., Wolman, D., … Zeineh, M. (2019). Longitudinal Changes in Hippocampal Subfield Volume Associated with Collegiate Football. Journal of Neurotrauma, 36(19), 2762–2773. doi: 10.1089/neu.2018.6357
Figures