3056
Effectiveness of fat suppression using a water-selective binomial-pulse excitation in Chemical Exchange Saturation Transfer (CEST) MRI1Shanghai Key Laboratory of Magnetic Resonance, Shanghai, China, 2Vanderbilt University Institute of Imaging Science, Nashville, TN, United States
Synopsis
The purpose of this study was to characterize the contribution of fat to the CEST signal when using a water-selective binomial-pulse excitation and the effects of multiple fat peaks and B0 inhomogeneity. A CEST sequence with binomial-pulse excitation and a modified PRESS localization was applied to in vivo experiments to determine signal contributions of lipid resonances. Water excitation using a {1-3-3-1} pulse provided a broad signal suppression, which provided robustness against B0 inhomogeneity. Significant fat signal contributions to CEST imaging of hydroxyl and amine were unavoidable, while much smaller contamination was seen when imaging amide sites, limited by B0 inhomogeneity.
Introduction
Artifacts caused by strong lipid signals pose challenges in body CEST imaging. One approach to fat suppression is water-selective excitation (WE) using a binomial RF pulse 1-4. The binomial RF pulse approach is designed to emphasize the suppression of the main fat peak 5,6, ignoring the inferior fat peaks. Furthermore, body MRI is more prone to B0 inhomogeneity than brain MRI, and WE is relatively sensitive to such inhomogeneities. To characterize the contribution of fat to the CEST signal In the WE-based CEST MRI and the effects of multiple fat peaks and B0 inhomogeneity, a modified point-resolved spectroscopy (mPRESS) is used to acquire signals after CEST preparation.Methods
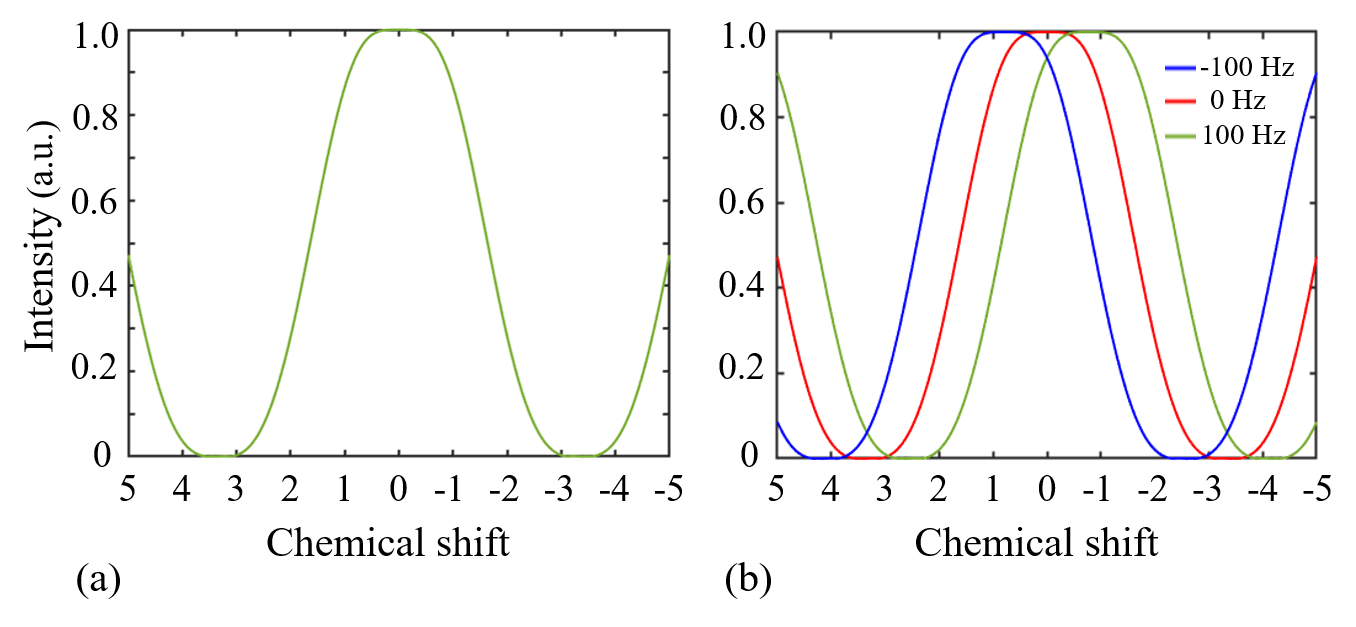
SimulationA simulation based on the numerical solution of Bloch equation was conducted to investigate the performance of WE in the type of {1-3-3-1}. The resulting excitation profile was defined as the magnitude of the transverse magnetization.
Pulse sequences
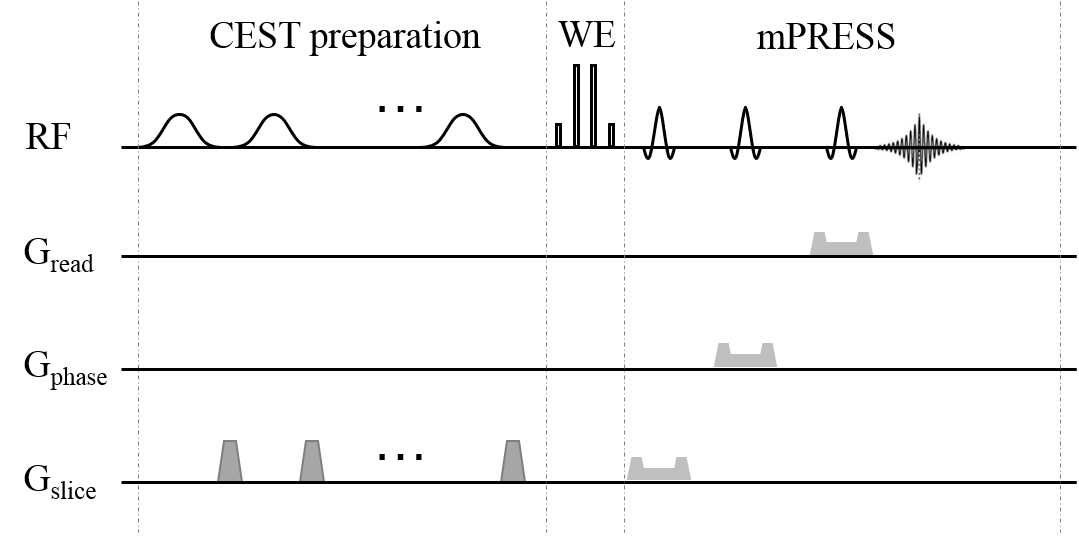
The CEST-mPRESS sequence (Figure 1) consists of three sections: the CEST preparation, WE excitation using a {1-3-3-1} pulse, and the mPRESS acquisition. The CEST preparation contains a train of Gaussian-shaped RF pulses and spoiling gradients. In the timing of mPRESS, the first slice-selective 90° RF pulse in the conventional PRESS was replaced by a slice-selective 180° RF pulse. Additionally, the frequency offset of numerically controlled oscillator (NCO) during WE was used to generate an off-resonance effect that was equivalent to the off-resonance effect induced by B0 inhomogeneity.
In vivo experiments
One male volunteer, 57-year-old, was recruited. The volume of interest (VOI) with high proton-density fat fraction (PDFF) for the CEST-mPRESS sequence was located at the spinal cord, which was determined by the measurement of PDFF using HISTO 7. The CEST preparation consisted of 6 Gaussian-shaped pulses, each 200 ms long, with an average B1 = 1.6 μT. Frequency offsets were acquired in Z-spectrum from −5 ppm to 5 ppm, and one reference acquisition without saturation was also acquired. The frequency offsets of NCO were set to provide the equivalent values of ∆B0 spanning from −100 to 100 Hz with an increment of 10 Hz.
Data processing
The Z-spectrum from each individual fat peak was based on the areas under the corresponding peak in the 1H spectra. Adjacent fat peaks were analyzed as a group for the Z-spectra analysis, and MTRasym was calculated to quantify lipid artifacts. Total lipid artifacts from fat peaks was estimated by adding MTRasym of the fat peaks.
Results
SimulationFigure 2 shows excitation profiles from the numerical simulation for WE. The excitation profiles are plotted on the chemical shift scales. A broad near-zero range exists near the main spectral peak of fat. B0 inhomogeneity leads to a corresponding shift of the excitation profile along the axis of chemical shift.
In vivo experiment
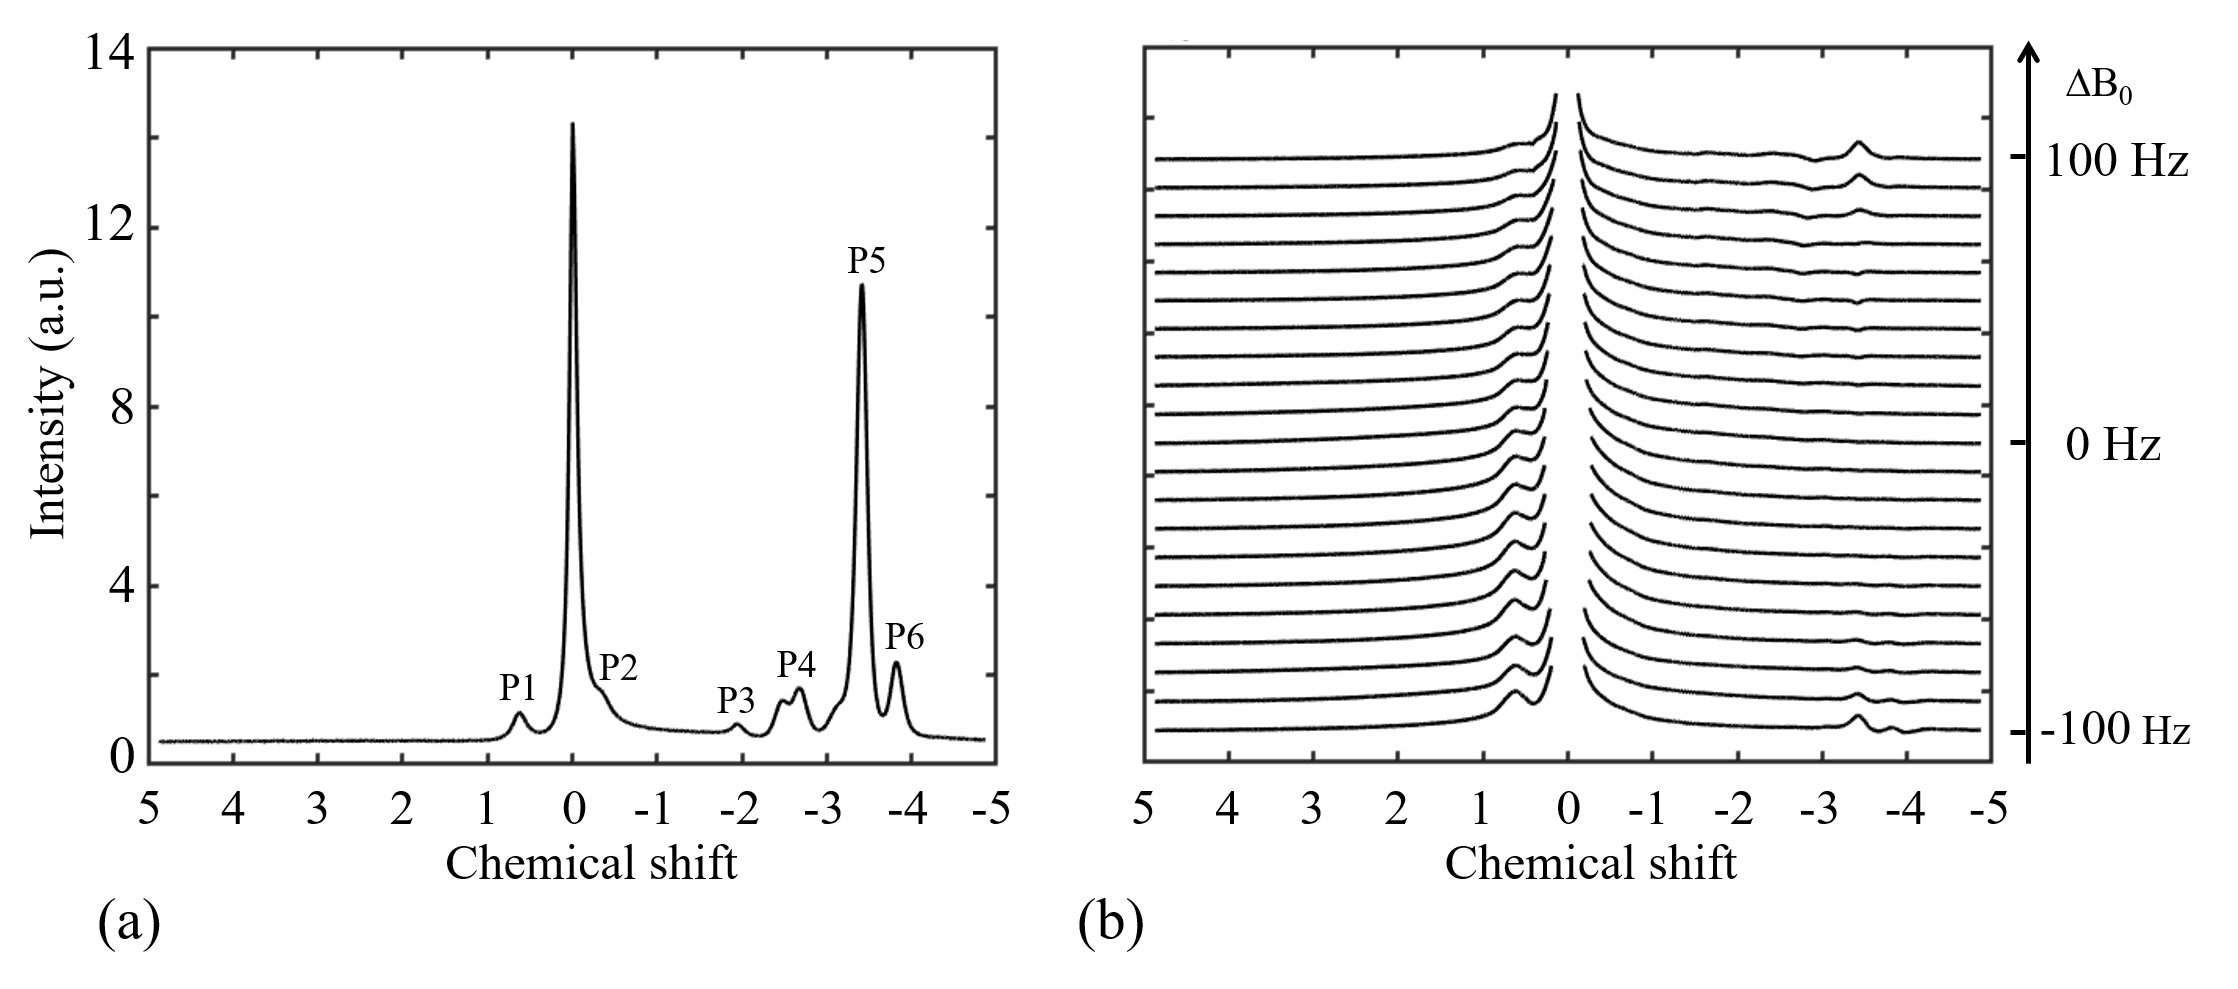
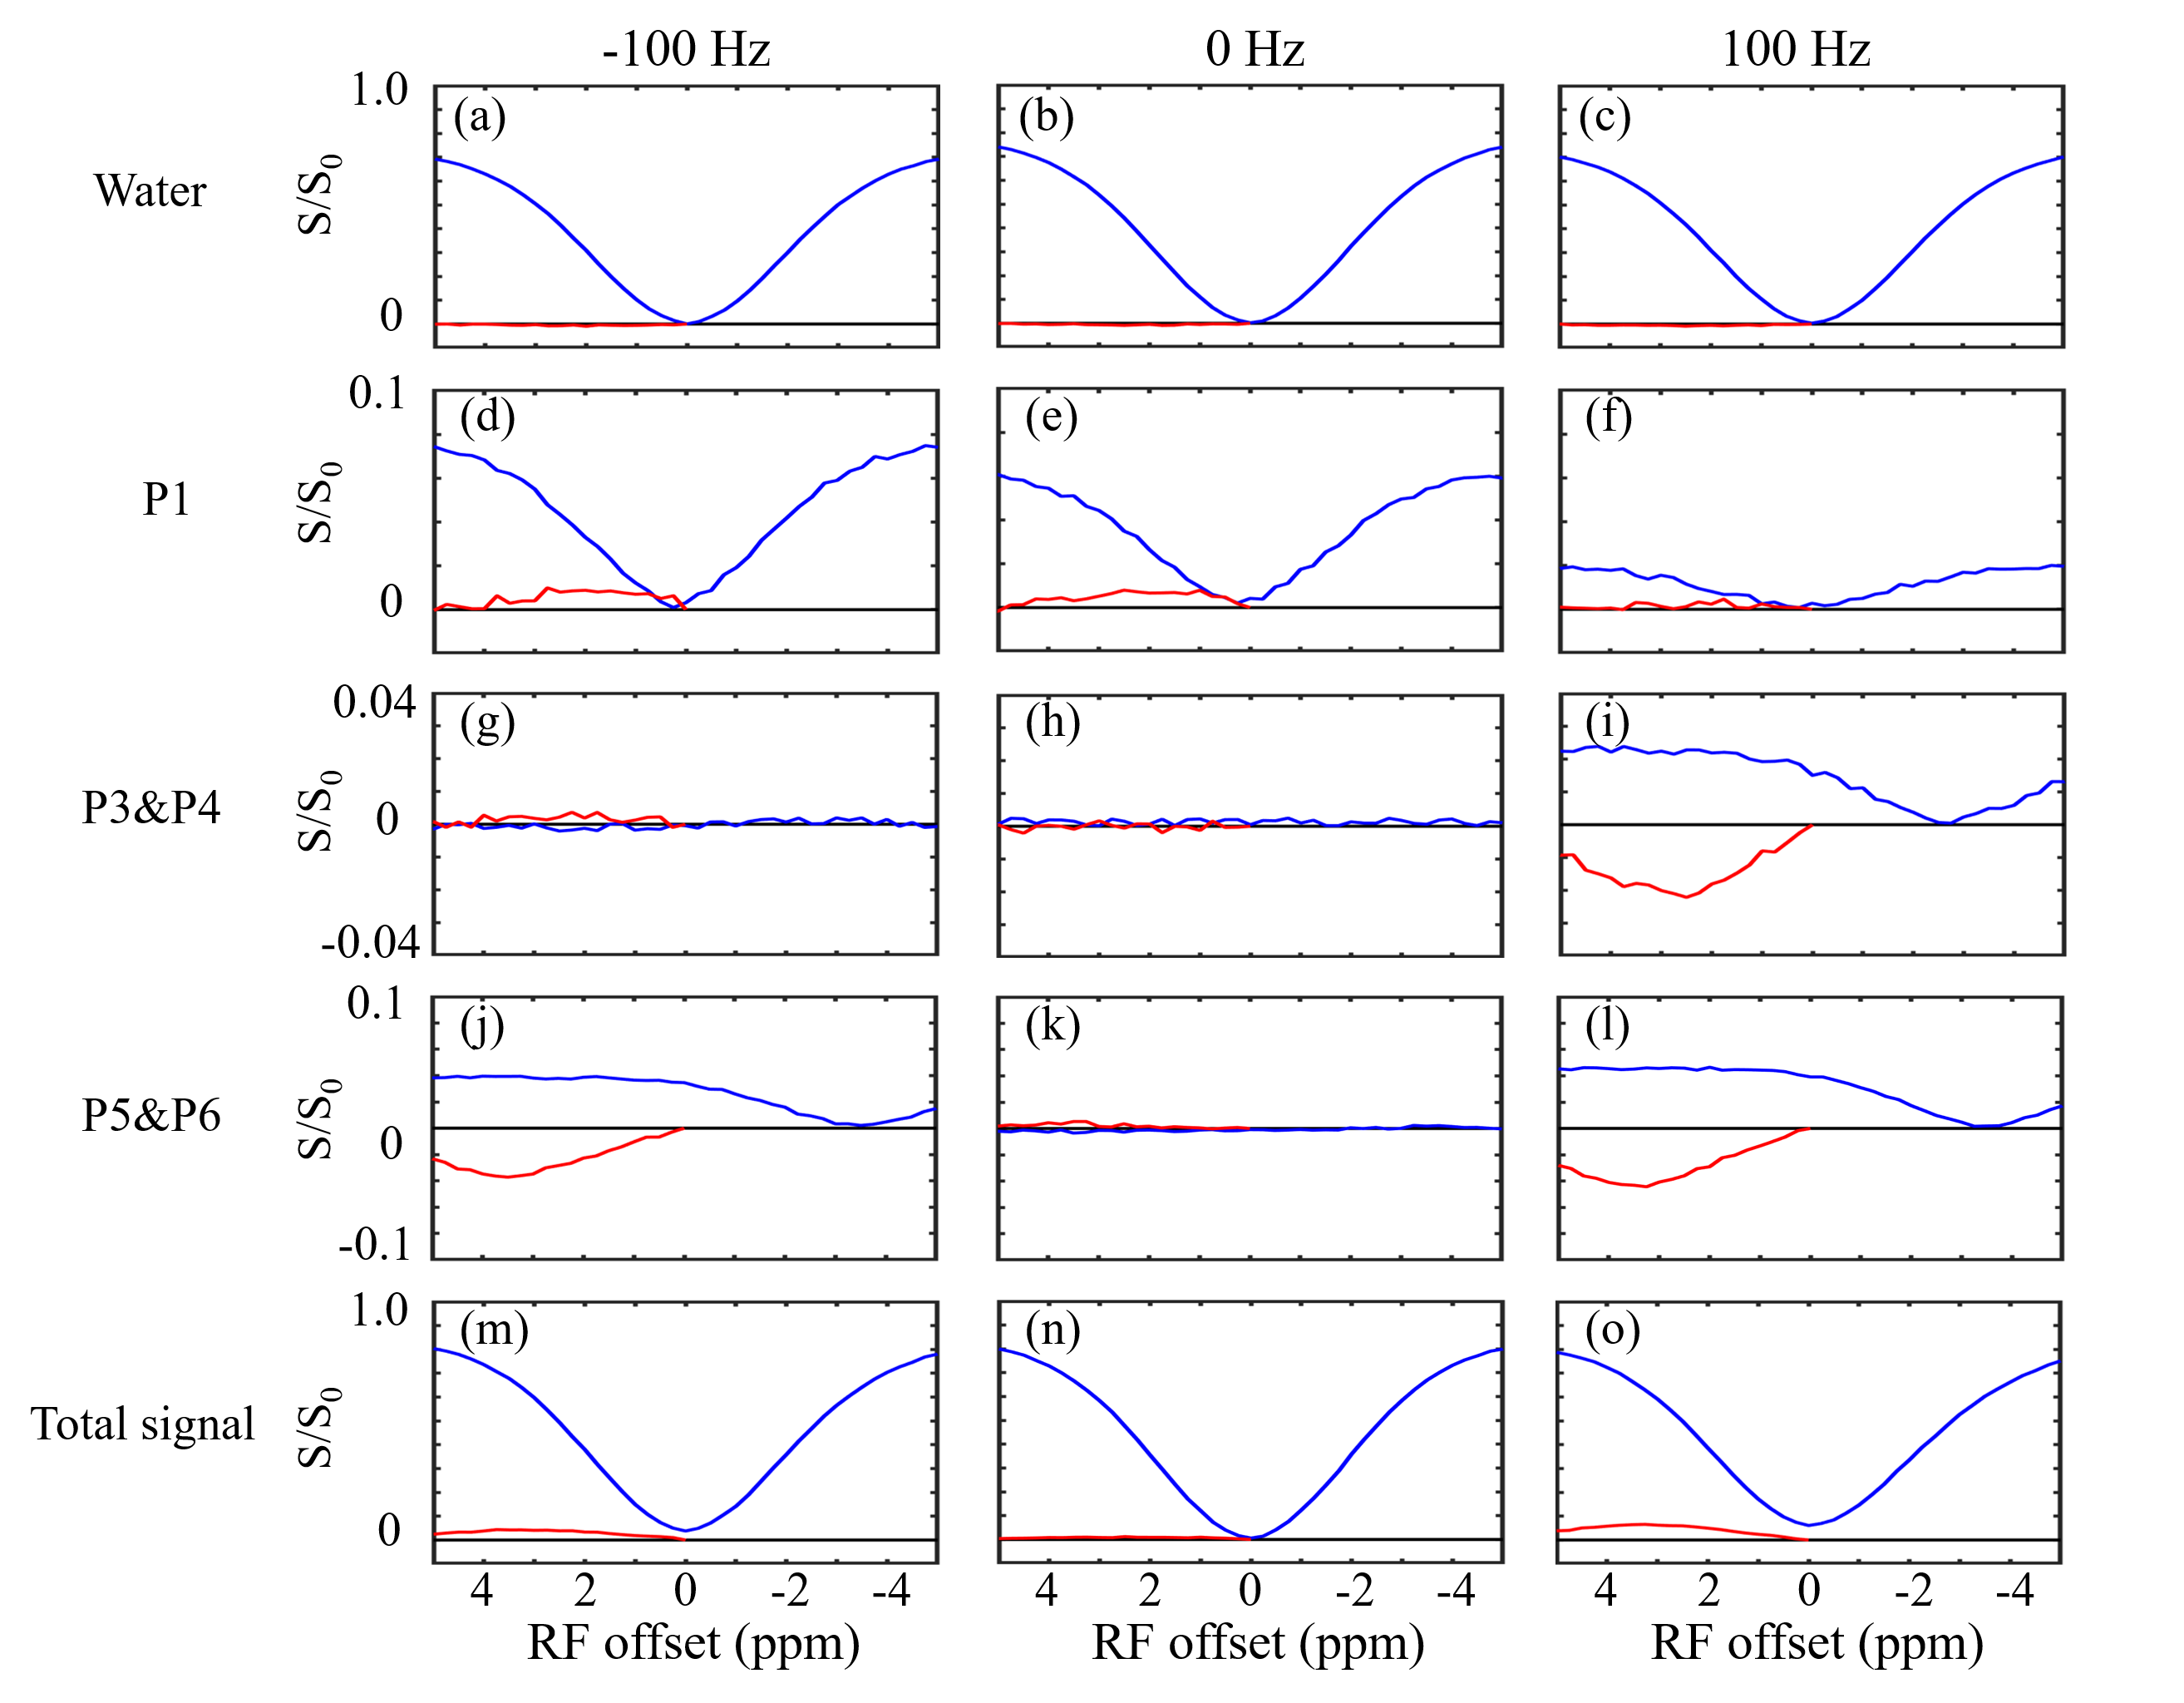
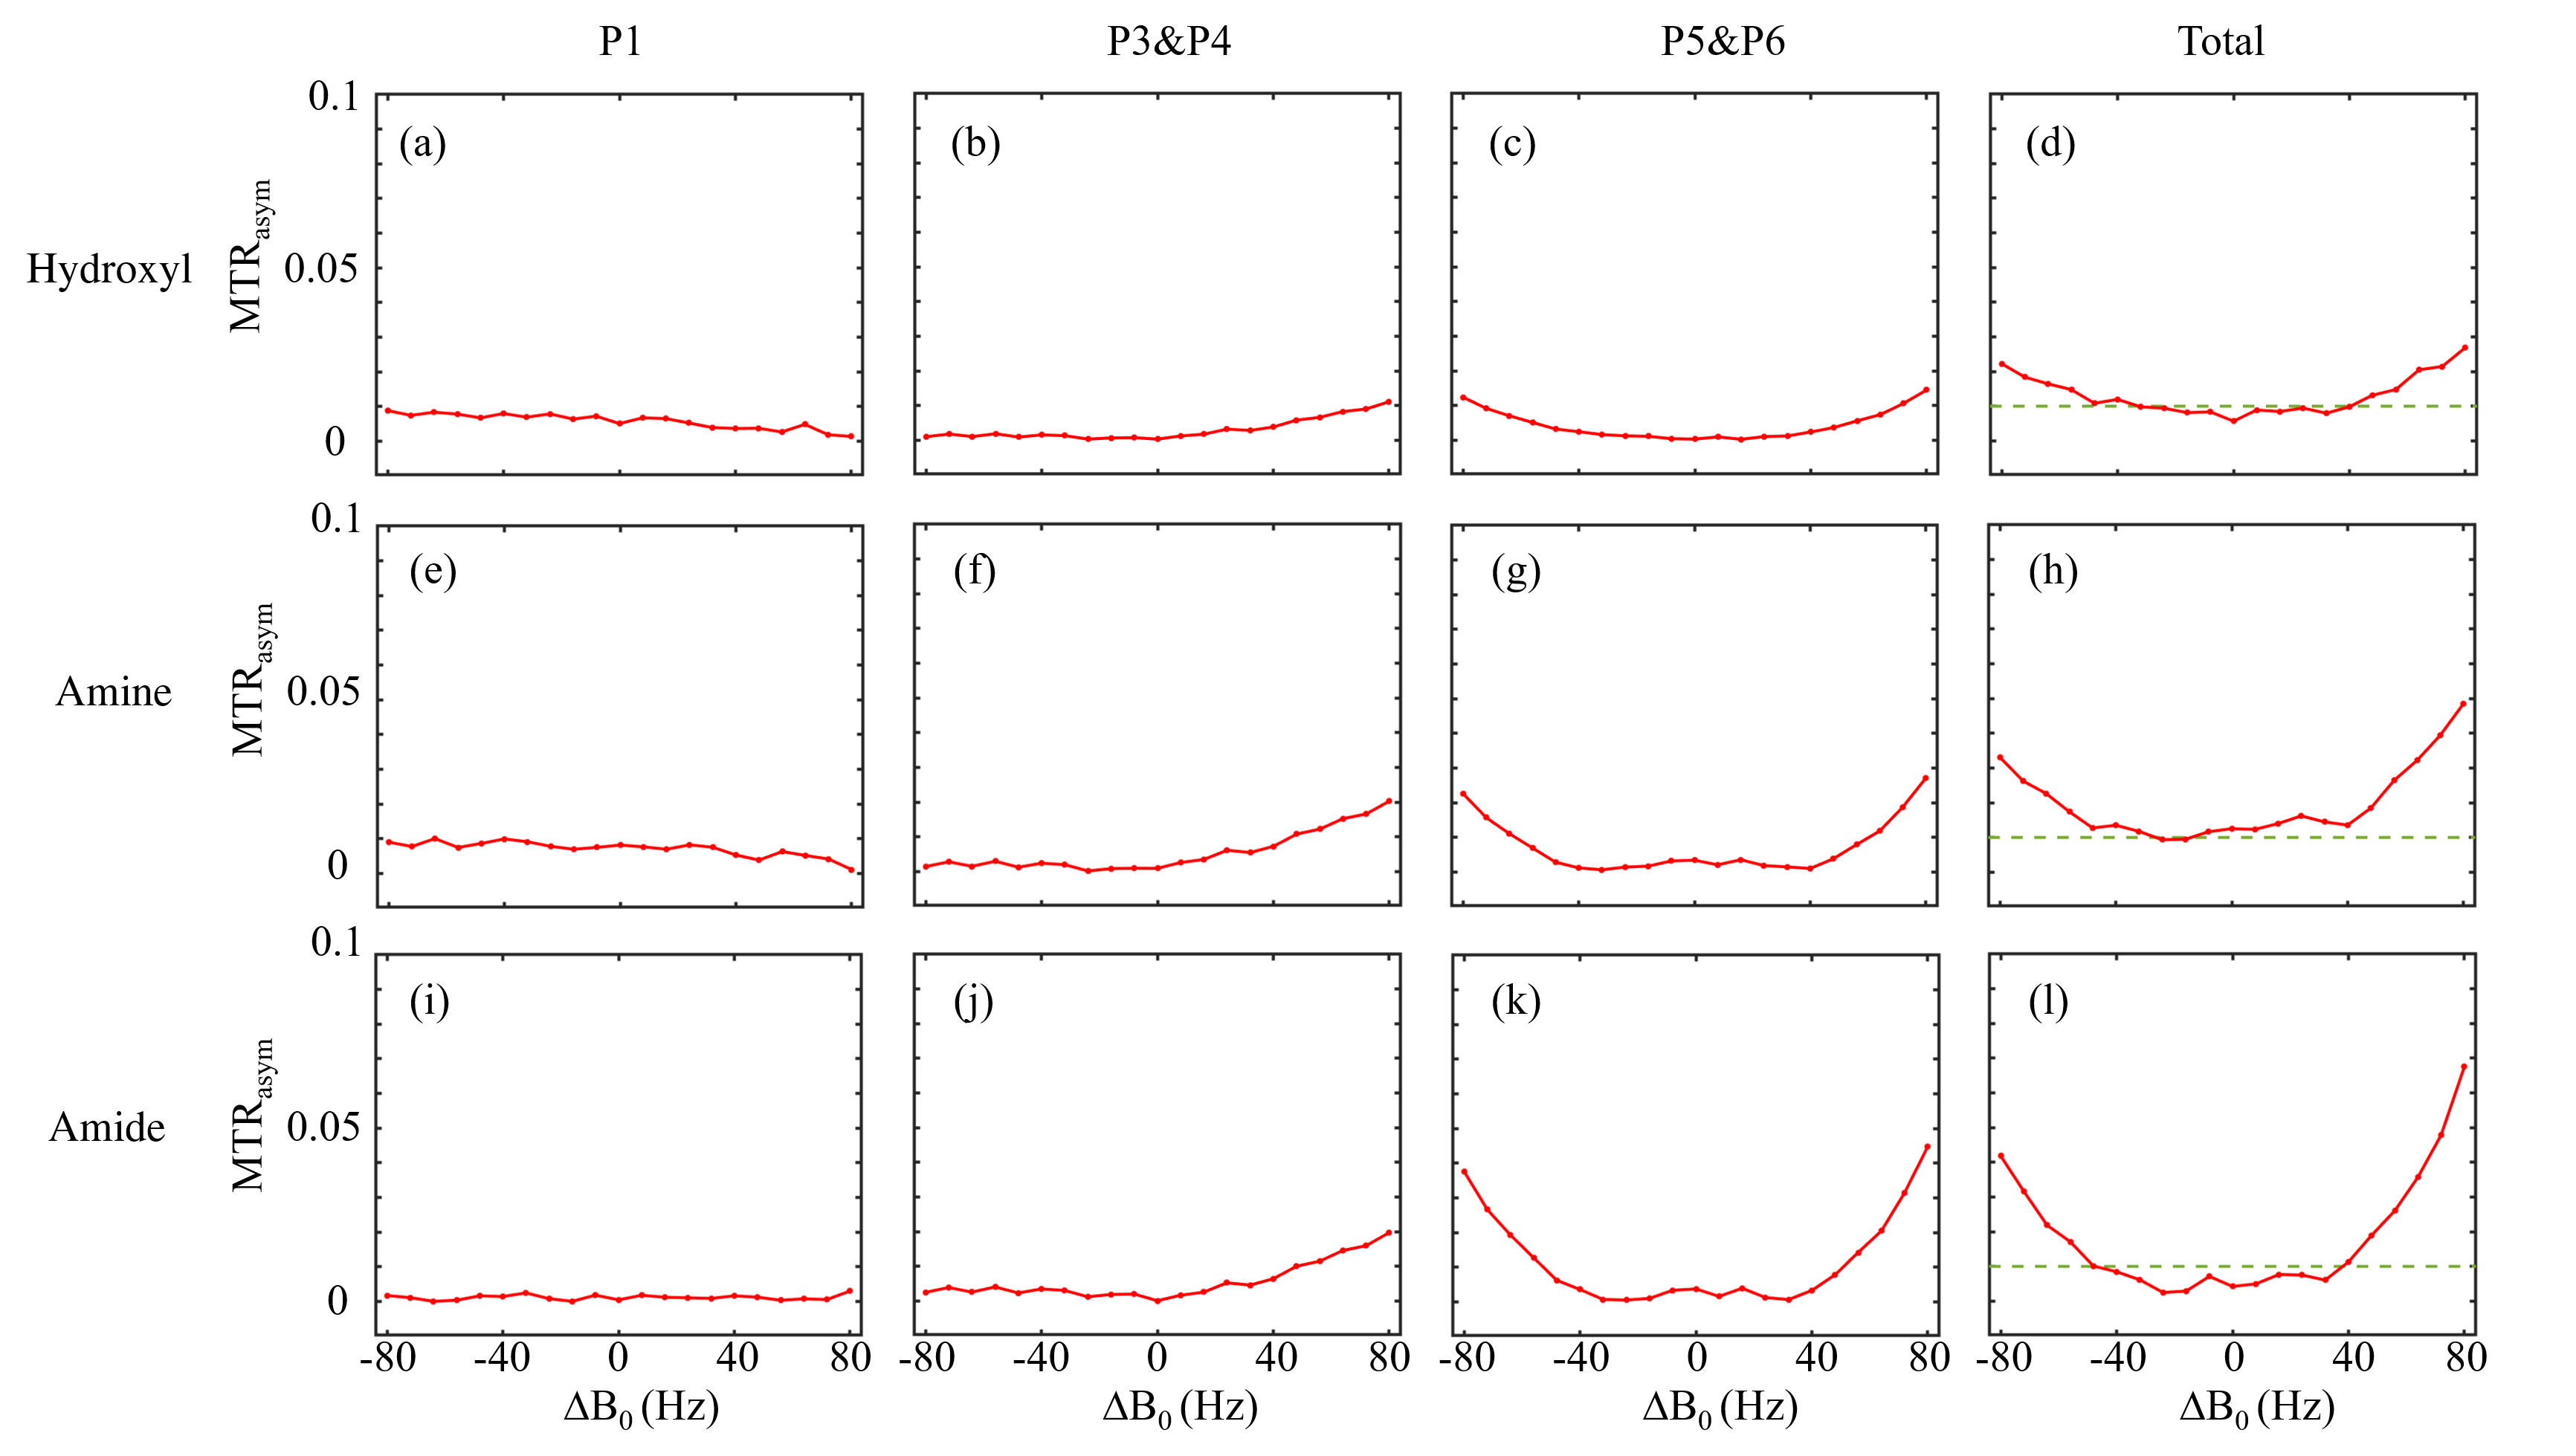
Figure 3 shows two types of 1H spectra of the in vivo experiment from the VOI in spinal cord with PDFF of 57 %. In the Figure 3a, a 1H spectrum from the conventional PRESS shows the raw spectral composition of the fat. Figure 3b displays the 1H spectrum from the reference acquisition of CEST-mPRESS with ∆B0 spanning from −100 to 100 Hz. Within a limited range (very roughly |∆B0| < 50 Hz), P3 to P6 are completely suppressed, while there is no obvious suppression on P1 and P2. Figure 4 shows how the residual lipid signals from adjacent fat peaks produce artifacts in the CEST signal, and how these artifacts change with ∆B0. For ∆B0 = 0 Hz, obvious lipid artifacts only appear at P1. But for ∆B0 = −100 and 100 Hz, Z-spectrum built on P3 and P4, P5 and P6 have significant contributions to lipid artifacts. Figure 5 shows the lipid artifacts on the CEST sites of hydroxyl, amine and amide with ∆B0 spanning from −100 to 100 Hz. Slight contamination was seen only when imaging amide sites with ∆B0 spanning from −50 to 50 Hz.
Discussion
As shown in Figure 2, WE provide an effective signal suppression in the chemical-shift range with a broad bandwidth. Various field inhomogeneity shifts the excitation profile differently, which results in various residual fat signals. The fat peaks from P3 to P6 can be suppressed simultaneously with ∆B0 spanning from −50 to 50 Hz. The residual signals can spread over a wide frequency range. As shown in Figure 4d-4f, lipid artifacts from P1 have impact not only on the hydroxyl located at 1 ppm but also on the amine located at 2 ppm. Therefore, it is no possible to keep the hydroxyl and amine from the lipid artifacts from P1 in the WE based CEST. Therefore, to remove lipid artifacts on an CEST site, all the fact peaks near this CEST site should be suppressed simultaneously. Figure 5 show there are no lipid artifacts on the amide with ∆B0 spanning from -50 to 50 Hz. It agrees with the fact that fat peaks from P3 to P6 are suppressed simultaneously with ∆B0 in this frequency range.Conclusion
In the WE-based CEST MRI, B0 inhomogeneity is the limiting factor for fat suppression. Generally, artifact-free imaging of amides is viable, but imaging of hydroxyl and amine is more challenging.Acknowledgements
No acknowledgement found.References
1. Dula AN, Arlinghaus LR, Dortch RD, et al. Amide proton transfer imaging of the breast at 3 T: establishing reproducibility and possible feasibility assessing chemotherapy response. Magn Reson Med. 2013;70(1):216-224.
2. Klomp DW, Dula AN, Arlinghaus LR, et al. Amide proton transfer imaging of the human breast at 7T: development and reproducibility. Nmr Biomed. 2013;26(10):1271-1277.
3. Dula A N, Dewey B E, Arlinghaus L R, et al. Optimization of 7-T Chemical Exchange Saturation Transfer Parameters for Validation of Glycosaminoglycan and Amide Proton Transfer of Fibroglandular Breast Tissue. Radiology. 2015;275(1):255-61
4. Deng M, Chen SZ, Yuan J, et al. Chemical Exchange Saturation Transfer (CEST) MR Technique for Liver Imaging at 3.0 Tesla: an Evaluation of Different Offset Number and an After-Meal and Over-Night-Fast Comparison. Mol Imaging Biol. 2016;18(2):274-282.
5. Lin HY, Raman SV, Chung YC, et al. Rapid phase-modulated water-excitation steady-state free precession for fat-suppressed cine cardiovascular MR. J Cardiovasc Magn Reson. 2008;10:1-13.
6. Bastiaansen JAM, Stuber M. Flexible water excitation for fat-free MRI at 3T using lipid insensitive binomial off-resonant RF excitation (LIBRE) pulses. Magn Reson Med. 2018;79:3007-3017.
7. Pineda N, Sharma P, Xu Q, et al. Measurement of hepatic lipid: high-speed T2-corrected multiecho acquisition at 1H MR spectroscopy—a rapid and accurate technique. Radiology. 2009;252:568-576.
Figures