3055
Rigid Motion Correction for High Resolution Brain PET/MR Imaging1Radiology, Stanford Univ., Stanford, CA, United States, 2Bioengineering, Stanford Univ., Stanford, CA, United States, 3Was with: Nuclear Medicine, IRCCS Ospedale San Raffaele, Milan, Italy, 4GE Healthcare, Waukesha, WI, United States, 5Neurology, Stanford Univ., Stanford, CA, United States, 6HobbitView, San Jose, CA, United States
Synopsis
In a brain PET/MR scan, the PET acquisition is done during the entire exam which typically lasts between 30-60 min. Most subjects, especially patients with a motion disorder or AD, exhibit some degree of motion which results in image blurring, quantitative errors due to mismatched attenuation correction, and mis-registered PET and MR images which limits the advantages of PET reconstruction using anatomical priors. In this study, we describe the benefits of an optical motion tracking technique, which has been recently introduced for PET/MR, to acquire high resolution isotropic PET/MR images.
Purpose
In a brain PET/MR scan, the PET acquisition is done during the entire exam, which typically lasts between 30-60 min in order to perform dynamic PET tracer analysis or simply to maximize the SNR to enable the lowest possible radiation exposure. While the subject's head is restrained in the head coil, most subjects, especially patients with a movement disorder or Alzheimer's disease, exhibit some degree of motion during the PET acquisition. This results in image blurring, quantitative errors due to mismatched attenuation correction, and mis-registered PET and MR images, which limit the advantages of PET reconstruction using anatomical priors. In this study, we show the benefits of an optical motion tracking technique, which has been recently integrated with SIGNA PET/MR (GE Healthcare, Waukesha, WI) for prototype analysis [1], to acquire high resolution isotropic PET/MR images.Methods
Twenty subjects were injected with 5 mCi of the tau PET ligand 18F-PI2620, which is used to visualize neurofibrillary tangles in the brain. The study was approved by Stanford's Institutional Review Board and all subjects provided written consent. Emission data was collected between 0 and 100 minutes post-injection with a break between 30 and 50 minutes post-injection. An MR-safe, external tracker consisting of a single optical camera attached directly to the head coil and a curved marker temporarily attached to the patient’s forehead [1] was used to record the motion data. A PET frame was reconstructed between 60-90 minutes after the injection with the following methods: TOF-OSEM (Time Of Flight - Ordered Subset Expectation Maximization) with 28 subsets, 4 iterations, and 1.17×1.17×2.78 mm3 spatial resolution, MR guided TOF-BSREM (Block Sequential Regularized Expectation Maximization) using 3D T2 FLAIR CUBE and 3D T1 IR-FSPGR MR images as priors with 1.17 mm isotropic spatial resolution, and MRgTOF-BSREM with real time motion correction (rtMoCo MRgTOF-BSREM) with 1.17 mm isotropic spatial resolution.Results
Figure 1 shows both translational and rotational motions measured by this system on two subjects. It shows a typical motion of 1-6 mm and 6-15 degree in these subjects over the course of the 30 min PET frame. Figures 2 and 3 show the comparison between TOF-OSEM, MRgTOF-BSREM and rtMoCo MRgTOF-BSREM PET reconstruction methods for these two subjects. As expected, the TOF-OSEM images are blurry due to the larger slice thickness (i.e. 2.78 mm). MRgTOF-BSREM shows improved spatial resolution compared to TOF-OSEM but the spatial resolution is even more visually apparent when the motion correction is applied (arrows on Figure 2 and 3). The red arrows of Figure 2 show the pituitary gland, which is reconstructed with the best spatial resolution by the rtMoCo MRgTOF-BSREM method (right).The fused PET/MR images of Figure 3, clearly show the mis-registration of PET and MR images due to motion (shown by green arrows near the skull) and because of this mis-registration, the MRgTOF-BSREM alone has not been able to fully extract a small structure such as the choroid plexus. Figure 4 shows the PET/MR fused images of a subject with mild cognitive impairment injected with 5 mCi of 18F-PI2620. The high uptake in amygdala and entorhinal region is marked by yellow circles and green arrows, respectively. The 1.17 mm isotropic high-resolution reconstructions which are obtained by using MR priors (right and middle), show ~14% higher uptake in these regions compared to the regular TOF-OSEM reconstruction with 2.78 mm slice thickness (left). The mis-registration between MR and PET images is resolved by motion correction (right) and it shows a better delineated uptake.Conclusion
Applying a fully integrated motion correction system to PET and MR data acquired in the same exam can both remove motion artifacts and prevent mis-registration between PET and MR images. Co-registration of PET and MR images is particularly important for using anatomical priors in PET image reconstruction and avoiding quantitative errors due to mismatched attenuation correction.Acknowledgements
GE Healthcare and Life Molecular Imaging.References
[1] Spangler-Bickell M. et al., "Rigid Motion Correction for Brain PET/MR Imaging using Optical Tracking", IEEE Transactions on Radiation and Plasma Medical Sciences, Oct 2018.
Figures
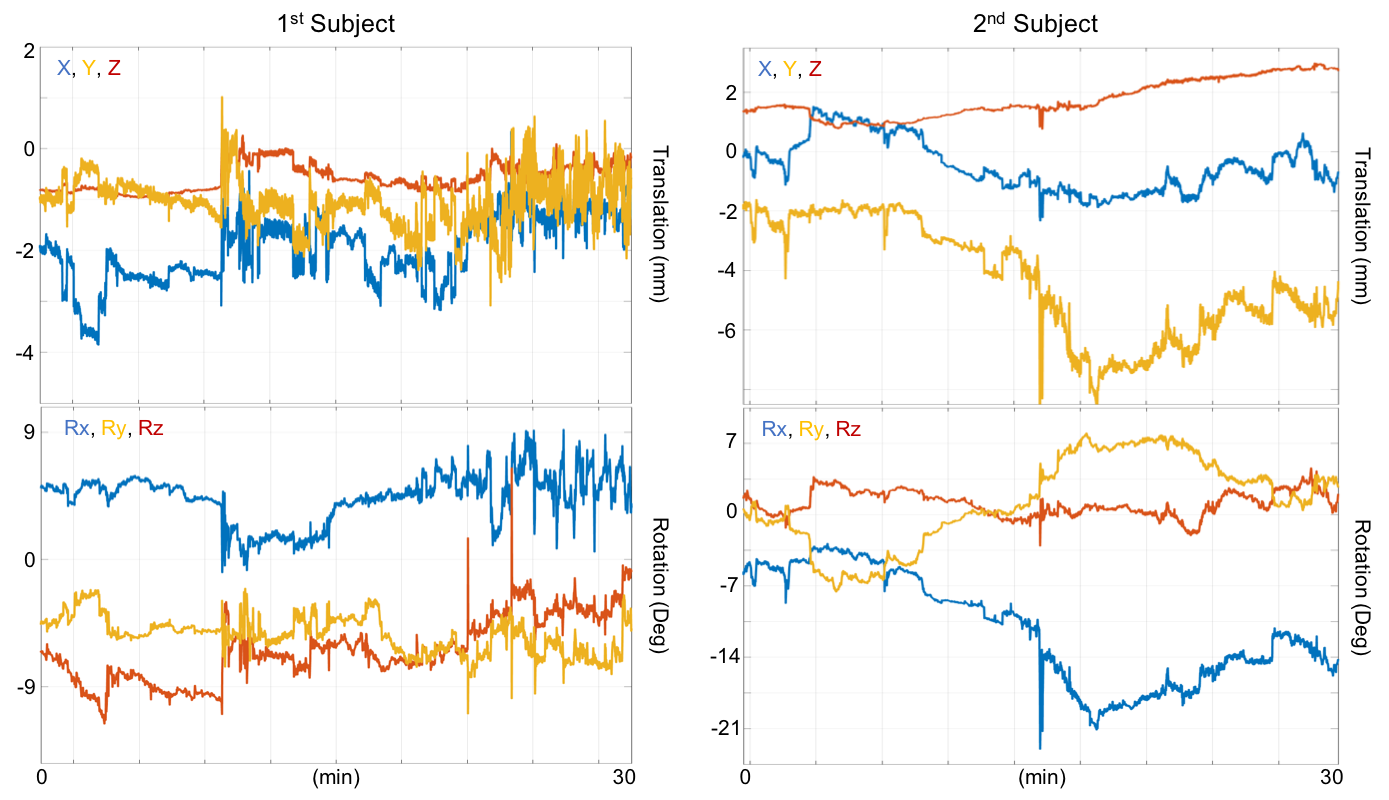
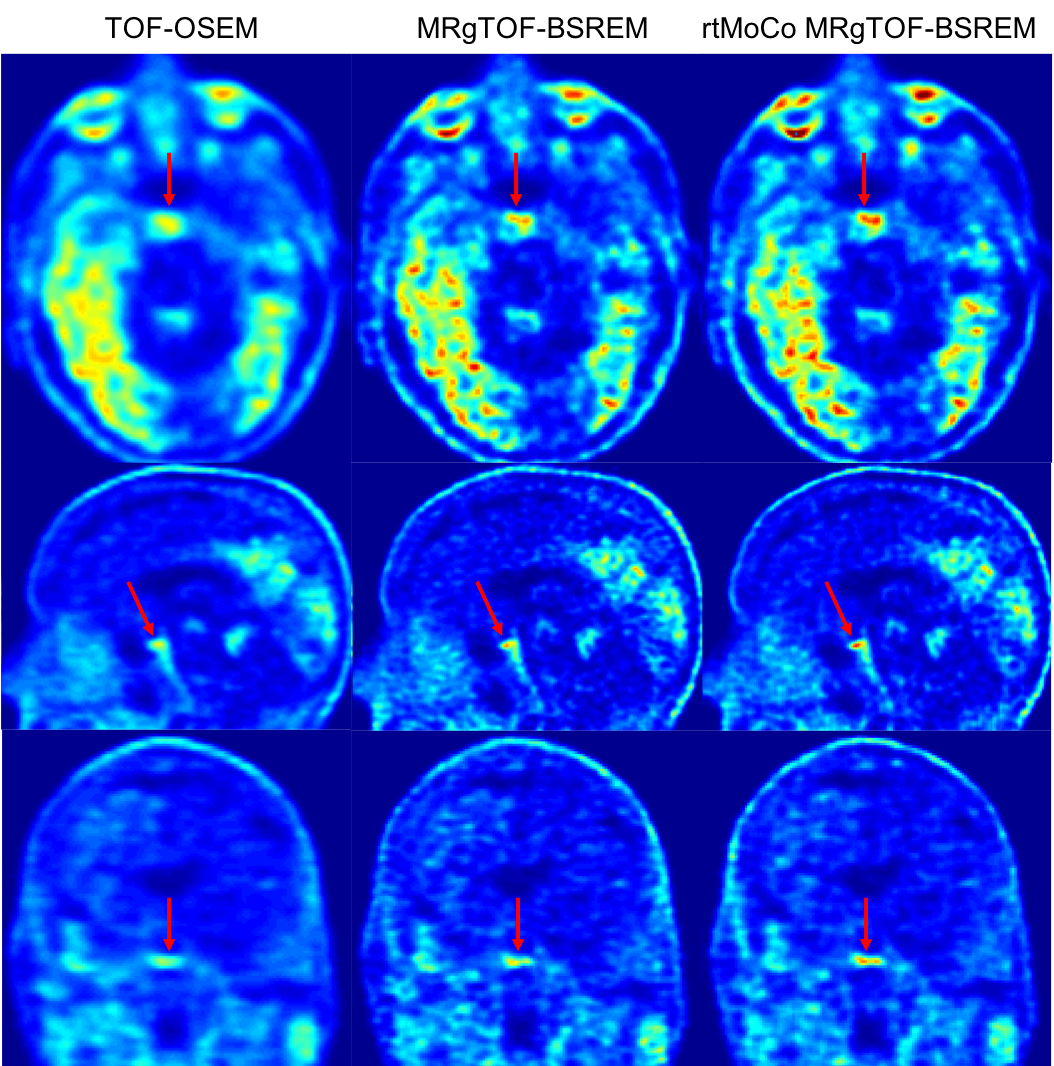
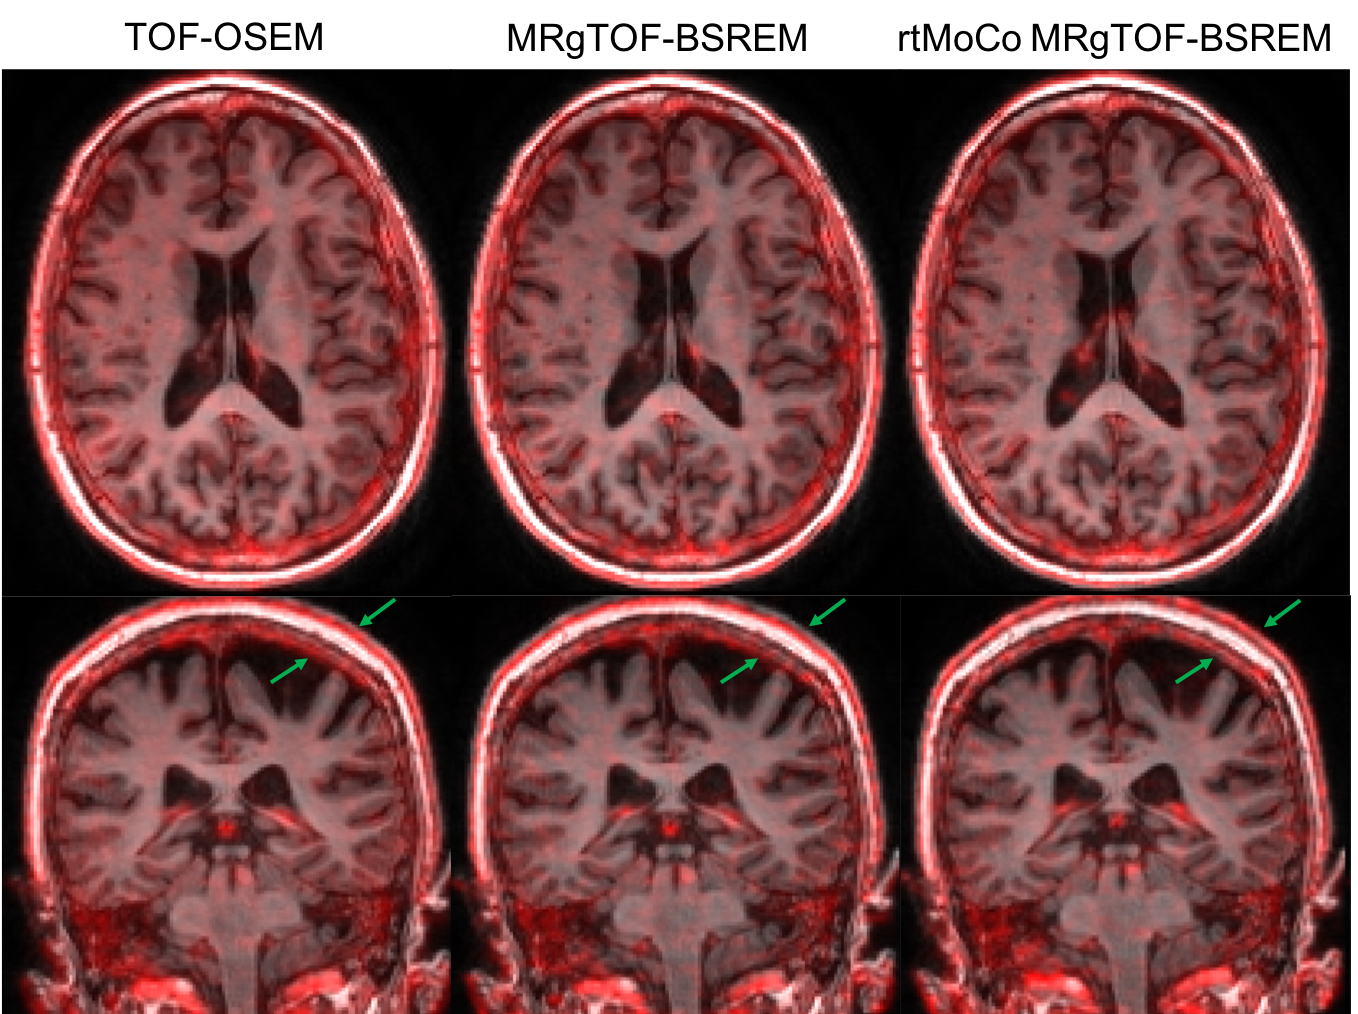
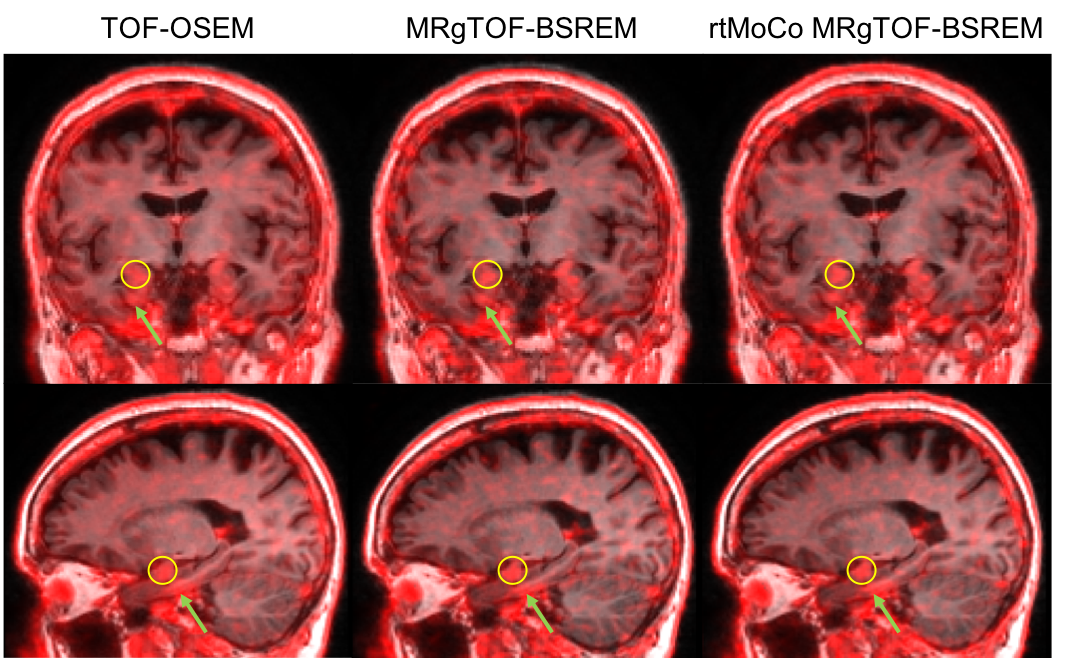
Figure 4: PET/MR fused images of a subject with mild cognitive impairment, with 18F-PI2620 uptake in amygdala (yellow circles) and entorhinal region (green arrows). The 1.17 mm isotropic high-resolution reconstructions (right and middle) show ~14% higher uptake compared to the regular TOF-OSEM reconstruction with 2.78 mm slice thickness (left). Also motion correction (right) has removed the mis-registration between MR and PET images and shows a better delineated uptake.