3053
The Best Combination of Genes for Genetic Reporter of Cellular Level MR Imaging1Department of Radiological Sciences, Human Health Sciences, Tokyo Metropolitan University Graduate School, Tokyo, Japan, 2Laboratory for Marmoset Neural Architecture, Center for Brain Science, RIKEN, Saitama, Japan, 3Division of Regenerative Medicine, The Jikei University School of Medicine, Tokyo, Japan, 4Department of Physiology, Keio University School of Medicine, Tokyo, Japan
Synopsis
We examined which gene we should transduce for genetic reporter for Magnetic Resonance Imaging (MRI) by comparing T1 or T2 values of the cells followed by exposure to MnCl2 or Holo-transferrin. We identified the cell which has the shortest T1 or T2 values and it indicates that they can be useful genetic reporter for T1 Weighted Imaging (T1WI) or T2 Weighted Imaging (T2WI).
Introduction
Currently, we can label cells by transducing some specific genes. These are called genetic reporters. For example, green fluorescence protein (GFP) is commonly used for labeling cells by fluorescent proteins. We can also observe reporter signals of the luciferin-luciferase system from outside of the living animals with IVIS. However, its resolution is not high. Therefore, in this study, we examined a new genetic reporter, which allows observation of the labeled cells in living animals with MRI. Therefore, we transduced a group of DNAs that can draw and maintain metal ions to cells, added metal ions, and measured their T1 or T2 values.Methods
This study was conducted in cultured 293T cells (Fig. 1), which is derived from human fetus kidney. 293T cells were cultured in 6-well plates and the number of cells was 6×10⁵ when they were seeded to 6-well plates. The plasmids were CAG-FLAG-transferrin receptor, CAG-FLAG-DMT1, CAG-FLAG-Ferritin, CAG-FLAG-FerritinM6A, CAG-FLAG-Mms6, and CAG-Venus. We transduced some combinations of these plasmids to 293T cells. The method of transfection was lipofection with a Lipofectamine 3000®︎ Transfection Kit. One day after transfection, we exposed 293T cells to MnCl2 or Holo-transferrin. One hour (MnCl2) or 3 hours (Holo-transferrin) later 1,2, we collected the cells and put them in PCR tubes with 20 ul phosphate-buffered saline (PBS; Fig. 2). Then we measured T1 or T2 values with a 9.4 T MRI scanner (BioSpec 94/30; Bruker Biospin, Ettlingen, Germany). A MRI scan was performed with the following parameters: T1 measurement: rapid acquisition with relaxation enhancement (RARE); repetition time (TR), 500 - 20247 ms (12 steps); echo time (ET), 9.8 ms; resolution, 0.1×0.1×1.0 mm; T2 measurement, multi-slice multi-echo (MSME); repetition time (TR), 6000 ms; ET, 10 – 1500 ms (150 steps); and resolution, 0.1×0.1×1.0 mm.Results
When we exposed cells to Holo-transferrin, FerritinM6A shortened T2 values the most, compared to exposure to Ferritin, FerritinM6A, and Mms6 (Fig. 3-b), which have the ability to maintain Fe ions 2-5. The T2 value of FerritinM6A was smaller than transferrin receptor (TfR) + DMT1 + FerritinM6A (Fig. 3-c). The T2 value of FerritinM6A only was -36% in comparison to controls (GFP; Fig. 3-d).When we exposed cells to MnCl2, FerritinM6A shortened T1 values the most among Ferritin, FerritinM6A, and Mms6 as well as Holo-transferrin (Fig. 4-b). Then the T1 value of TfR + DMT1 + FerritinM6A was the smallest among some combinations of TfR, DMT1, and FerritinM6A (Fig. 4-c). The T1 value of TfR + DMT1 + FerritinM6A was -13% in comparison to controls (Fig. 4-d).
Discussion
The result that the T2 value of FerritinM6A was shorter than that of Ferritin agrees with a previous study 2. On the other hand, the previous study also suggested that the T2 value of FerritinM6A was three quarters of Ferritin 2. In our study, the difference between TfR + DMT1 + FerritinM6A and TfR + DMT1 + Ferritin was not very large. Here, transferrin receptor and DMT1 are reported as proteins involved in taking Fe ions 6-8. In contrast, the T2 value of TfR + DMT1 + FerritinM6A was higher than FerritinM6A, which might obstruct T2 shortening by FerritinM6A (Fig 1-c). This is the likely reason why the T2 value of FerritinM6A was not different from that of Ferritin. Finally, FerritinM6A only had the smallest T2 value. Therefore, it was shown that FerritinM6A only is the best genetic reporter for MRI imaging in T2WI.Next, when we exposed cells to MnCl2, the result that FerritinM6A shortened T1 values the best among Ferritin, FerritinM6A and Mms6 was the same as for Holo-transferrin (Fig 2-b). Then the combination of transferrin receptor and DMT1 was better than FerritinM6A only (Fig 2-c). In a previous study, it was reported that DMT1 has the ability of shortening T1values 9. Our result was in agreement. In addition, the differences in their T1 values seemed large. However, we cannot say that FerritinM6A did not play a role in T1 shortening because the T1 value of the combination of three genes (transferrin receptor + DMT1 + FerritinM6A) was the smallest. Therefore, we can say that their combination is the best genetic reporter for MRI imaging in T1WI.
However, some limitations should be noted. 293T cells are from human fetus kidneys and we transduced DNA from them. Therefore, when we transduce the DNA to cells in living animals, such as mice, it is unknown whether we can get the same T1 or T2 shortening effect. It is true that the combination of genes we found in this study is the best, but there is still no confirmation that it can make a very strong contrast.
Conclusion
We showed that FerritinM6A is the best genetic reporter for T2WI and that the combination of transferrin receptor, DMT1, and FerritinM6A is the best for T1WI.In the future, we will transduce the DNAs that we specified in this study to analyze mice and T1WI or T2WI.
Acknowledgements
This research is partially supported by the program for Brain Mapping by Integrated Neurotechnologies for Disease Studies (Brain/MINDS) from Japan Agency for Medical Research and development, AMED.
Conflict of Interest (COI) of the Principal Presenter:No potential COI to disclose.
References
1. Lewis CM, Graves SA, Hernandez R, et al. 52Mn Production for PET/MRI Tracking Of Human Stem Cells Expressing Divalent Metal Transporter 1 (DMT1). Theranostics. 2015;5(3): 227-239.
2. Radoul M, Lewin L, Cohen B, et al. Genetic manipulation of iron biomineralization enhances MR relaxivity in a ferritin-M6A chimeric complex. Sci Rep. 2016;6:26550
3. Rouault TA. Iron metabolism in the CNS: implications for neurodegenerative diseases. Nat Rev Neurosci. 2013;14:551-564.
4. Lohsse A, Borg S, Raschdorf O, et al. Genetic dissection of the mamAB and mms6 operons reveals a gene set essential for magnetosome biogenesis in Magnetospirillum gryphiswaldense. J Bacteriol. 2014;196(14):2658-2669.
5. Elfick A, Rischitor G, Mouras R, et al. Biosynthesis of magnetic nanoparticles by human mesenchymal stem cells following transfection with the magnetotactic bacterial gene mms6. Sci Rep. 2017;7:39755
6. Li Y, Jiao Q, Xu H, et al. Biometal Dyshomeostasis and Toxic Metal Accumulations in the Development of Alzheimer’s Disease. Front Mol Neurosci. 2017;10:339
7. Moos T, Morgan EH, et al. Transferrin and transferrin receptor function in brain barrier systems. Cell Mol Neurobiol. 2000;20(1):77-95.
8. Wolff NA, Garrick MD, Zhao L, et al. A role for divalent metal transporter (DMT1) in mitochondrial uptake of iron and manganese. Sci Rep. 2018;8(1):211.
9. Bartelle BB, Szulc KU, Suero-Abreu GA, et al. Divalent Metal Transporter, DMT1: A Novel MRI Reporter Protein. Magn Reson Med. 2013;70(3):842–850.
Figures
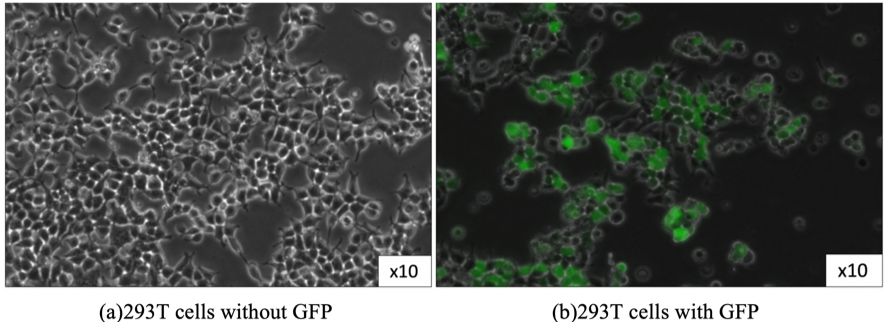
Fig. 1 Microscope photos of 293T cells
293T cell is derived from human fetus’ kidney (a). If we transduce GFP to cells, they glow green under blue light (b). By transducing GFP with another DNA, we can check whether we succeeded transfection or not.
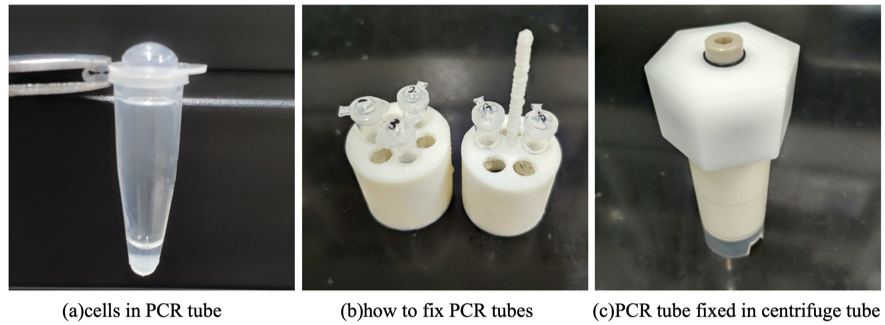
Fig. 2 Collected cells and how to fix tubes
After exposing cells to MnCl2 or Holo-transferrin, we collected cells in culture to the PCR tube with 20 ul PBS (a). PCR tubes were fixed to the dedicated holder (b), and the holder was fixed to the 25 ml centrifuge tube (c).
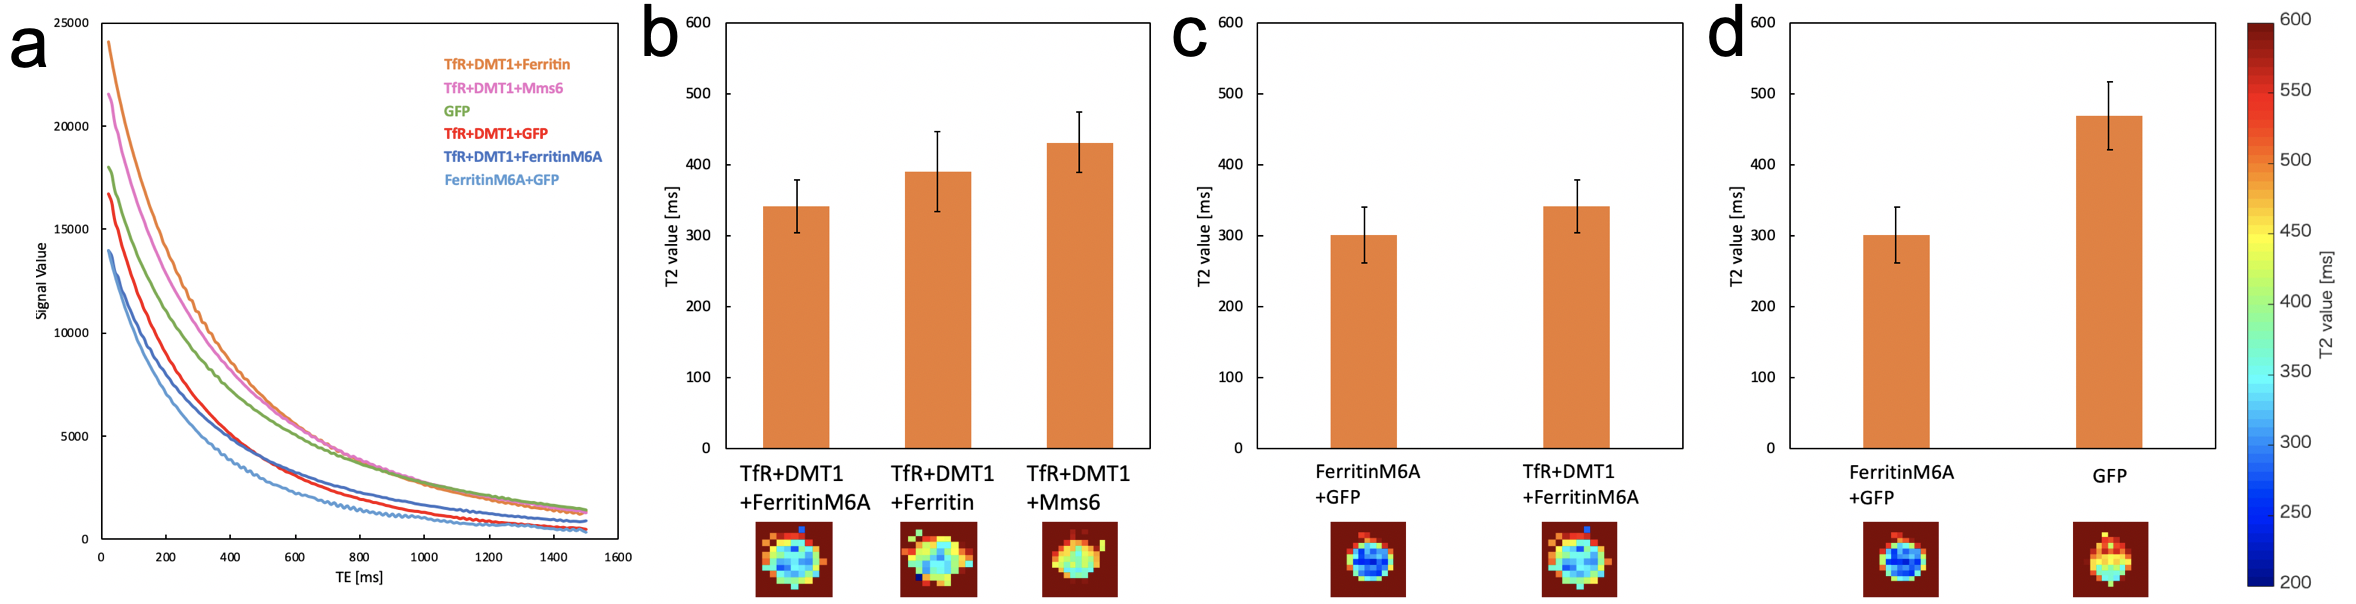
Fig. 3 T2 relaxation curve and T2 values of the cells exposed to Holo-transferrin
We scanned MRI images with different TE (TE = 10 ms – 1500 ms; 150 steps) and got T2 relaxation curves (a). By approximating the curves, we calculated T2 values (b-d). The cells which were transduced FerritinM6A and GFP had the smallest T2 value.
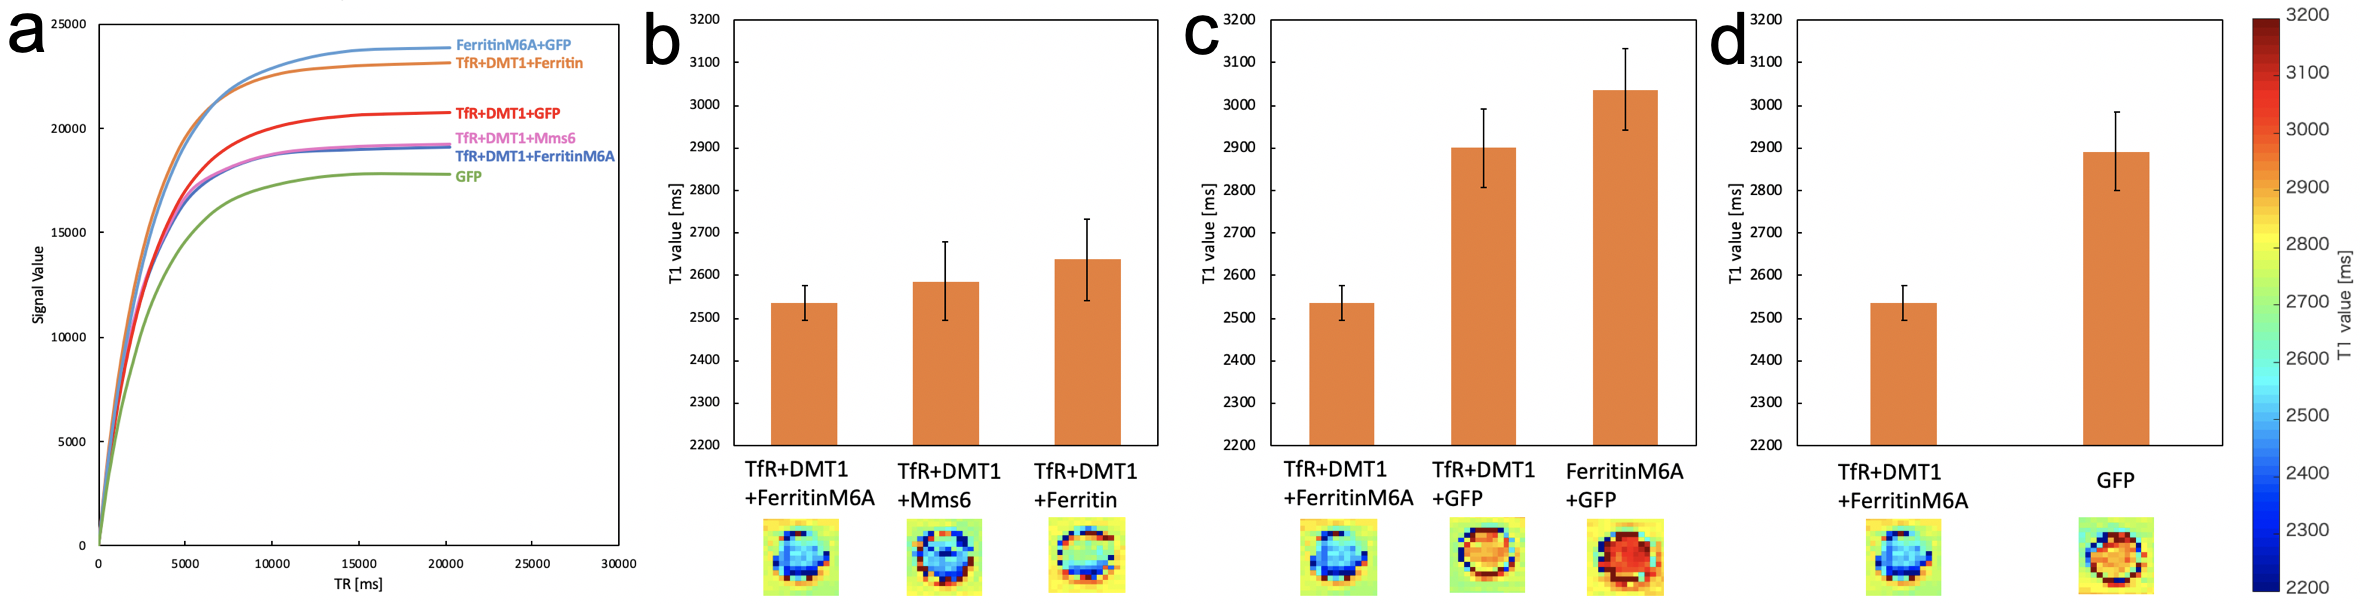
Fig. 4 T1 relaxation curve and T1 values of the cells exposed to MnCl2
We scanned MRI images with different TR (500 ms – 20247 ms; 12 steps) and got T1 relaxation curves (a). By approximating the curves, we calculated T1 values (b-d). The cells which were transduced Transferrin Receptor, DMT1 and FerritinM6A had the smallest T1 value.