3051
In Vivo T2* Mapping of Hyperpolarized 13C-Labeled Metabolites Using a Metabolite-Selective Multi-Echo Spiral Imaging Sequence1Advanced Imaging Research Center, UT Southwestern Medical Center, Dallas, TX, United States, 2Radiology, UT Southwestern Medical Center, Dallas, TX, United States, 3Electrical Engineering, UT Dallas, Richardson, TX, United States
Synopsis
Multi-echo 13C spiral imaging sequence combined with a spectral-spatial radiofrequency pulse is implemented for sequential imaging of hyperpolarized [13C]bicarbonate, [1-13C]lactate and [1-13C]pyruvate. From the multi-echo 13C images of each metabolite in vivo T2* maps are generated. The pulse sequence was tested with a 13C-phantom and applied to measure T2*s of hyperpolarized [1-13C]pyruvate and the products in rat heart in vivo.
Background
While the longitudinal relaxation (T1) of hyperpolarized molecule determines the decay rate of net magnetization available for RF excitation, T2* describes the effective transverse relaxation time after the nuclei is RF-excited to the transverse plane. Although the T2s of 13C-labeled pyruvate and the products are reportedly long1–3, the T2* is the practically dominating relaxation mechanism in most gradient echo type of pulse sequences. In vivo T2*s of hyperpolarized 13C-labeled metabolites are largely unexplored despite its critical role in designing the optimum k-space readout trajectories and maximizing the image contrast and signal to noise ratios (SNRs). In this study, we designed a spectral-spatial radiofrequency (spsp RF) pulse that can selectively excite [13C]bicarbonate, [1-13C]lactate, and [1-13C]pyruvate, and implemented a metabolite-selective multi-echo spiral imaging sequence with the spsp RF pulse. Multi-echo images of each metabolite are acquired in an interleaved fashion, and the in vivo T2* maps are generated from the multi-echo images.Methods
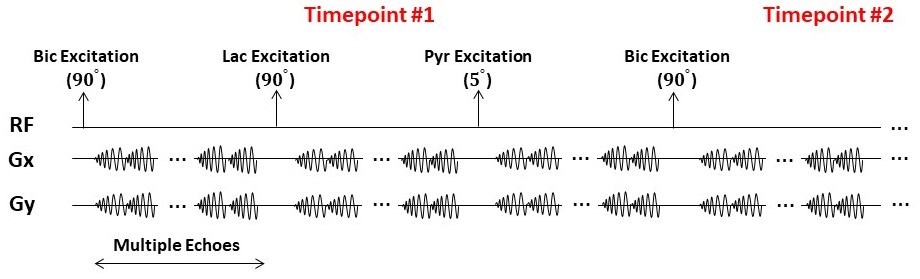
A spsp RF pulse was designed to sequentially excite hyperpolarized [13C]bicarbonate, [1-13C]lactate and [1-13C]pyruvate, and multi-echo spiral 13C imaging sequence was implemented to acquire the corresponding metabolite’s images, respectively, in an interleaved fashion by shifting the transmit and receiver frequencies4 (Fig. 1). The spsp RF pulse and multi-echo spiral imaging readout trajectories were implemented in the MNS Research Package (GE Healthcare). All the data were acquired at a GE 3T 750w wide-bore scanner. To test the performance of the proposed sequence, a Gd-doped spherical [13C]bicarbonate phantom (1.0 M, ∅ = 3 cm) was used with a 13C/1H dual-tuned birdcage transmit/receive RF coil (GE Healthcare). Five echoes were acquired following a spsp RF excitation with 2-shot spiral readouts for imaging the phantom (FOV = 60 × 60 mm2, spatial resolution = 3 × 3 mm2, slice thickness = 20 mm, TR = 3 s, spectral bandwidth = 85.06 Hz, 96 averages). For in vivo study, a healthy Wistar rat was imaged with the RF coil. A 35-μL sample of 14-M [1-13C]pyruvic acid mixed with OX063 trityl (15mM) was prepared and polarized using a SPINlab™ DNP polarizer (GE Healthcare). The hyperpolarized samples were dissolved with hot solvent, mixed with pH-neutralization media, and immediately injected as a bolus intravenously (~70 mM pyruvate, ~7.5 of pH). Up to 10 echoes of [13C]bicarbonate, [1-13C]lactate and [1-13C]pyruvate were acquired from the imaging slice that contains rat heart using the metabolite-selective multi-echo spiral sequence every 5 seconds (FOV = 80 × 80 mm2, spatial resolution = 8 × 8 mm2, slice thickness = 25 mm, TE/TR = 15.19 ms/213 ms, 10 echoes, spectral bandwidth = 167.34 Hz, flip angles = 90° for bicarbonate, 90° for lactate, and 5° for pyruvate, 16 dynamic scans, 15s delay, Fig. 3). T2*s of hyperpolarized [13C]bicarbonate, [1-13C]lactate and [1-13C]pyruvate were calculated by fitting the decay rate of the multi-echo images along the echo times as mono-exponential functions using MATLAB.Results and Discussion
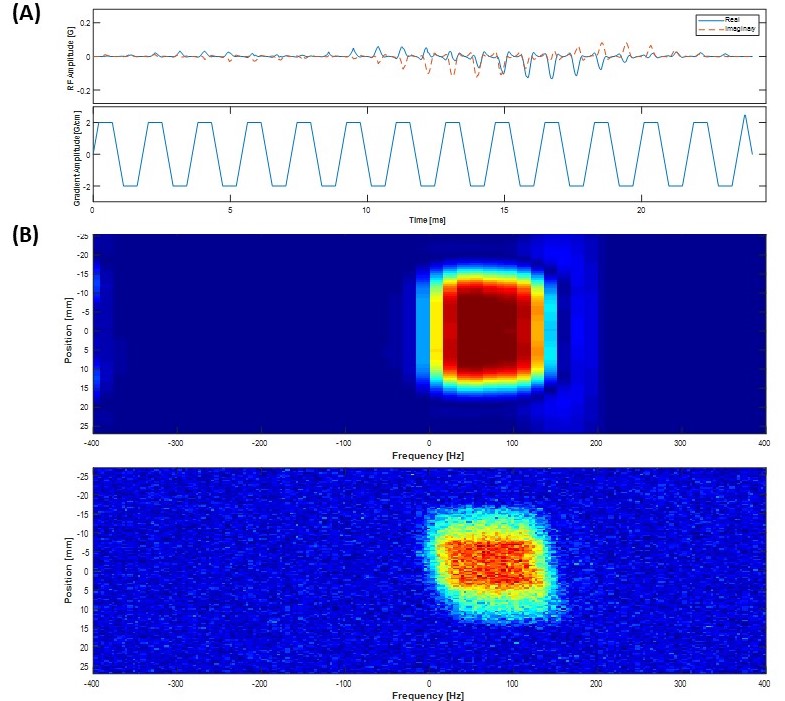
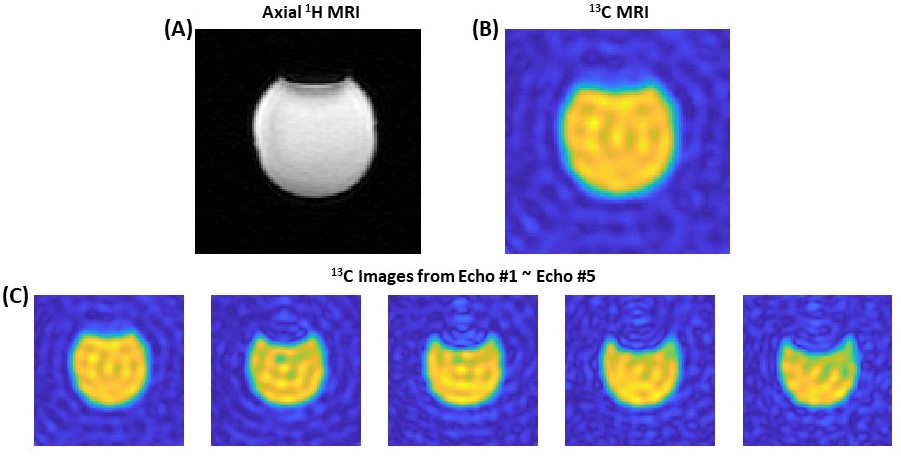
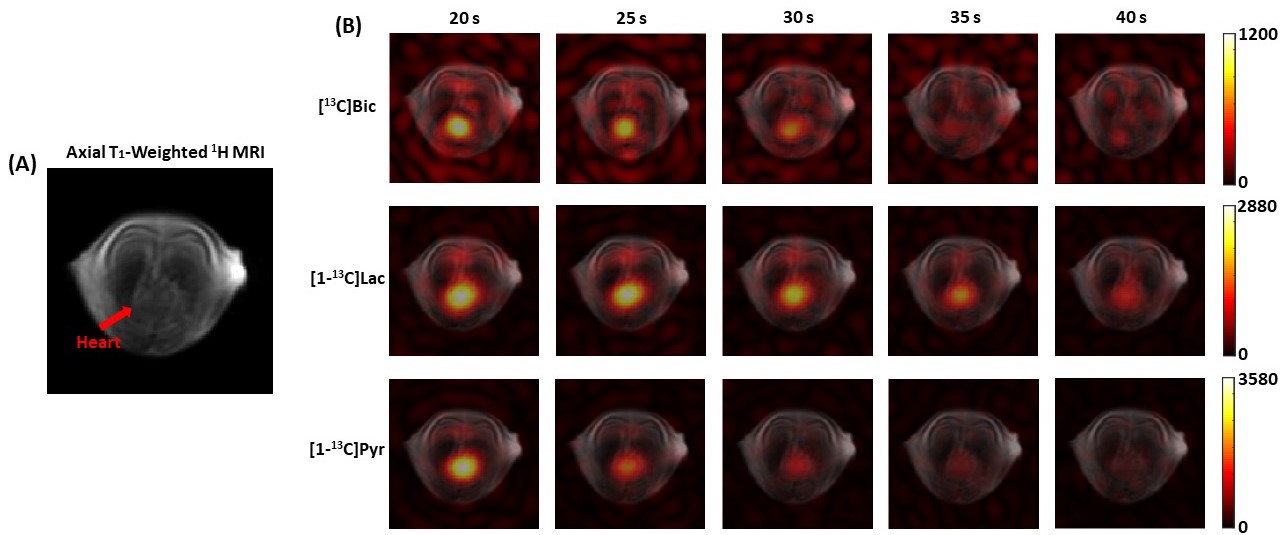
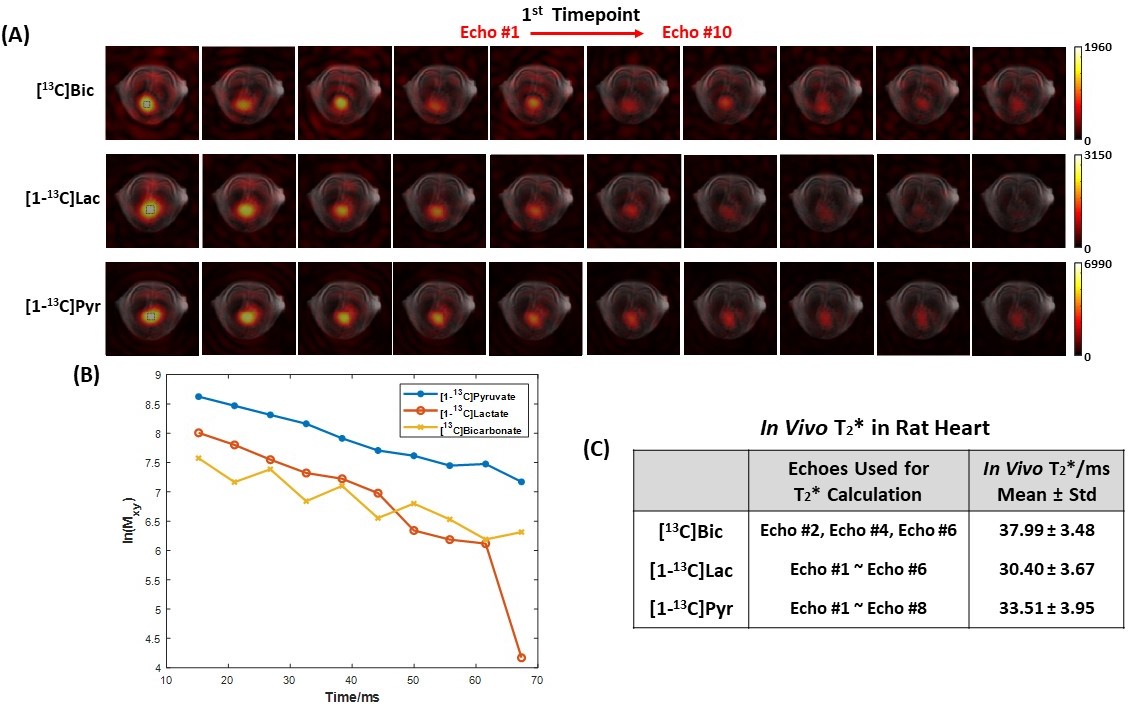
Fig. 1A shows the designed spsp RF pulse and the corresponding slice-selective gradient waveform. The spectral-spatial excitation profile was confirmed by an RF simulation and phantom tests at the scanner (Fig. 1B). The performance of the proposed sequence was validated by phantom study (Fig. 2). Fig. 2A shows the 1H MRI of the [13C]bicarbonate phantom. Using the spsp multi-echo spiral sequence, the 13C image (Fig. 2B) and images from each echo (Fig. 2C) were acquired. Fig. 3 elucidates the overall acquisition scheme of the implemented pulse sequence for in vivo study, and Fig. 4 shows the axial 1H MRI of rat heart (Fig. 4A) and the dynamic images of hyperpolarized [13C]bicarbonate, [1-13C]lactate and [1-13C]pyruvate from 20 s to 40 s after the start of injection (Fig. 4B). The images from separate echoes of each metabolite in the first time point are shown in Fig. 5A, and Fig. 5B shows the signal change of different metabolite in log scale from pixels in the region of interest (black rectangles in Fig. 5A). In vivo T2* for different metabolites are estimated as 37.99 ± 3.84 ms for bicarbonate, 30.40 ± 3.67 ms for lactate, and 33.51 ± 3.95 ms for pyruvate. T2*s of pyruvate and lactate were shorter than that of bicarbonate probably because of the flow effect. The results are summarized in Fig. 5C. It was noted that the decay of hyperpolarized [13C]bicarbonate signal is fluctuant in an interleaved manner, which is possibly due to the movement of heart and the contamination from other metabolites (e.g., hyperpolarized [1-13C]pyruvate). Therefore, for the T2* calculation of hyperpolarized [1-13C]bicarbonate, we chose the images from echo #2, echo #4 and echo #6 since they are less contaminated compared to those from other echoes.Conclusion
In summary, we implemented a spectrally selective multi-echo 13C spiral imaging sequence for in vivo T2* mapping of hyperpolarized 13C-labeled metabolites. The sequence was validated with phantom and tested with a rat heart in vivo following a bolus injection of hyperpolarized [1-13C]pyruvate. In vivo T2*s of [13C]bicarbonate, [1-13C]lactate and [1-13C]pyruvate could be measured robustly from the multi-echo data. The pulse sequence is applicable to other organs, and we plan to measure in vivo T2*s of the hyperpolarized metabolites in human using the proposed method.Acknowledgements
Funding: The Texas Institute of Brain Injury and Repair; The Mobility Foundation; National Institutes of Health of the United States (P41 EB015908, S10 OD018468); The Welch Foundation (I-2009-20190330); UT Dallas Collaborative Biomedical Research Award.References
1. Joe, E. et al. An indirect method for in vivo T2 mapping of 1-13C pyruvate using hyperpolarized 13C CSI. NMR in biomedicine 30; 10.1002/nbm.3690 (2017).
2. Yen, Y.-F. et al. T2 relaxation times of 13C metabolites in a rat hepatocellular carcinoma model measured in vivo using 13C-MRS of hyperpolarized [1-13C]pyruvate. NMR in biomedicine 23, 414–423; 10.1002/nbm.1481 (2010).
3. Yen YF, Le Roux P, Bok R, et al. Apparent T2 of 13C-labeled metabolites in vivo. Proceedings of the 16th Annual Meeting of ISMRM, Toronto, Canada. (2008: #1747).
4. Larson, P. E. Z. et al. Multiband excitation pulses for hyperpolarized 13C dynamic chemical-shift imaging. Journal of magnetic resonance (San Diego, Calif. : 1997) 194, 121–127; 10.1016/j.jmr.2008.06.010 (2008).
Figures