3050
A PET/MRI contrast agent for measuring tumor extracellular pH1Chemistry, Rice University, Houston, TX, United States, 2Cancer Systems Imaging, MD Anderson Cancer Center, Houston, TX, United States
Synopsis
Extracellular pH (pHe) in the tumor microenvironment is a biomarker that is used to assess tumor acidosis, which is caused by upregulated aerobic glycolysis in cancer cells. A PET/MRI contrast agent has developed consisting of a pH-responsive MRI co-agent, and a PET co-agent with matching pharmacokinetics to report on the concentration of the MRI co-agent. Using our simultaneous PET/MRI methodology, the pHe of a MIA PaCa-2 pancreatic tumor mouse model was found to be 6.76. These in vivo pH measurements can be used to detect a response to therapy or identify tumor vs. non-tumor tissue.
Introduction
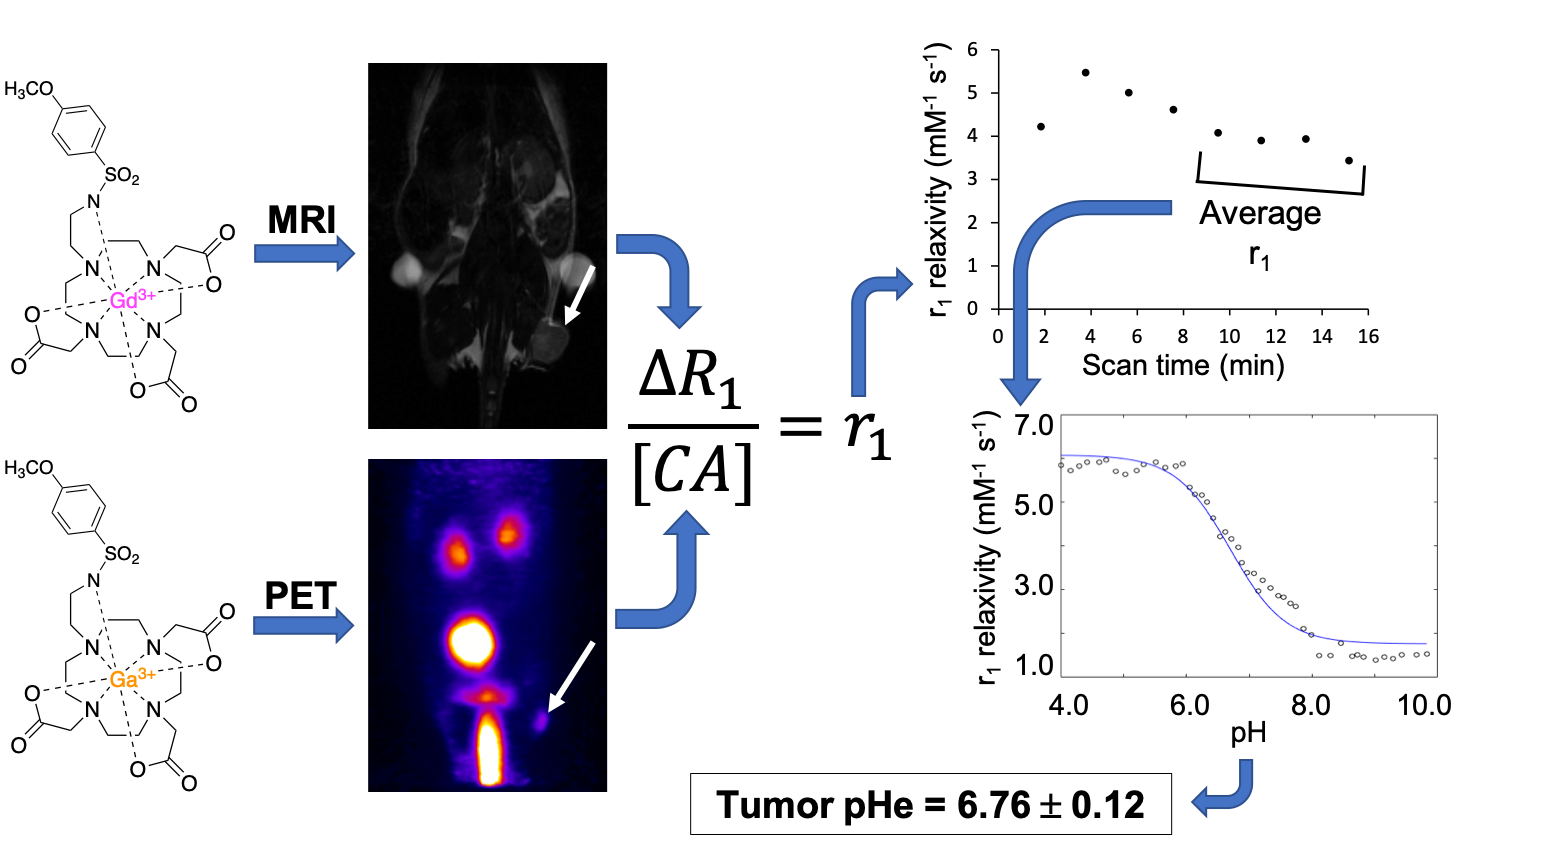
Extracellular pH (pHe) in the tumor microenvironment is a biomarker used to assess tumor acidosis, which is caused by upregulated aerobic glycolysis in cancer cells.1 Many responsive magnetic resonance imaging (MRI) contrast agents have been developed to measure tumor pHe, where changes in the relaxation-based MRI contrast are sensitive to tumor pHe.2 However, these agents are not able to measure pHe in vivo because MRI contrast is also dependent on the concentration of the agent in tissues. To address this problem, we have designed and synthesized a PET (positron emission tomography)/MRI contrast agent that consists of a pH-responsive MRI component and a radiolabeled PET component to measure concentration. Therefore, the PET results can account for the effect of concentration on MRI contrast, which can improve the quantitative measurement of tumor pHe. These co-agents have been designed to have the same pharmacokinetic delivery to the extracellular tumor microenvironment and were co-injected intravenously into a MIA PaCa-2 pancreatic cancer mouse model and imaged simultaneously using a small animal PET/MRI instrument.Methods
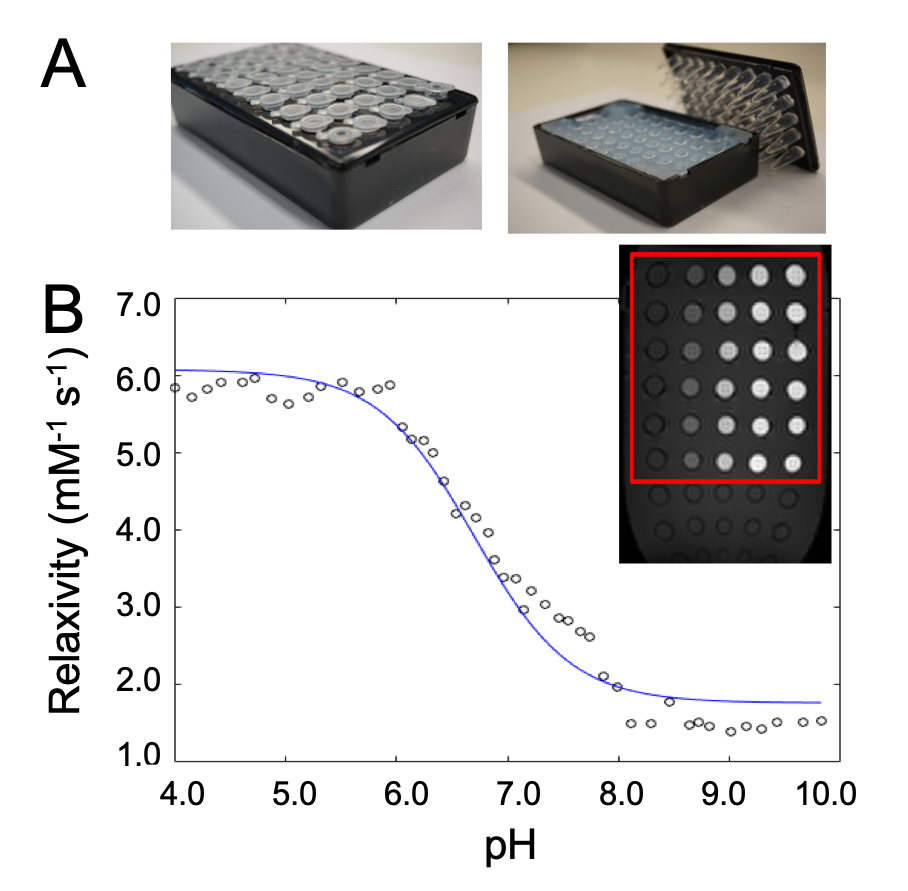
The MRI co-agent was synthesized over 5 steps. The PET co-agent was synthesized by incubating the unchelated ligand with 68GaCl3 in 1 M HEPES, pH=4.8 at 90°C. T1-weighted images for the MRI co-agent at various concentrations and pH values were acquired using a VTR method with a 7T Bruker BioSpec MRI. The pH-dependent r1 relaxivity of the agent was determined from the measured R1 relaxation rates and agent concentrations. The r1 vs. pH data was fit to a modified Henderson-Hasselbalch equation. Phantoms were filled with the co-agents at various concentrations and pH values. Simultaneous PET/MRI measurements were acquired using a 7T Bruker BioSpec MRI and a Cubresa NuPET insert. MRI co-agent concentration was determined from PET using the known ratio of the co-agents, and r1 was determined from R1 and these concentrations. pH was calculated from r1 using the modified Henderson-Hasselbalch equation. A MIA PaCa-2 tumor-bearing mouse was imaged following typical DCE-MRI methodology to establish “baseline” T1-weighted image. The mouse was then injected intravenously with a known ratio of the PET/MRI co-agents. During and after injection, 120 MR images were acquired for approximately 16 minutes with 7.6 sec temporal resolution. PET counts were acquired during acquisition of these 120 MR images. A pre-contrast tumor T1 time was obtained from the “baseline” T1-weighted image. T1 values for each time frame were derived from the SPGR imaging equation,3 and ΔR1 was calculated from pre- and post-contrast T1 times. An average ΔR1 was calculated for every 15 MRI frames. The PET data was binned into 114 second datasets (corresponding to 15 MRI frames). A ROI was drawn around the entire tumor based on the MR image, and the amount of activity was calculated for that ROI, which was converted to a MRI co-agent concentration using the ratio of injected PET/MRI co-agents. The averaged ΔR1 values were divided by MRI co-agent concentration at each timepoint to obtain a set of relaxivities. Once r1 reached consistency, those values were averaged and subjected to the modified Henderson-Hasselbalch equation to obtain pH.Results
The MRI co-agent was synthesized with an overall yield of 59% (Figure 1A). The PET co-agent was synthesized at ≥98% radiochemical purity with a 63±3% decay-corrected yield (Figure 1B). The MRI co-agent shows a pH-responsive change in r1 (Figure 2B). The mid-point of the pH-r1 curve corresponds to the pKa of the sulfonamide arm,4 which is displaced from the gadolinium at low pH values allowing for a change in water accessibility to the metal. pH measurements for phantoms at 0.08 mM had a standard error of 0.08 units, which is acceptable to detect a change in pH due to therapy (Figure 3A).5 At lower concentrations (0.8, 0.5, 0.25 mM), there was an increase in standard error to 0.26 units (Figure 3B), but these concentrations can still be used to identify tumor vs. non-tumor tissue.6 A pHe value of 6.76 was obtained using PET/MRI for our tumor mouse model, which corresponds to the acidic tumor microenvironment (Figure 4).1Discussion
While the in vivo data are still preliminary, we are encouraged by these initial results and the robustness of our PET/MRI methodology in phantoms. We have discovered a concentration dependence in the accuracy of our measurements, which is important in order to identify the potential applications of this system. While higher concentrations must be used to confirm therapeutic efficacy, all concentrations tested could be used to determine tumor vs. non-tumor tissue. We have also identified the importance of careful registration of the MRI and PET images to ensure that the ROI drawn for the PET image is based on the actual tumor volume. Errors in ROI volume lead to inaccuracies in the concentration of the MRI co-agent, which propagates into errors in pH.Conclusion
We have designed a new set of PET/MRI contrast agents in high yield and purity that are responsive to pH. We have shown that our PET/MRI contrast agents and analysis methods can be used to measure pH in phantoms and in vivo. In conclusion, our deliverable is a fundamentally new class of contrast agents for molecular imaging with PET/MRI, which has strong potential for clinical translation.Acknowledgements
This work was supported by a grant from NIH/NCI R21 grant 1R21EB027197-01A1. This work was also supported in part by a fellowship from NIH/NCI T32 grant T32CA196561 (ACP).References
1. Heiden MGV, Cantley LC, Thompson CB. Understanding the Warburg effect: the metabolic requirements of cell proliferation. Science 2009;324(5930):1029-1033.
2. Yoo B, Pagel MD. An overview of responsive MRI contrast agents for molecular imaging. Front Biosci 2008;13:1733-1752.
3. DCE MRI Technical Committee. DCE MRI Quantification Profile, Quantitative Imaging Biomarkers Alliance. Version 1.0. Reviewed Draft. QIBA, July 1, 2012. Avaliable from: http://rsna.org/QIBA_.aspx.
4. Lowe MP, Parker D, Reany O, Aime S, Botta M, Castellano G, Gianolio E, Pagliarin R. pH-Dependendent modulation of relaxivity and luminescence in macrocyclic gadolinium and europium complexes based on reversible intramolecular sulfonamide ligation. J Am Chem Soc 2001;123(31):7601-7609.
5. Akhenblit PA, Pagel MD. Recent advances in targeting tumor energy metabolism with tumor acidosis as a biomarker of drug efficacy. J Cancer Sci Therapy 2016;8(1):20-29.
6. Chen LQ, Randtke EA, Jones KM, Moon BF, Howison CM, Pagel MD. Evaluations of tumor acidosis within in vivo tumor models using parametric maps generated with acidoCEST MRI. Mol Imaging Biol 2015;17(4):488-496.
Figures