3048
NanoGd, a novel hybrid multimodal nanoparticle designed for inflammation imaging: pre-clinical evaluation in ischemic stroke1Université Lyon, CarMeN laboratory, Inserm U1060, Lyon, France, 2Université Lyon Institut Neuromyogène CNRS UMR 5310, INSERM U1217, Lyon, France, 3Université de Lyon, Ecole Normale Supérieure de Lyon, CNRS UMR 5182, Université Lyon 1, Laboratoire de Chimie, Lyon, France, 4Université Paris 13, Sorbonne Paris Cité, Laboratoire CSPBAT, CNRS UMR 7244, Paris, France, 5STROBE team, European Synchrotron Radiation Facility, Grenoble, France, 6Université Lyon, Lyon Neuroscience Research Center, CNRS UMR5292, Inserm U1028, Lyon, France, 7Université Lyon, CREATIS CNRS UMR 5220-INSERM U1206, Lyon, France
Synopsis
We here report the first quantitative study using MRI and intravital two-photon microscopy back-to-back to image inflammation in a mouse model of permanent middle cerebral artery occlusion, thanks to NanoGd, a new multimodal nanoparticle. Overall, our data suggest that NanoGd is safe and does not induce inflammation. NanoGd is phagocytosed by Macrophages/Microglia both in-vitro and in-vivo. In permanent ischemic stroke, NanoGd-enhanced MRI allows to visualize inflamed areas within the ischemic lesion and thus appears as a promising tool for the evaluation of anti-inflammatory treatments.
Introduction
Tissue-resident microglia and infiltrated macrophages (M/M) are important mediators of inflammation after ischemic stroke and represent promising therapeutic targets. In the present study, our aim was to investigate the potential of MRI coupled with the injection of a novel nanoparticle (NP), named NanoGd, to image inflammation at the acute stage of ischemic stroke. Our hypothesis was that NanoGd would be phagocytosed by activated M/M. NanoGd-enhanced MRI might thus allow to visualize the brain inflamed areas like iron oxides.1-3 To understand the biological substrates of NanoGd-induced MR signals, we performed intravital two-photon microscopy back-to-back with MRI in CX3CR1-GFP mice (with fluorescent M/M) submitted to permanent middle cerebral artery occlusion (pMCAO).Methods
NanoGd NPs are composed of a gadolinium fluoride (GdF3) core coated with bisphosphonate polyethylene glycol (BP-PEG),4 functionalized with a near-infrared fluorophore and fully characterized for the purpose of the present study.5 In summary, NanoGd has a hydrodynamic diameter of 28 ± 8 nm, a zeta potential of – 42 ± 6 mV, r1 / r2 relaxivities of 0.98 / 20 mM-1.s-1 at 7T (saline, room temperature) and a prolonged vascular remanence (blood half-life ~6h).To evaluate internalization in-vitro, microglial primary cultures were incubated with NanoGd at [0-1.5 mM] during 24h then imaged with confocal microscopy.
The in-vivo experiment design (Figure 1) was approved by our ethical committee. A total of 31 mice were included. In brief, pMCAo was induced in 28 CX3CR1-GFP mice (sham surgery in 3 mice) at day 0 (D0). Baseline multiparametric MRI included: diffusion-weighted MRI (DWI) and T2-weighted imaging (T2WI) for the assessment of infarct size, T1-weighted imaging (T1WI) pre- and post-Gd-DOTA for the evaluation of blood brain barrier (BBB) integrity and T2*-weighted imaging (T2*WI) for the detection of pre- and post-contrast signal voids. At D1 post-pMCAO, mice were divided into 3 groups: pMCAO (N=6), pMCAO + NanoGd (N=22), sham + NanoGd (N=3). NanoGd was injected intravenously at 2 mmol Gd/kg after baseline MRI. All mice were re-imaged with multiparametric MRI at D3. A subgroup of mice (N=1 pMCAO, N=10 pMCA0 + NanoGd, N=3 sham + NanoGd) underwent two sessions of intravital two-photon microscopy back-to-back with MRI at D1 and D2. At the end of the last imaging session, mice were sacrificed by intracardiac perfusion and their brains were prepared either for x-ray based phase contrast tomography6 or for histological analysis. Infarct size and signal voids were quantified longitudinally on MRI. The number of CX3CR1+ cells that have internalized NanoGd were quantified longitudinally on two-photon microscopy. Statistical analyses were performed using (paired) student’s t tests and Pearson correlation analysis. Data are presented as median [25% percentile; 75% percentile].
Results
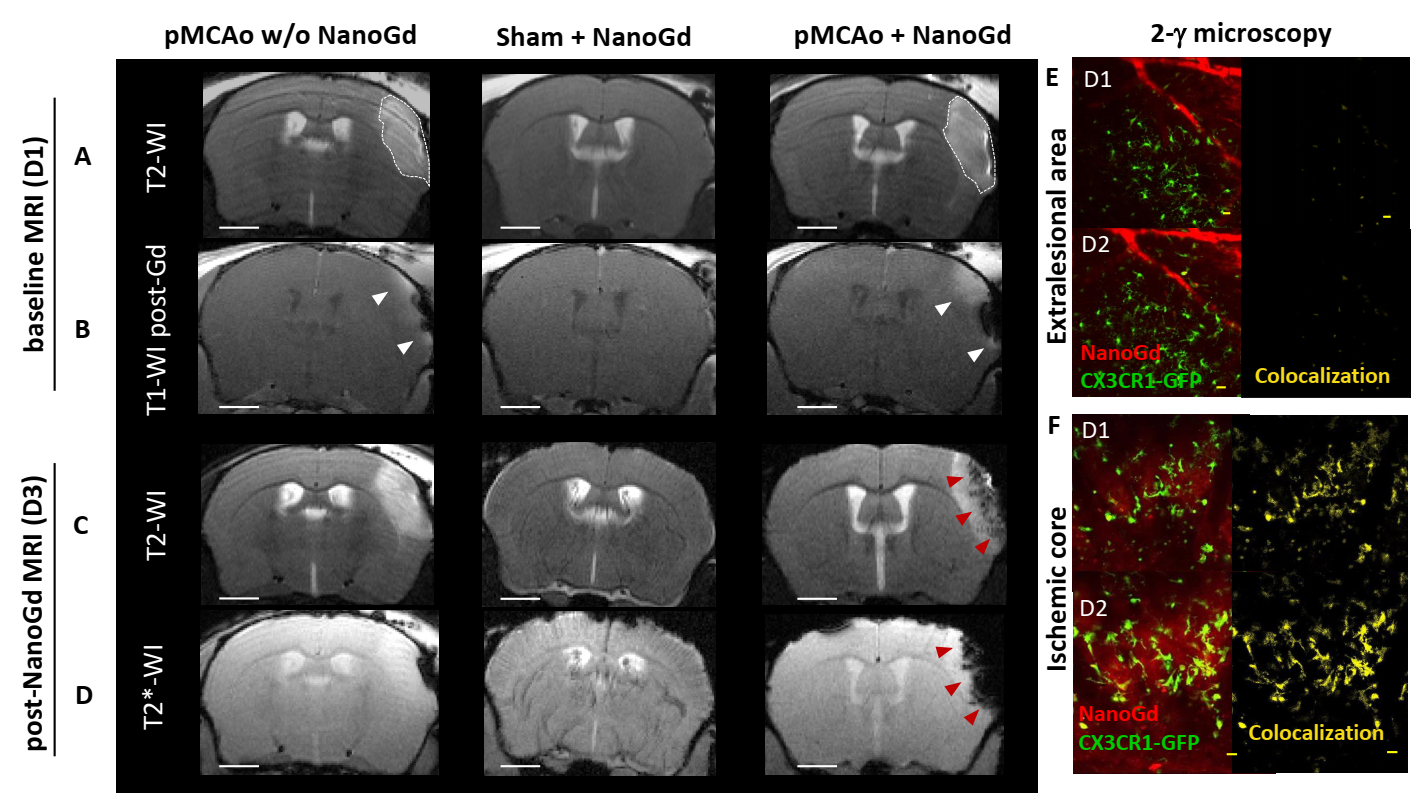
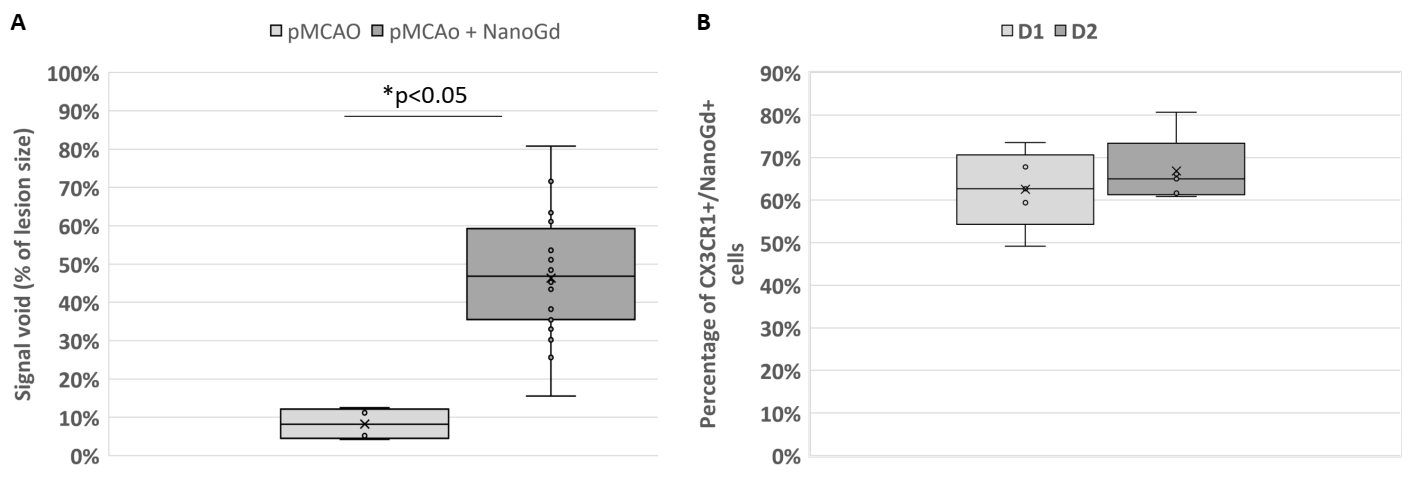
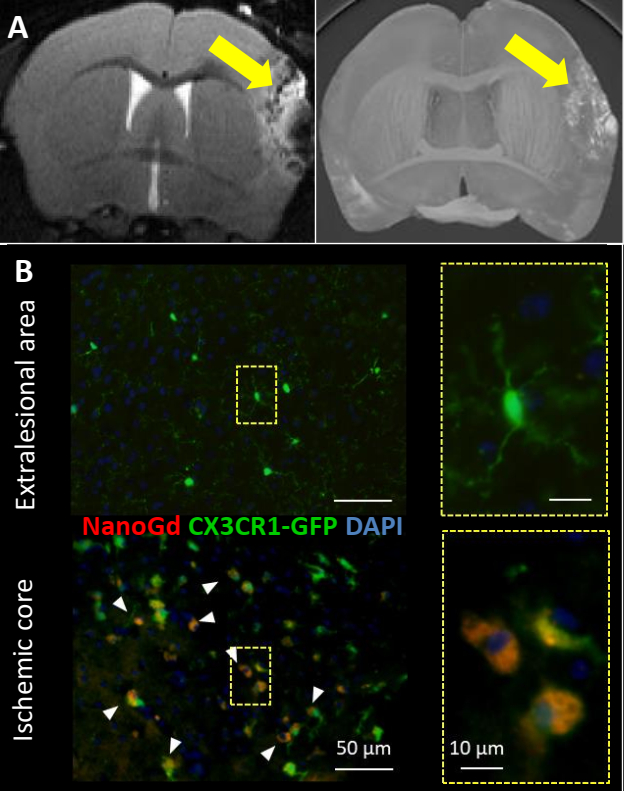
Confocal microscopy of microglial cultures demonstrated an internalization of NanoGd by M/M (Figure 2) without acute toxicity.All animals survived and completed the in-vivo protocol. Post-Gd-DOTA T1WI showed BBB disruption in the ischemic lesion of all pMCAO mice at baseline (Figure 3A-B). Post-NanoGd T2WI and T2*WI showed strong hypointense MR signals in the ischemic lesion of pMCAO mice, especially in the ischemic core, not found in control groups (Figure 3C-D). There was only a partial overlap between regions with BBB disruption and those with NanoGd-induced signal voids. Infarct size was stable between baseline and follow-up: 16 [11; 19] mm3 vs 14 [11; 19] mm3 (p=0.968); of note, NanoGd did not alter infarct size at D3 (14 [11; 20] mm3 in pMCAO + NanoGd vs 15 [12; 16] mm3 in pMCAO; p=0.382). In mice injected with NanoGd, the volumes of signal voids were significantly higher at D3 compared to baseline (6 [5; 8] mm3 vs 3 [2; 4] mm3, p=0.0007). In pMCAO + NanoGd, signal voids comprised 47% [36%; 55%] of the ischemic lesion at D3, which was significantly more than in pMCAO without NanoGd (8% [5%-11%], p=0.0001) (Figure 4A). There was no correlation between signal voids extent and infarct size at D3 (R2=0.17). In the subgroup of mice imaged with intravital two-photon microscopy, NanoGd internalization by CX3CR1+ cells was observed in the ischemic lesion (Figure 3F) but not in the extralesional areas (Figure 3E). There was a non-significant trend towards a higher percentage of CX3CR1+/NanoGd+ cells in the ischemic core than in the perilesional area at D1 (73% [69% ; 78%] vs 56% [49% ; 66%], p=0.30) and D2 (72% [64% ; 77%] vs 66% [56% ; 67%], p=0.49). The percentage of CX3CR1+/NanoGd+ cells in the ischemic lesion did not significantly vary between D1 and D2 (63% [59% ; 68%] vs 65% [62% ; 66%], p=0.20, Figure 4B). Post-mortem analyses of perfused brain confirmed the presence of gadolinium in the ischemic lesion (Figure 5A) and the internalization of NanoGd by CX3CR1+ cells (Figure 5B).
Discussion
We here report the first quantitative study using MRI and intravital two-photon microscopy back-to-back to image inflammation in pMCAO thanks to NanoGd, a new multimodal NP. Overall, our data suggest that NanoGd is safe and does not induce inflammation. NanoGd is phagocytosed by M/M both in-vitro and in-vivo. One advantage of NanoGd over iron oxides is the possibility to be imaged specifically with spectral CT.4Conclusion
NanoGd-enhanced MRI may provide a surrogate marker of post-stroke inflammation and might thus be useful for anti-inflammatory treatment evaluation.Acknowledgements
The authors thank Radu Bolbos and Jean-Baptiste Langlois of the Animage platform (CERMEP, Lyon) for their technical assistance. This research was funded by the French national research agency (ANR) project NanoBrain (grant # ANR-15-CE18-0026-01) and was performed within the framework of the RHU MARVELOUS (ANR16-RHUS-0009) of University Claude Bernard Lyon (UCBL), within the program “Investissements d’Avenir”. We also thank ESRF for allocation of beamtime.References
1. Desestret V, Brisset JC, Moucharrafie S, Devillard E, Nataf S, Honnorat J, et al. Early-stage investigations of ultrasmall superparamagnetic iron oxide-induced signal change after permanent middle cerebral artery occlusion in mice. Stroke. 2009;40:1834-1841
2. Marinescu M, Chauveau F, Durand A, Riou A, Cho TH, Dencausse A, et al. Monitoring therapeutic effects in experimental stroke by serial uspio-enhanced mri. Eur Radiol. 2013;23:37-47
3. Wiart M, Davoust N, Pialat JB, Desestret V, Moucharaffie S, Cho TH, et al. Mri monitoring of neuroinflammation in mouse focal ischemia. Stroke. 2007;38:131-137
4. Halttunen N, Lerouge F, Chaput F, Vandamme M, Karpati S, Si-Mohamed S, et al. Hybrid nano-gdf3 contrast media allows pre-clinical in vivo element-specific k-edge imaging and quantification. Scientific reports. 2019;9:12090
5. Karpati S, Lerouge F, Wiart M, Hubert V, Berthezene Y, Monteil M, et al. Imaging inflammation in ischemic stroke: Development of a multimodal nanoprobe for brain imaging. 3rd International Conference on Nanomaterials for Health, Energy and the Environment, Mooloolaba, Australia, 2018
6. Marinescu M, Langer M, Durand A, Olivier C, Chabrol A, Rositi H, et al. Synchrotron radiation x-ray phase micro-computed tomography as a new method to detect iron oxide nanoparticles in the brain. Mol Imaging Biol. 2013;15:552-559
Figures
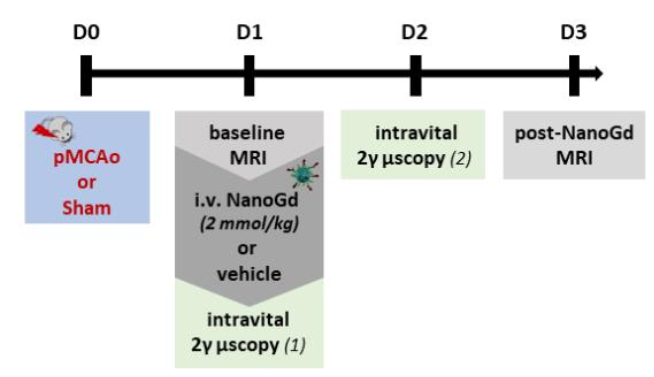
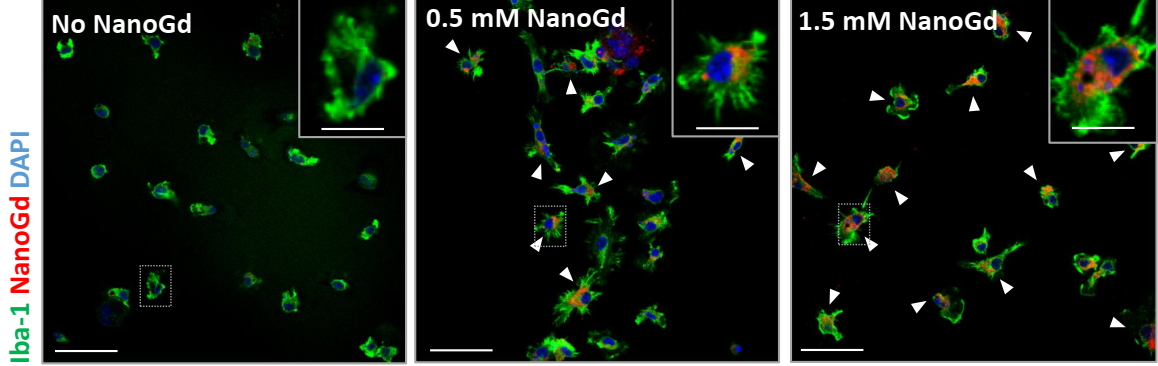
Figure 2- In vitro assessment of NanoGd internalization by M/M. Confocal images of Iba-1 stained microglial cells without NanoGd or incubated with 0.5 mmol/L and 1.5 mmol/L NanoGd. White arrowheads point at microglia cells (green with a blue nucleus) that have internalized NanoGd (red). Scale bars: 50 µm for overview images; 10 µm for magnified insets.