3043
Methemoglobin Modulation as an Alternative Intravascular Contrast agent for T1 contrast Enhancement1UCAIR, Department of Radiology and Imaging Sciences, University of Utah, Salt Lake City, UT, United States, 2Department of Pediatrics, University of Utah, Salt Lake City, UT, United States
Synopsis
There are increasing concerns about Gadolinium based contrasts safety. One potential alternative agent is endogenous intracellular methemoglobin(MrtHb), a paramagnetic molecule in small amounts in our blood cells. Intracellular levels of MetHb can be increased by exposing blood to nitric oxide or sodium nitrite. The previous in vitro studies suggest that an intracellular MetHb level less than 10% sufficiently increases the T1 signal of blood to be an effective contrast agent. The purpose of this work is to evaluate the change of T1 of blood according to a transient increase in intracellular MetHb in an in vivo animal model.
PURPOSE
Gadolinium is an excellent contrast agent for MRI. However, there are increasing concerns about its safety1. One potential alternative agent is endogenous intracellular methemoglobin (MetHb)2, a paramagnetic molecule that is normally present in small amounts in our blood cells3. Intracellular levels of MetHb can be increased by exposing blood to nitrite oxide or sodium nitrite4. Previous in vitro studies suggest that an intracellular MetHb level less than 10% sufficiently increases the T1-weighted signal of blood to be an effective contrast agent2,5. The purpose of this work is to evaluate the change of T1 of blood according to a transient increase in intracellular MetHb in an in vivo animal model by using sodium nitrite(SN) treatment.METHODS
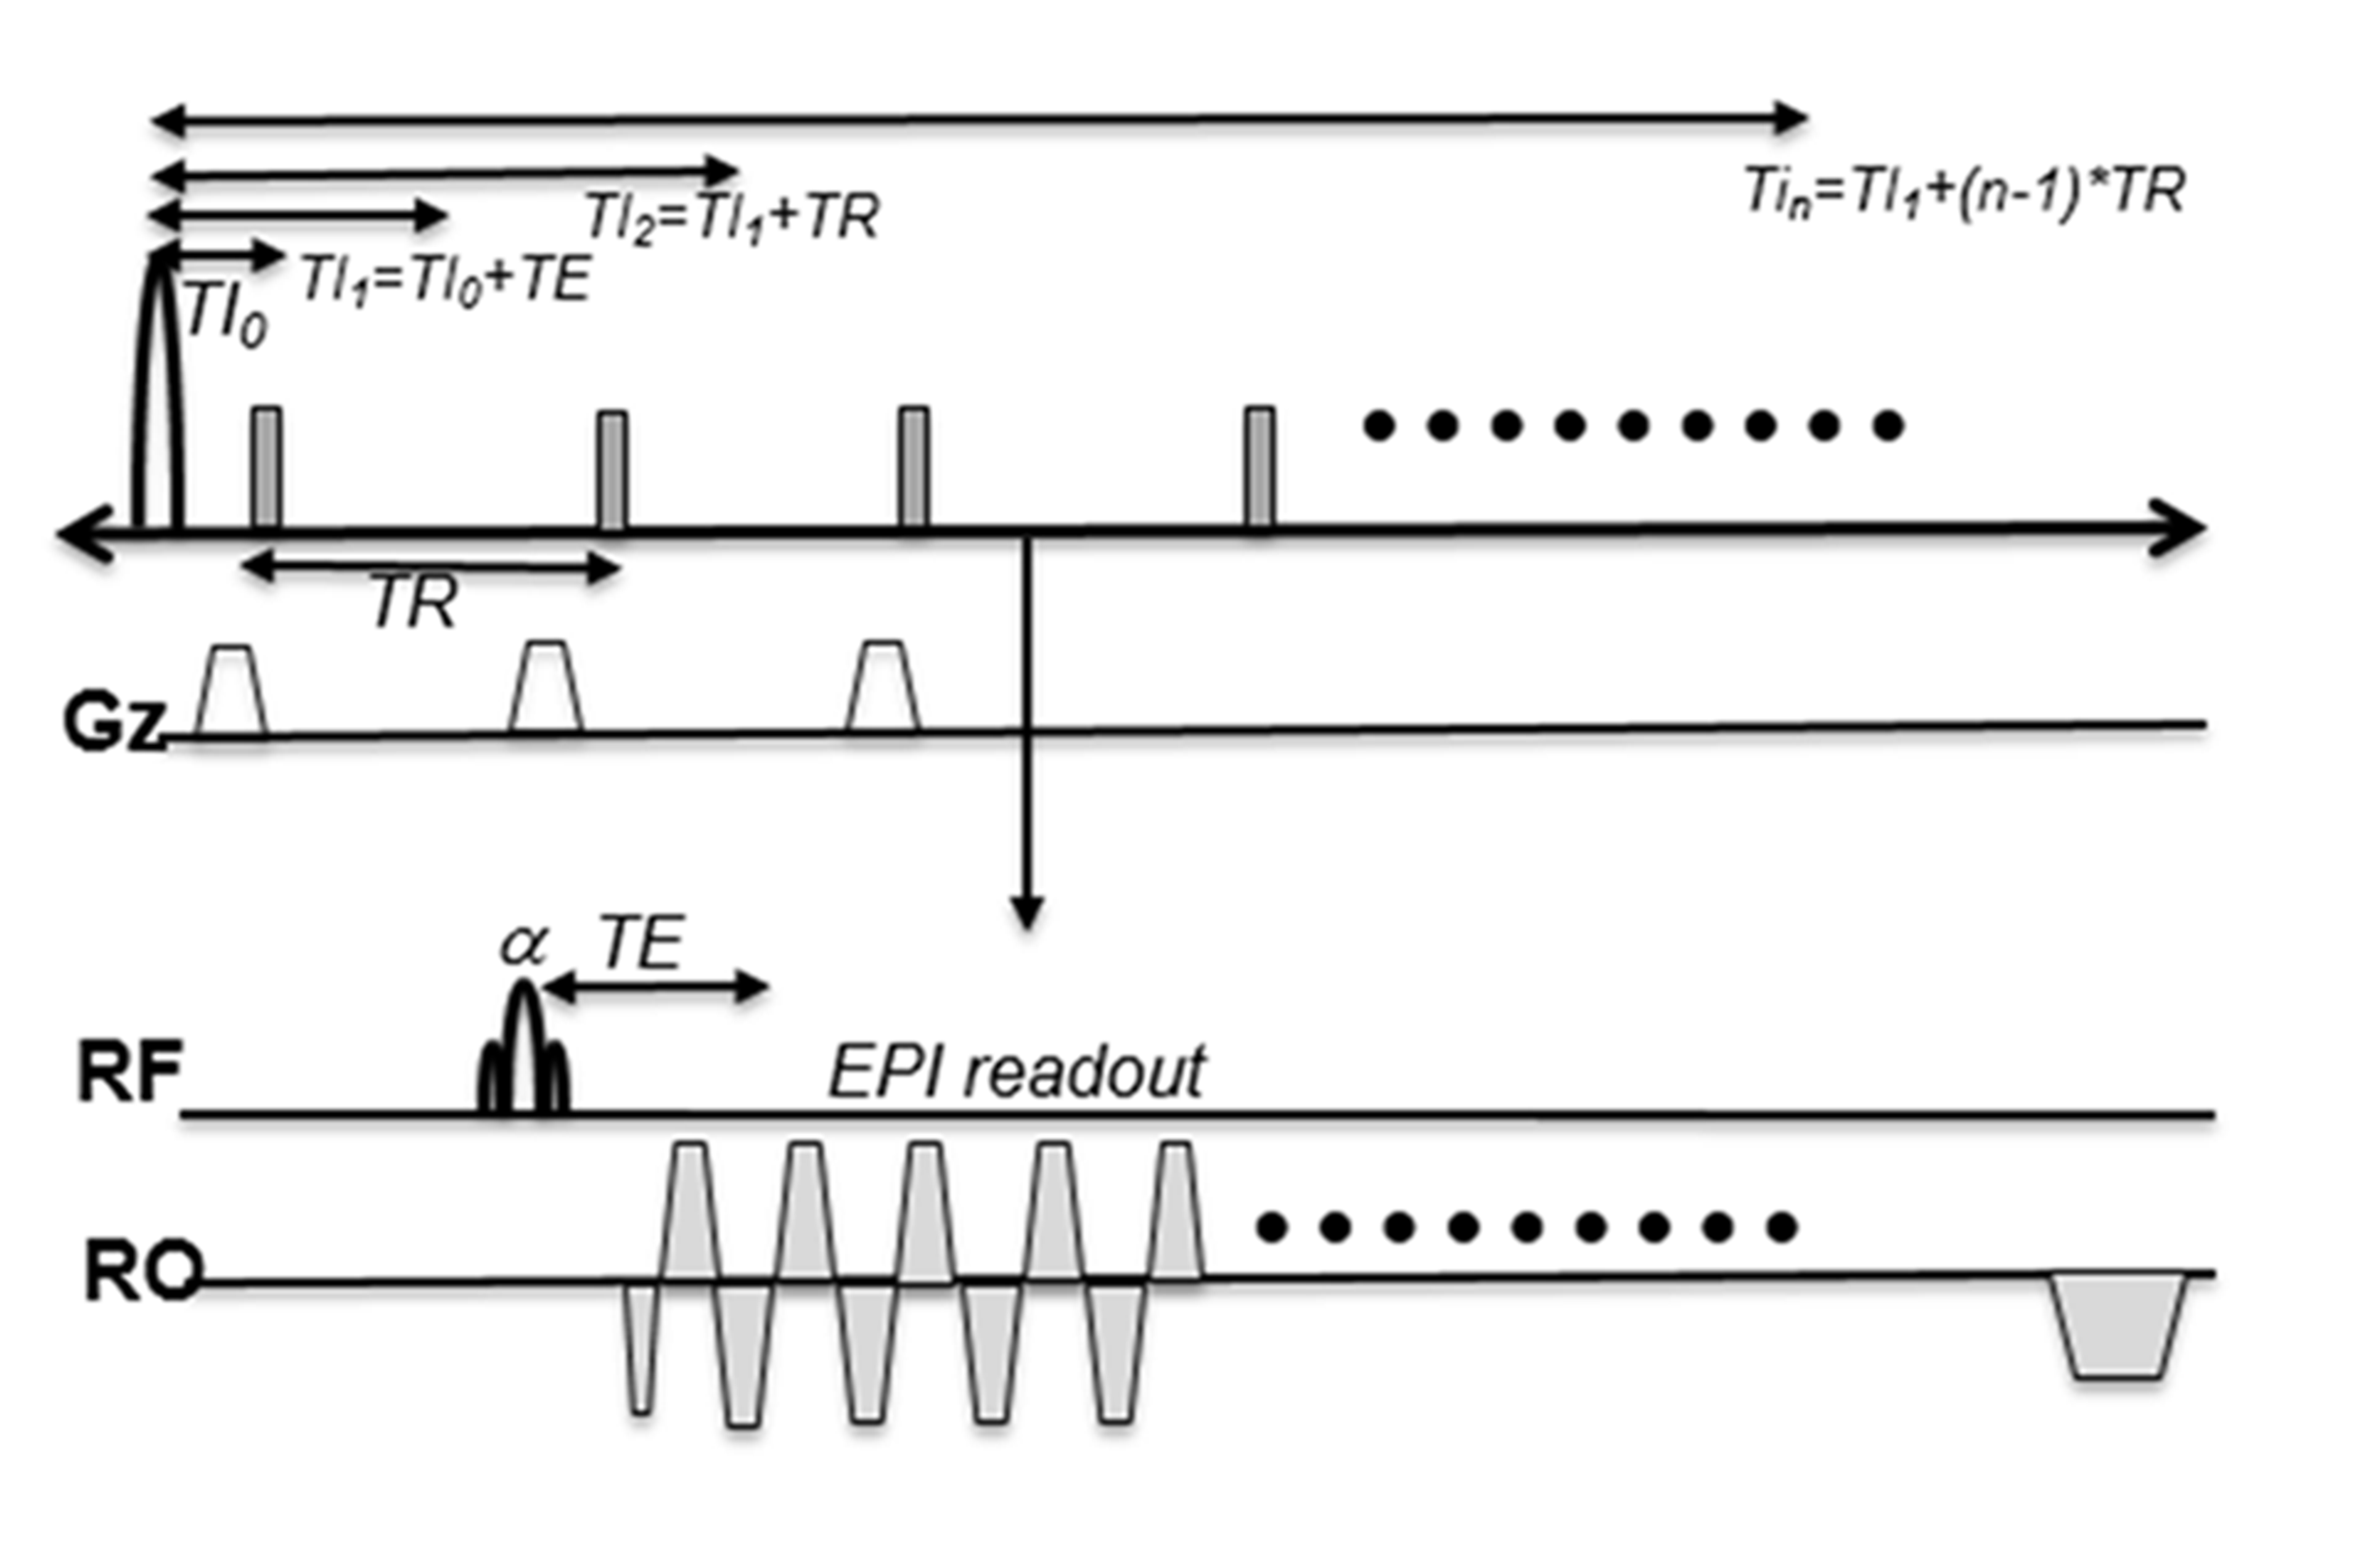
2D single shot(ss) EPI sequence was modified to measure T1 changes of inflowing blood after MetHbs induction. After single application of an inversion recovery(IR) RF pulse, ss-EPI data of the slice of interest was repeatedly acquired at different inversion recovery times(TI). Fig 1 shows our 2D ss EPI with IR sequence. We performed T1 measurements of in vitro cow blood treated with different concentrations of SN to find the optimal dose of intravenous SN for T1 weighted enhancement. All of MRI studies were performed on a 3T MRI system. Two New Zealand white rabbits were treated with 30 mg intravenous dose of SN for MetHb induction. 3D TOF and 3D MPRAGE images were acquired before (baseline) and after (t=30ms) MetHb induction. 2D ss EPI with IR data acquisition was performed at every two minutes up to 30 minutes with TE/TR=25/500ms, TI0=5ms, 10 repetitions, FOV=80x80 mm, and 128 EPI factor. T1 maps were calculated by fitting the signal recovery curve6 and displayed using homemade software.RESULTS
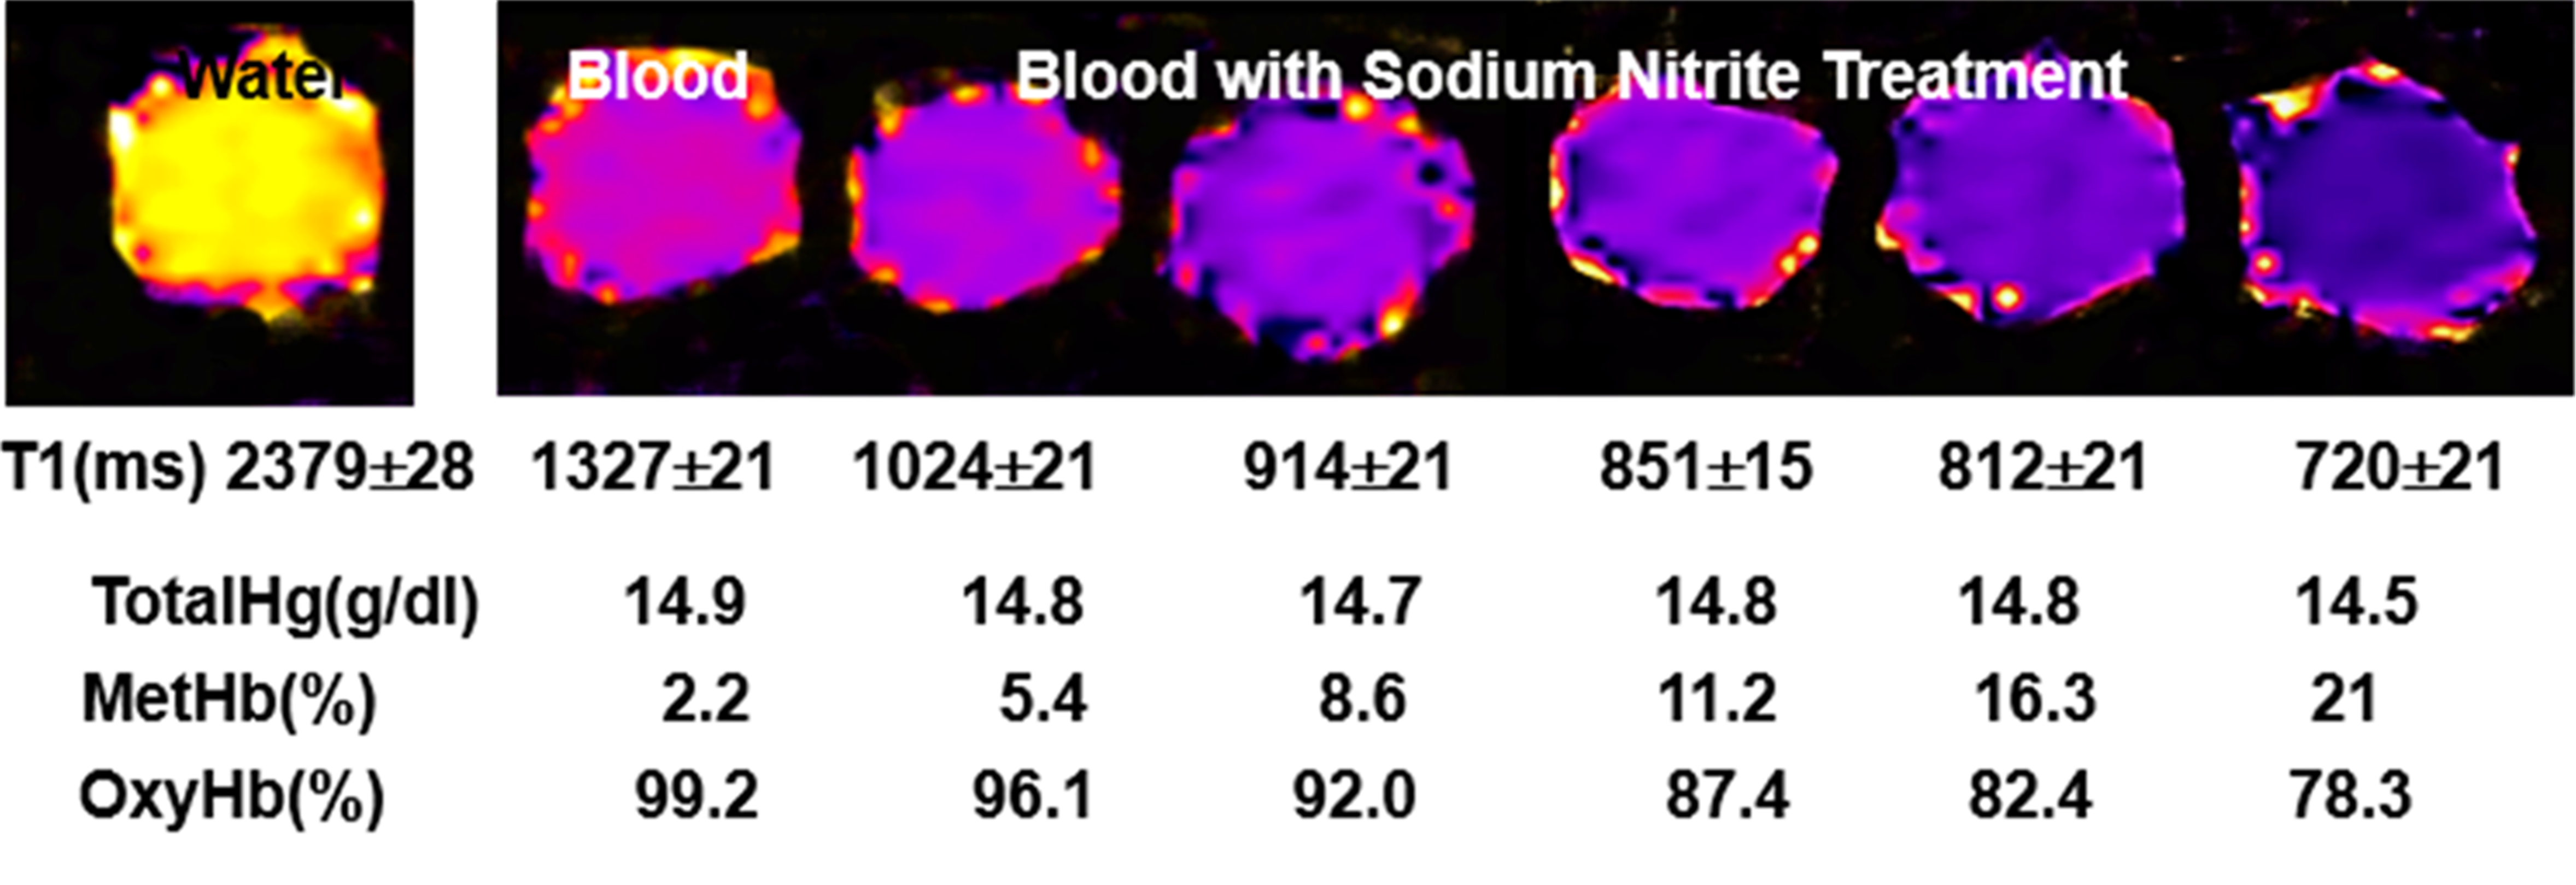
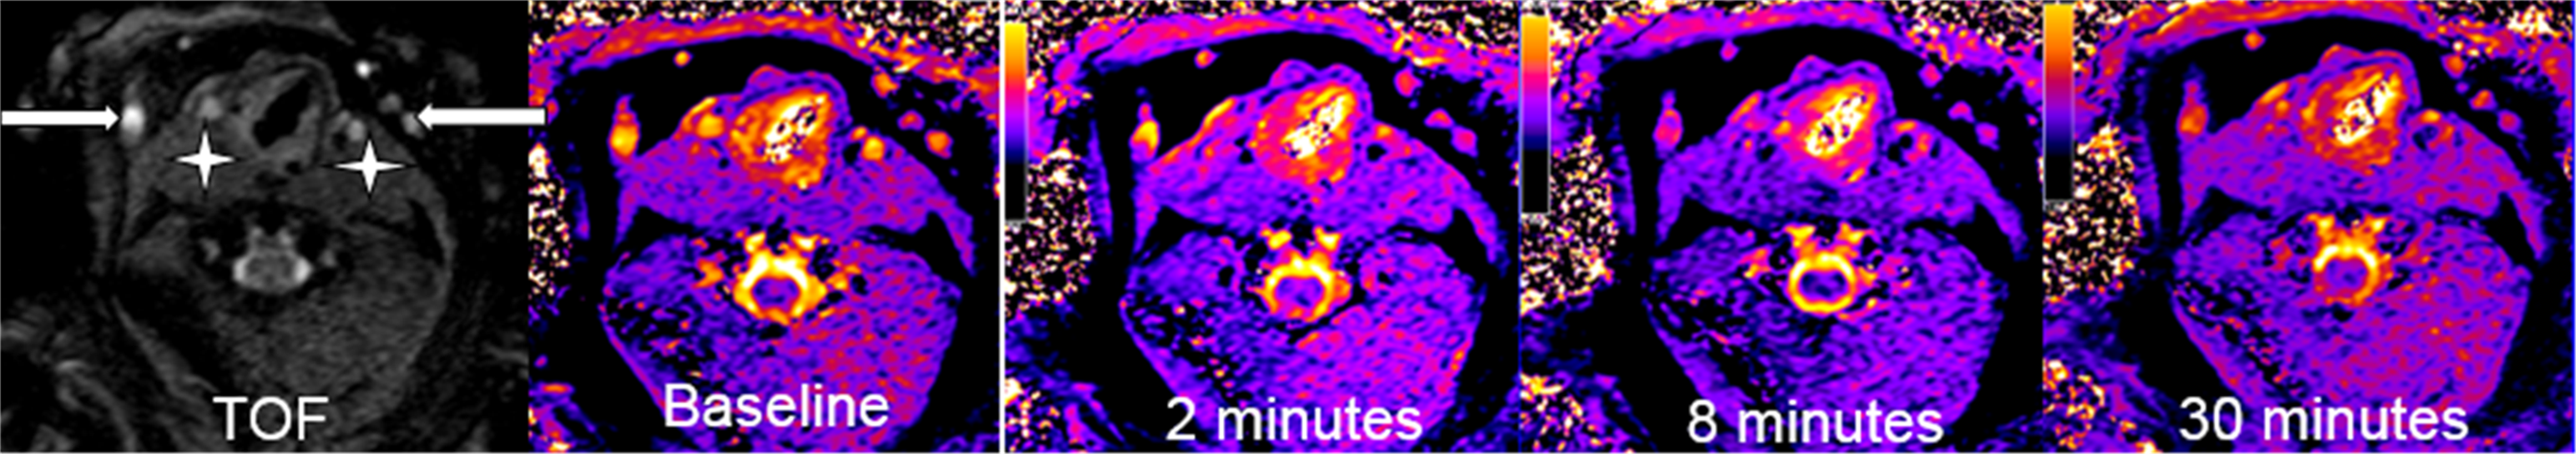
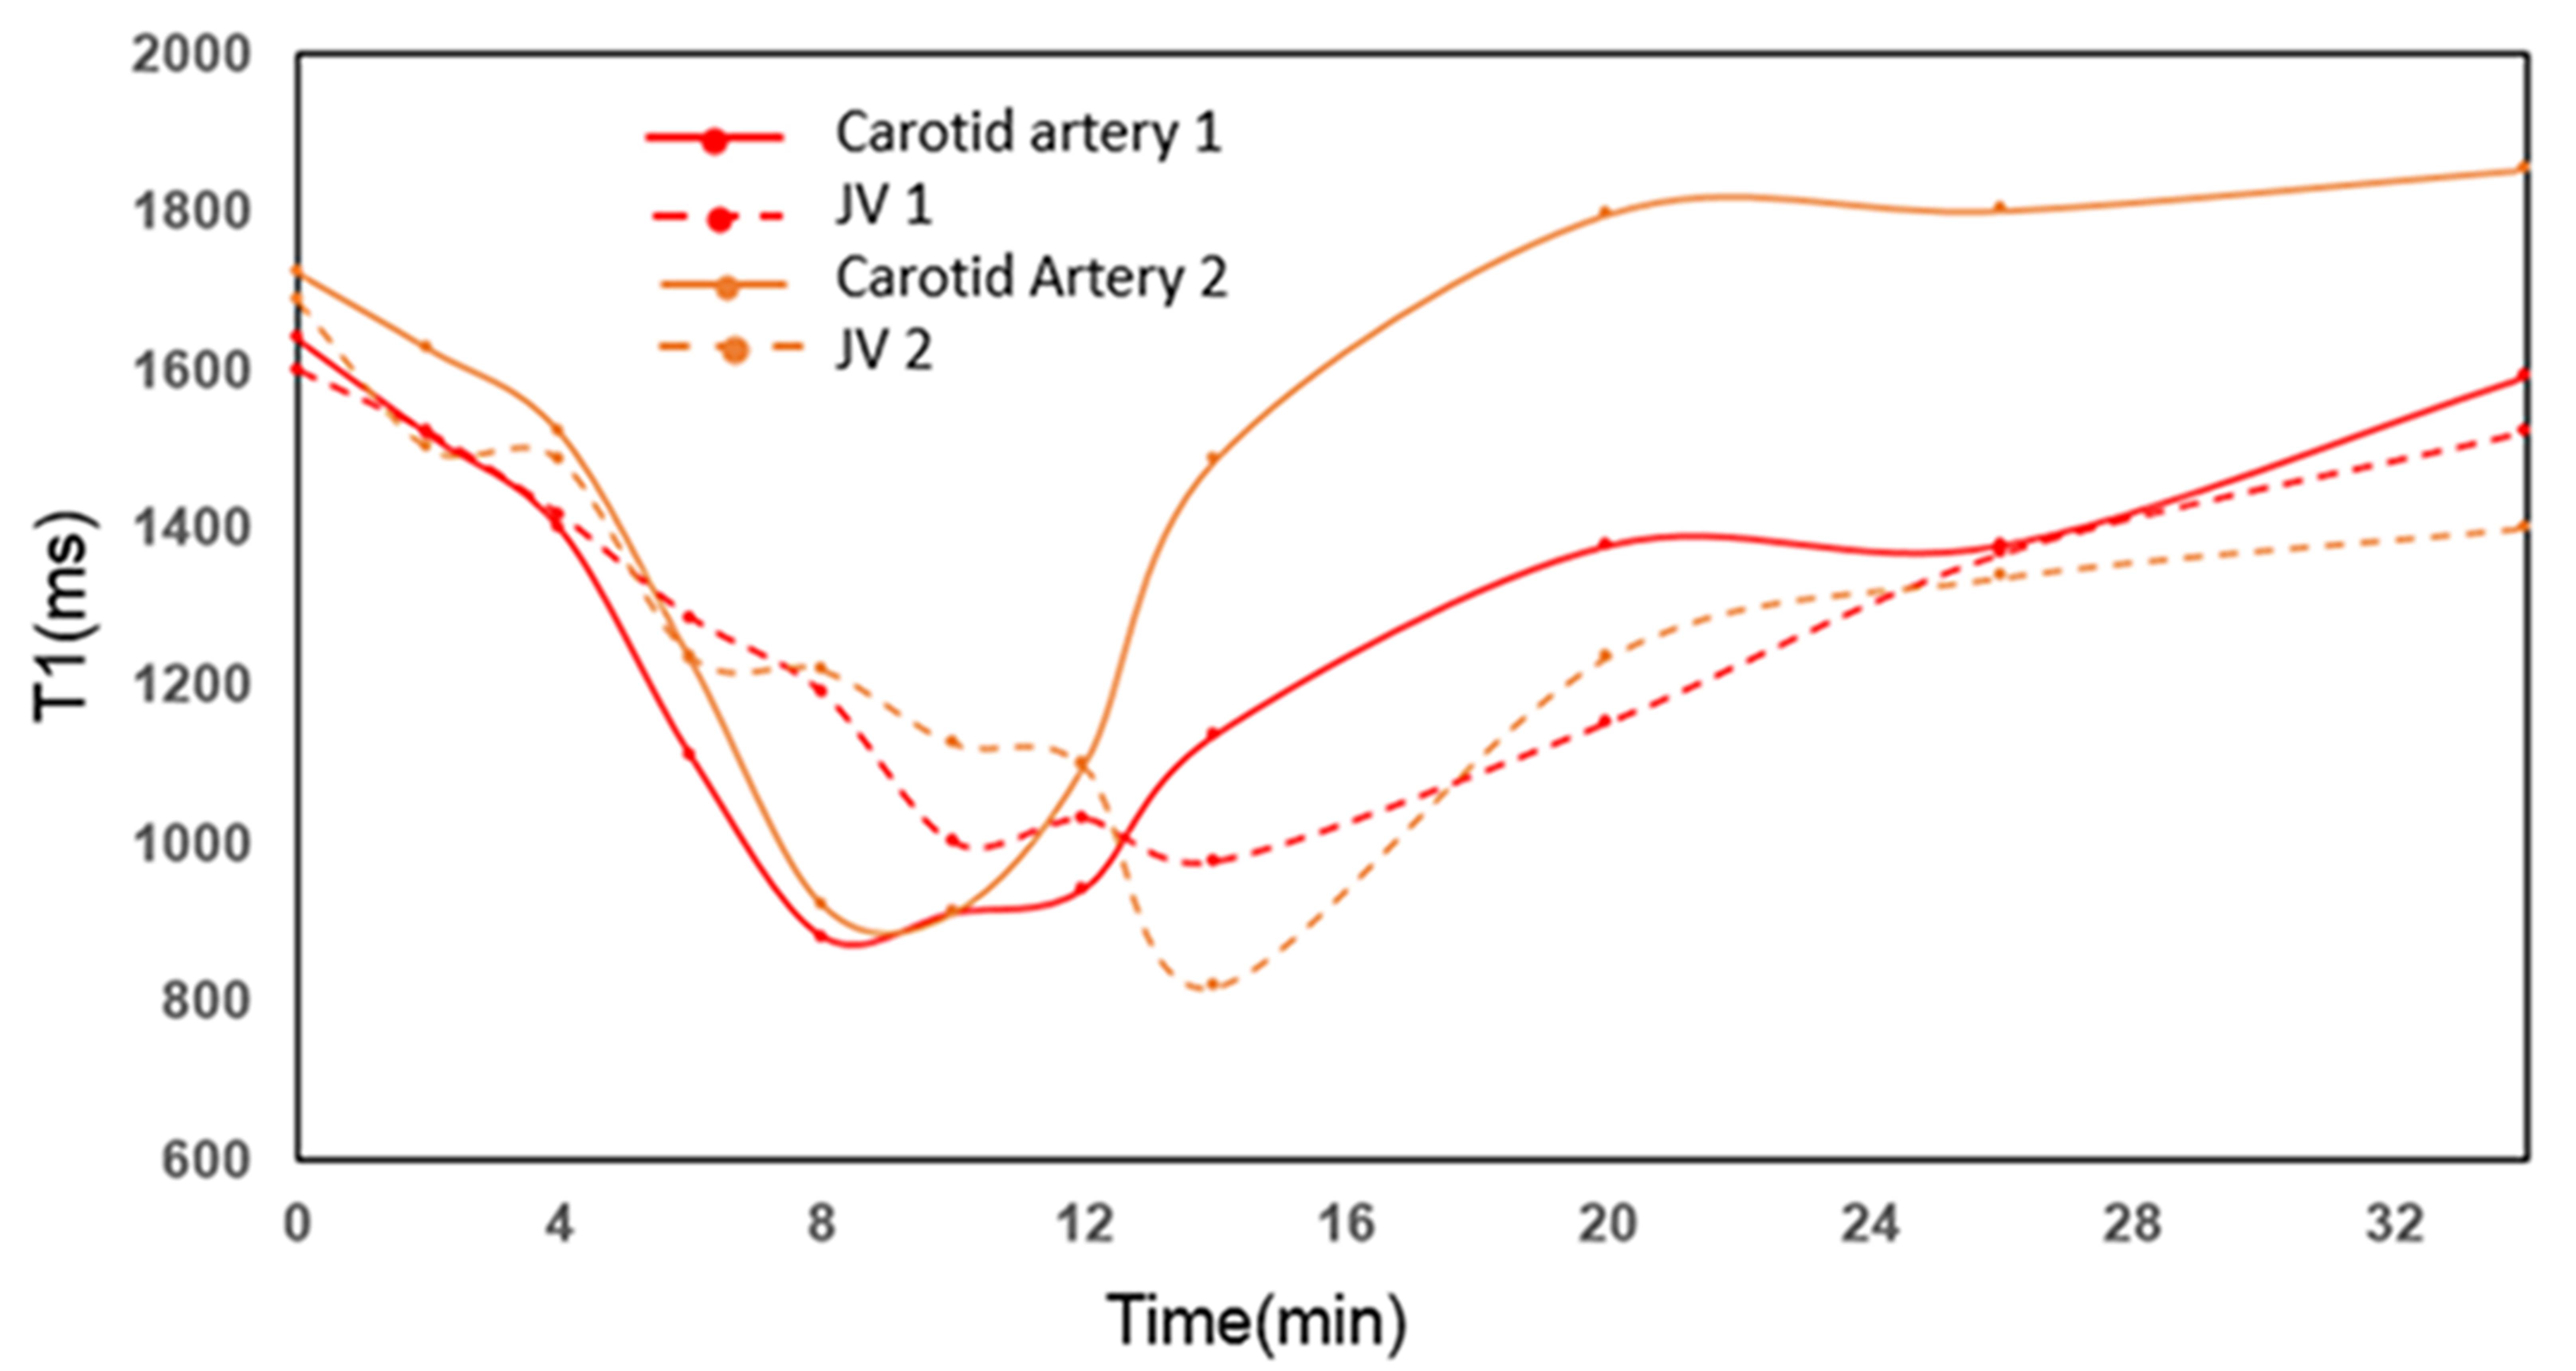
Fig 2 shows results from in vitro MetHb induction by SN treatment. SN substantially increased MetHb levels and decreased T1 of blood. When MetHb level reached at 11%, T1 was decreased to 851±15 ms from 1327±21 ms measured on blood with no treatment. Fig 3 shows dynamic T1 maps of in vivo MetHb induction by using SN treatment from one rabbit study. Before SN treatment, mean T1 on carotid artery and JV were 1639±112 and 1599±98 ms, respectively. After 8 minutes from SN injection, T1 on carotid artery and JV were decreased to 884±82 and 1192±86 ms, respectively. The dynamic T1 changes of in vivo MetHb induction from two rabbit studies were plotted on the Fig 4. The time to reach the maximum T1 enhancement for carotid artery and vein were 8 to 10mins and 12 to 14 mins from SN injection time, respectively. It took 30 minutes for both artery and vein to recover to the level of baseline T1.DISCUSSION
This study was the first to demonstrate in vivo MetHb modulation can create T1 contrast changes on blood and tissue. In our in vitro study, there was a noticeable T1 change depending on the levels of MetHb on the blood(Fig 2). Our rabbit model demonstrated that the elevation of MetHb level resulted T1 shortening (Fig 3). There was also an evidence of soft tissue enhancement after MetHb induction. We observed that there was a time difference between artery and vein to reach the maximum T1 enhancement via MetHb induction. Therefore, T1 relaxation time can be used to assess the localization and amount of MetHb level directly and with high sensitivity. The FDA has approved sodium nitrite for cyanide poisoning. However, MetHb decreases the oxygen carrying capacity of blood. As a result, high levels of intracellular MetHb are not safe for individuals who cannot tolerate a transient decrease in oxygen7. Therefore, we need to investigate the safety and efficacy of a transiently induced increase in intracellular MetHb. We also need to further characterize time course of T1 change and to determine location of T1 signal changes on venous vs. arterial or intravascular vs. extravascular.CONCLUSION
Methemoglobin modulation from sodium nitrite has a great potential for an alternative intravenous contrast agent.Acknowledgements
Supported by the University of Utah Program in Personalized Health and National Center for Advancing Translational Sciences of the National Institutes of Health under Award Number 1UL1TR002538.References
1. Grobner T. Gadolinium--a specific trigger for the development of nephrogenic fibrosing dermopathy and nephrogenic systemic fibrosis? Nephrol Dial Transplant. 2006;21(4):1104-8.
2. Umbreit J. Methemoglobin--it's not just blue: a concise review. Am J Hematol. 2007;82(2):134-44
3. Day RW, Day RW, White KS, et al. Nitric oxide increases the signal intensity of the T1-weighted magnetic resonance image of blood. J Cardiovasc Magn Reson. 2005;7(4):667-9.
4. Wright RO, Lewander WJ, Woolf AD. Methemoglobinemia: etiology, pharmacology, and clinical management. Ann Emerg Med. 1999;34(5):646-56
5. Jaffey JA, Harmon MR, Villani NA, et al. Long-term Treatment with Methylene Blue in a Dog with Hereditary Methemoglobinemia Caused by Cytochrome b5 Reductase Deficiency. J Vet Intern Med. 2017;31(6):1860-5.
6. Guo JY, Kim SE, Zhang L, et al. Improved accuracy and consistency in T1 measurement of flowing blood by using inversion recovery GE-EPIMed Phys, 2005:32(4), 1083-93.
7. Thunberg CA, Morozowich ST, Ramakrishnaet H, Inhaled therapy for the management of perioperative pulmonary hypertension. Ann Card Anaesth. 2015 Jul-Sep; 18(3): 394–402
Figures