3041
Quantification pipeline for in-vivo hyperpolarized 13C magnetic resonance spectroscopy in rats1Department of Radiology & Biomedical Imaging, University of California, San Francisco, San Francisco, CA, United States
Synopsis
Although the hyperpolarized (HP) spectroscopy shows significant SNR enhancement, quantification of the HP in-vivo spectrum can sometimes be challenging due to low metabolite levels, rapid signal relaxation, short acquisition time, and signal overlap. This study describes a quantification pipeline which includes spectral denoising and automatic fitting using LCModel in order to monitor dynamic HP in-vivo brain metabolism. HP [2-13C] Pyruvate in-vivo data was acquired from healthy rats. Proposed quantification pipeline revealed low concentration metabolites which were not clearly visible before denoising and allowed for improved metabolic kinetic information.
Introduction
Hyperpolarized (HP) 13C magnetic resonance spectroscopy (MRS) makes it possible to monitor dynamic brain metabolism non-invasively. HP 13C spectroscopy shows significant SNR enhancement, however, quantification of the HP in-vivo spectrum can sometimes be challenging due to low metabolite levels, rapid signal relaxation, short acquisition time, and signal overlap associated with insufficient B0 field and poor shimming. Therefore, additional processing and quantification steps that improve spectral SNR and separate overlapped peaks are required. This study describes a quantification pipeline which includes spectral denoising and automatic fitting in order to monitor dynamic HP in-vivo brain metabolism.Methods
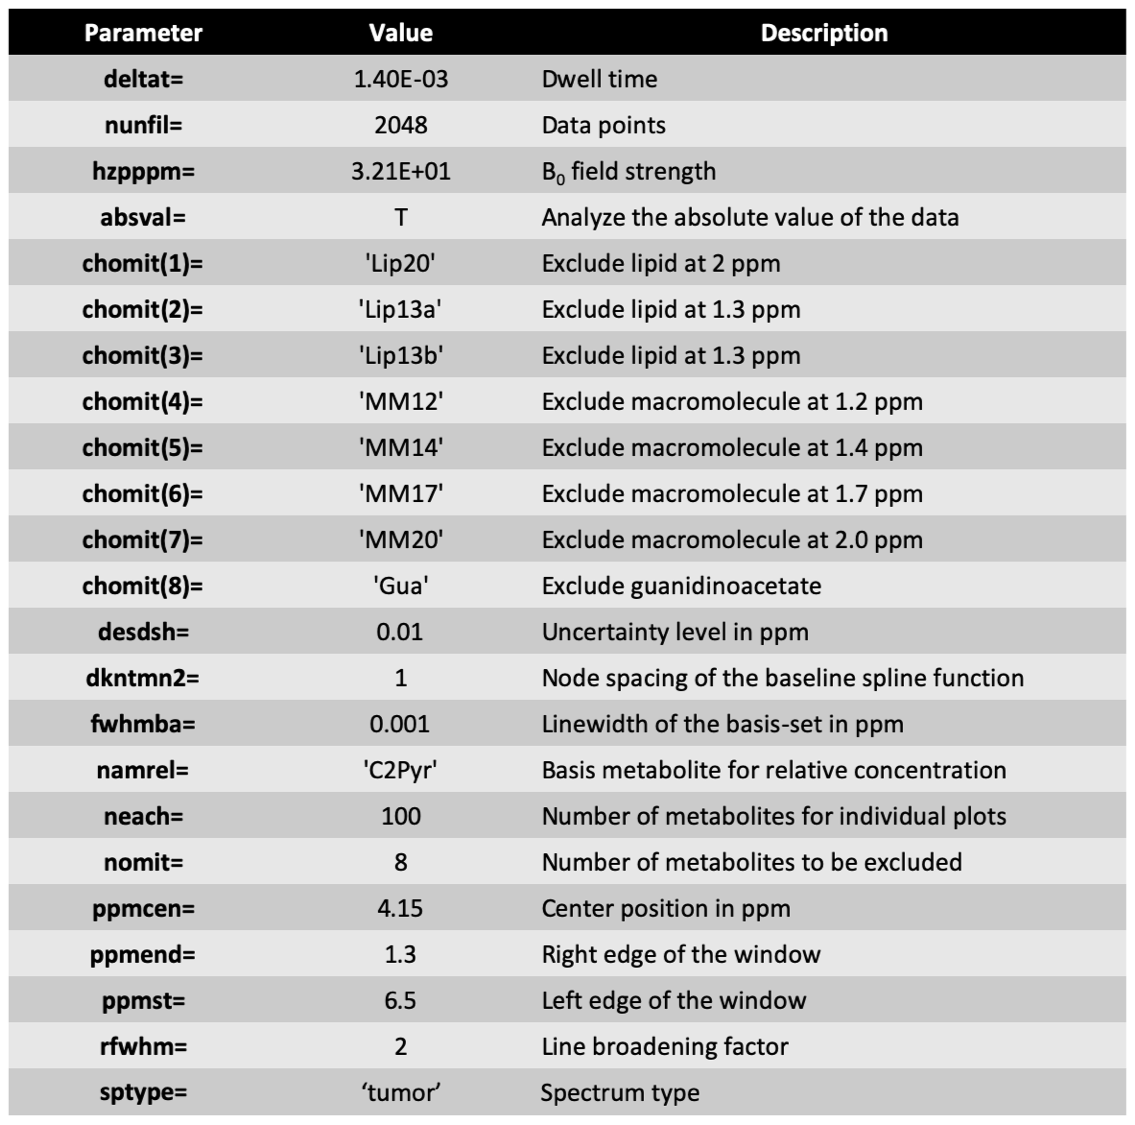
Rats were anesthetized using isoflurane (1.5 - 2 % in O2, 1L/min). T2 weighted images of the rat brain were acquired on a pre-clinical scanner (Biospec 3 T, Bruker, Germany) using a multi-slice spin-echo sequence with following parameters: TE = 64 ms, TR = 3484 ms, matrix = 256 × 256, resolution = 0.13 x 0.13 mm2, slice thickness = 1 mm and number of averages = 6. 48 uL of [2-13C] Pyruvate was hyperpolarized using a Hypersense DNP polarizer (Oxford instrument, UK) and injected through the tail vein of five healthy nude rats over approximately 10 sec. 1-D dynamic slab spectroscopy data using spectral-spatial excitation (10 mm thickness, flip angle 1 = 30° at 184 ppm, flip angle 2 = 4° at 208 ppm, NT = 32, and temporal resolution = 3 sec) was acquired from the rat brain starting with the injection.Singular value decomposition (SVD)1 was used to reduce spectral noise prior to metabolite quantification and the LCModel (Provencher, Canada)2,3 fitting was used to quantify the different metabolites. The basis set for the LCModel fitting included [1-13C] Pyruvate, [2-13C] pyruvate, [1-13C] acetoacetate, [1-13C] acetylcarnitine, [2-13C] pyruvate-hydrate and [2-13C] lactate based on simulations using NMRSIM in Topspin suite (version 4.0, Bruker, Germany). The chemical shifts of the in-vivo spectra and fitting models were down-scaled 50 times and LCModel control parameters were modified to suit the 13C spectral environment (see, Table 1). Spectral quality and fitting quality were evaluated by SNR and Cramer Rao Lower Bound (CRLB), respectively.
Results
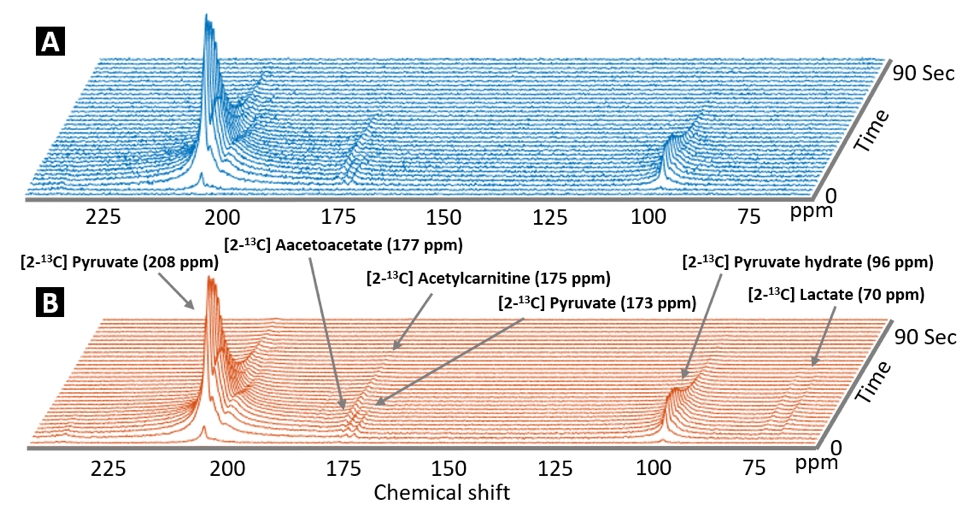
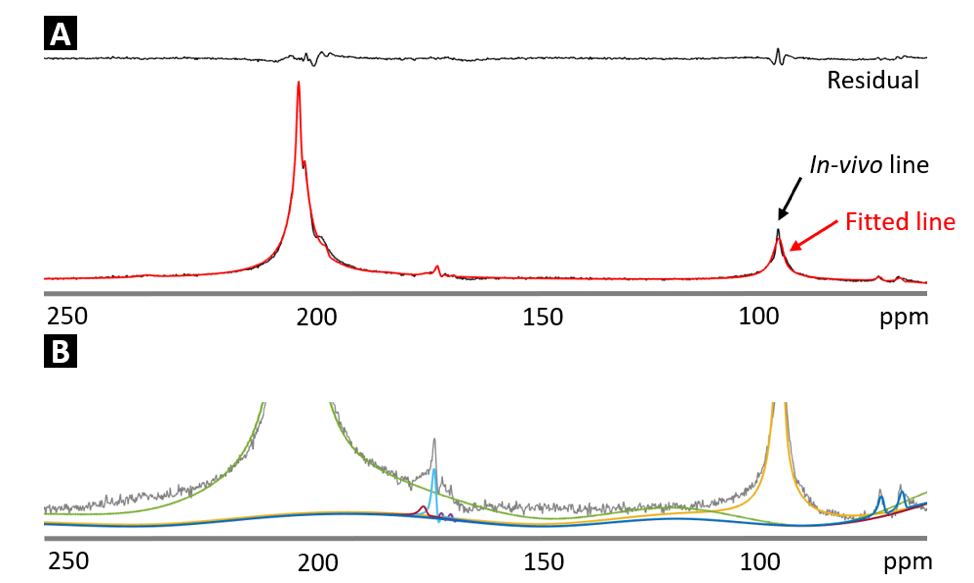
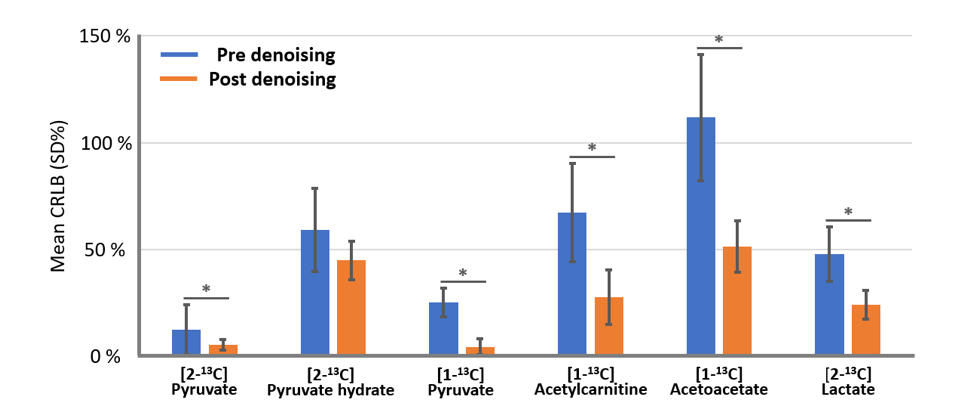
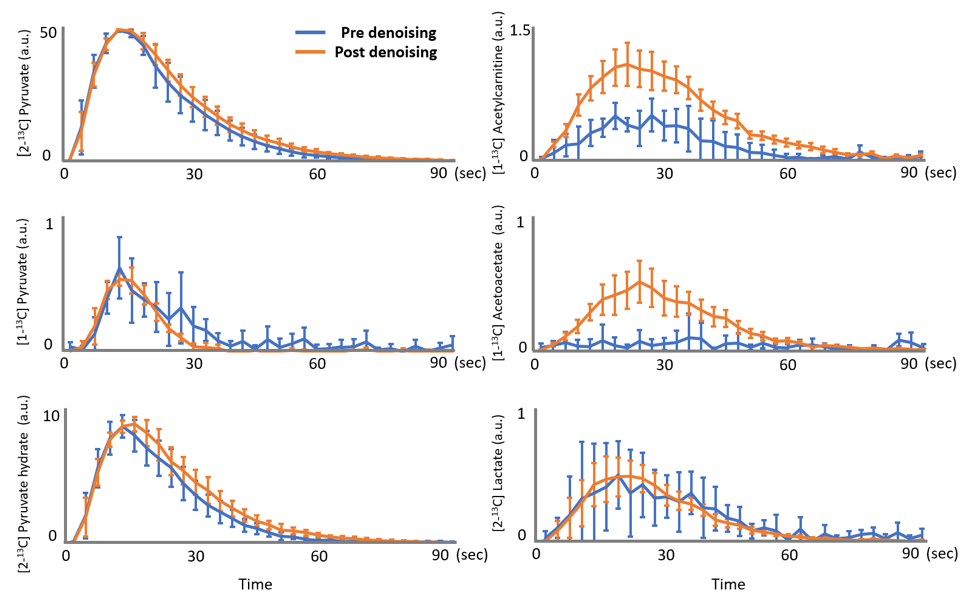
Figure 1 shows a comparison of unprocessed (A) and processed (B) spectra over time. The averaged SNR gain over subjects using the SVD is 4.06 ± 0.64 as estimated using the amplitude of the [2-13C] pyruvate peak compared to noise. LCModel fitting results of post-denoising spectra from one rat are shown in Figure 2. Figure 3 demonstrates that the denoised spectra show superior stability and significantly improved LCModel fitting precision for estimating most metabolite levels when compared to the unprocessed data. As a result, when considering the dynamic data (Figure 4) the denoised spectra improved our ability to use LCModel and rapidly assess metabolic kinetics particularly for low SNR metabolites and when compared to the unprocessed signal.Discussion
HP 13C MRS is a unique monitoring tool that provides real-time reaction, kinetics and enzyme activities of in-vivo metabolism. However, poor SNR and spectral resolution can limit accurate data analysis. In this study, the denoising step revealed low concentration metabolites in the normal rat brain including [2-13C] lactate and [2-13C] acetoacetate, which were not clearly visible before denoising. This allowed for improved metabolic kinetic information. Furthermore, although the LCModel software is optimized to proton spectroscopy, this study also showed that LCModel can be used to quantify 13C metabolites with modifications of the chemical shift of the fitting models and the control parameters. This pipeline can help rapidly analyze in-vivo HP spectra, especially as the field moves beyond HP [1-13C] pyruvate.Acknowledgements
Work supported by NIH R01CA172845, NIH R01CA197254, UCSF LOGLIO collective, NICO project, and P41EB013598.References
[1] Henry, E.R. and Hofrichter, J., 1992. [8] Singular value decomposition: Application to analysis of experimental data. In Methods in enzymology (Vol. 210, pp. 129-192). Academic Press.
[2] Provencher, S.W., 1993. Estimation of metabolite concentrations from localized in vivo proton NMR spectra. Magnetic resonance in medicine, 30(6), pp.672-679.
[3] Provencher, S.W., 2001. Automatic quantitation of localized in vivo 1H spectra with LCModel. NMR in Biomedicine: An International Journal Devoted to the Development and Application of Magnetic Resonance In Vivo, 14(4), pp.260-264.
Figures