3036
Development of Computational Methods for B1-Corrected Hyperpolarized 13C MRI Human Studies
Philip M Lee1, Hsin-Yu Chen2, Jeremy W Gordon2, Peder EZ Larson2, Mark Van Criekinge2, Michael A Ohliger2, Duan Xu2, John Kurhanewicz2, Robert A Bok2, Rahul Aggarwal3, Pamela N Munster3, and Daniel B Vigneron2
1Department of Radiology & Biomedical Imaging, University of California, San Francisco, Berkeley, CA, United States, 2Department of Radiology & Biomedical Imaging, University of California, San Francisco, San Francisco, CA, United States, 3Department of Medicine, University of California, San Francisco, San Francisco, CA, United States
1Department of Radiology & Biomedical Imaging, University of California, San Francisco, Berkeley, CA, United States, 2Department of Radiology & Biomedical Imaging, University of California, San Francisco, San Francisco, CA, United States, 3Department of Medicine, University of California, San Francisco, San Francisco, CA, United States
Synopsis
The inhomogeneous B1 excitation profile of 13C surface transmit/receive coils results in a decreasing gradient of flip angles for voxels increasingly farther away from the coil. For accurately quantifying the pyruvate to lactate conversion rate (kPL), the flip angle needs to be corrected based on the B1 excitation profile. A voxel-wise B1 excitation field correction method for hyperpolarized 13C MRSI scans of human patients was developed and applied, yielding an improved quantitative accuracy of kPL values in metastatic cancer patients. The corrected kPL estimations agree with simulations where over-flip leads to an underestimation of kPL, whereas under-flip leads to overestimation.
Introduction
Hyperpolarized (HP) 13C MR spectroscopic imaging (MRSI) enables quantitative monitoring of enzyme-catalyzed metabolism in human subjects. Using HP [1-13C]pyruvate, the rate of conversion of pyruvate to lactate (kPL) via lactate dehydrogenase (LDH) can be computed per voxel in patients. However, 13C surface transmit/receive (T/R) coils do not have a homogeneous B1 excitation profile, resulting in a gradient of decreasing flip angles for voxels increasingly farther away from the coil. Using the double angle method,1 the coil’s excitation profile was measured and a contour plot mapping this gradient was computed and is shown in Figure 1 on top of a T1-weighted phantom scan. The adjacent color bar indicates the scaling factor relative to the nominal flip angle. Tissue in the immediate proximity of the coil element is over-flipped by 200%. As the flip angle is provided as a parameter in the kinetic model used for estimating kPL, the nominal flip angles require correction based on the coil’s B1 excitation profile. The goal of this project was to develop and test a novel computational framework to improve kPL accuracy using B1 excitation correction in human studies.Methods and Results
Data from three patient scans are summarized in Figure 2, with a representative case shown in Figure 3. The liver metastases were from the primary cancer origins listed in Figure 2. For each scan, we acquired an axial T1-weighted spoiled gradient-echo (LAVA) anatomical reference, as shown in Figure 3(a), with the target lesion highlighted. In each scan, the 13C T/R coil was placed on the patient’s abdomen on the side closest to the target lesion to ensure coverage by the coil’s T/R field. 13C-pyruvate and 13C-lactate signals were acquired with a 2D echoplanar spectroscopic imaging (EPSI) sequence over 1 minute with a temporal resolution of 3 seconds and a spatial resolution of 1.2 cm in-plane. A constant flip angle scheme of 10° for pyruvate and 20° for lactate was implemented.In MATLAB, the spectral data were quantified after zero- and first- order phase corrections. An SNR filter using pyruvate and lactate signals summed over time with an empirically-determined threshold was applied to remove noise voxels. Similarly, voxels outside of the coil’s sensitive region were excluded. The excitation profile of the 13C T/R coil was previously measured from a phantom scan using the double angle method.1 Vitamin E capsules within the coil, which served as fiducial markers, were visible in the background T1-weighted scan and are highlighted by yellow dots. Using the T1-weighted references acquired during the patient scan, the previously measured excitation profile was rotated and translated in MATLAB to match the coil position during the patient scan as shown in Figure 3(b). As before, the adjacent color bar indicates the scaling factor relative to the nominal flip angle for each voxel. The resolution of the excitation profile was down-sampled to the coarser resolution of the 13C images using nearest-neighbor interpolation. This allowed for a voxel-by-voxel scaling of the nominal flip angles for pyruvate and lactate to reflect the excitation profile.
The kPL values for each voxel were then computed using an inputless two-site model to generate kPL maps.2 The kPL maps before and after the flip angle correction for an over-flipped tumor voxel are shown in Figure 3(c). The kPL maps before and after the flip angle correction for an under-flipped tumor voxel are shown in Figure 3(d). The kPL values for selected voxels are also summarized in Figure 2 along with the percent difference.
Discussion
The figure-8 coil provided adequate transmit power over the metastases despite the B1 inhomogeneity. Monte Carlo simulations for the inputless two-site model demonstrated an inverse relationship between the relative B1 error and the fractional kPL error (defined as $$$\frac{k_{PL,fit}}{k_{PL,truth}} - 1$$$) as shown in Figure 4.2 Positive errors in B1 resulted in underestimations of kPL and negative errors resulted in overestimations. In this study, over-flip led to an underestimation of kPL (e.g. a -23.84% underestimation in Scan #3) whereas an under-flip led to overestimation (e.g. a +22.24% overestimation in Scan #3), which agree with prior simulations. The B1 correction methods developed in this study can improve the quantitative accuracy of HP 13C metabolic MRI in cancer patients. As this method retroactively uses a phantom-derived B1 excitation profile, in future studies, we plan to utilize an integrated fast B1-mapping scheme for patient HP 13C-pyruvate MRI.3 This would allow for real-time power calibration that ensures the tissue of interest receives the prescribed flip angle. Nevertheless, due to the inherently inhomogeneous excitation profile of the surface coil, the method developed here would allow for improved kPL estimations in regions outside of the tissue of interest which are over- and under-flipped or when there are multiple lesions of interest.Acknowledgements
This work was supported by NIH grants U01 EB026412, R01 CA183071, and P41 EB013598.References
- Cunningham CH et al. Saturated double‐angle method for rapid B1+ mapping. Magn Reson Med. 2006;55:1326-1333.
- Larson PEZ et al. Investigation of analysis methods for hyperpolarized 13C-pyruvate metabolic MRI in prostate cancer patients. NMR in Biomedicine. 2018;31:e3997.
- Tang S et al. A regional bolus tracking and real-time B1 calibration method for hyperpolarized 13C MRI. Magn Reson Med. 2018;81(2):839-51.
Figures
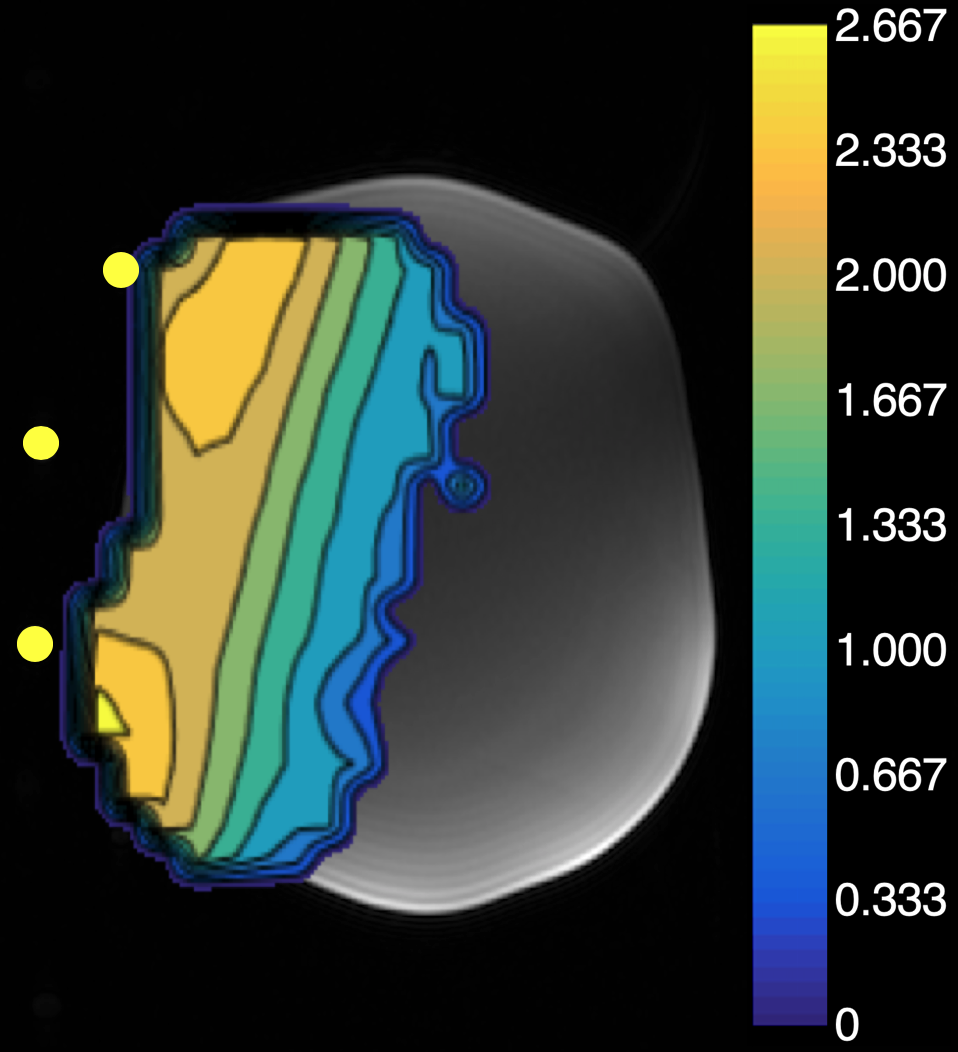
Figure 1. Using the double angle method, the coil’s excitation profile was measured and a contour map was computed to show the inhomogeneity of the excitation profile of the 13C T/R coil. The color bar indicates the scaling factor relative to the nominal flip angle. In the immediate proximity to the coil, regions of tissue are over-flipped by 200%. Fiducial markers embedded within the coil were visible on the background T1-weighted scan and are highlighted by yellow dots.
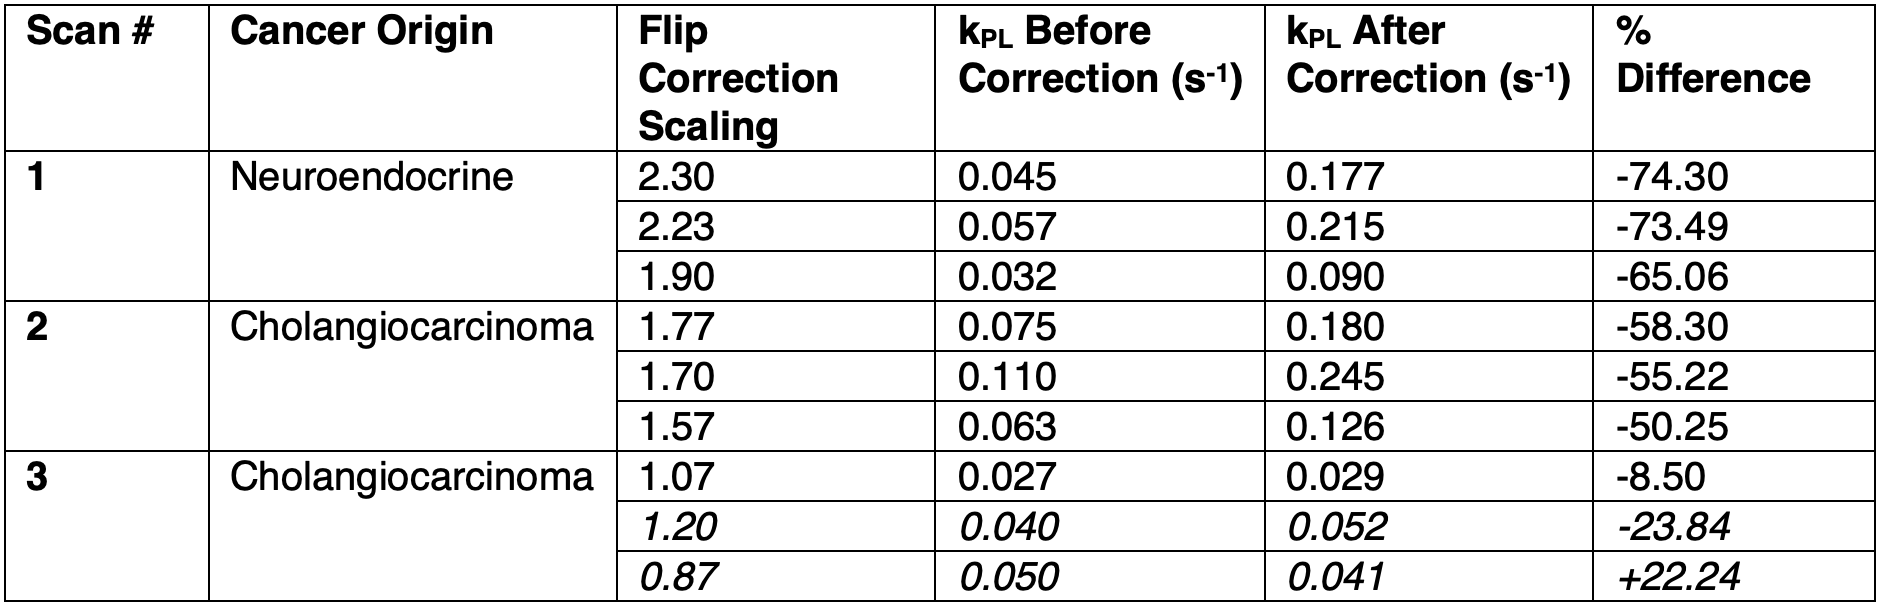
Figure 2. Selected voxels with their specific flip correction scaling factors and their estimated kPL values before and after the correction. A voxel with a scaling factor above 1.00 was over-flipped, that is, it experienced a flip greater than the nominal flip angle. Hence, the upscaled flip angle should be used in the kPL kinetic model. Voxels that are highlighted in the latter figure are italicized.
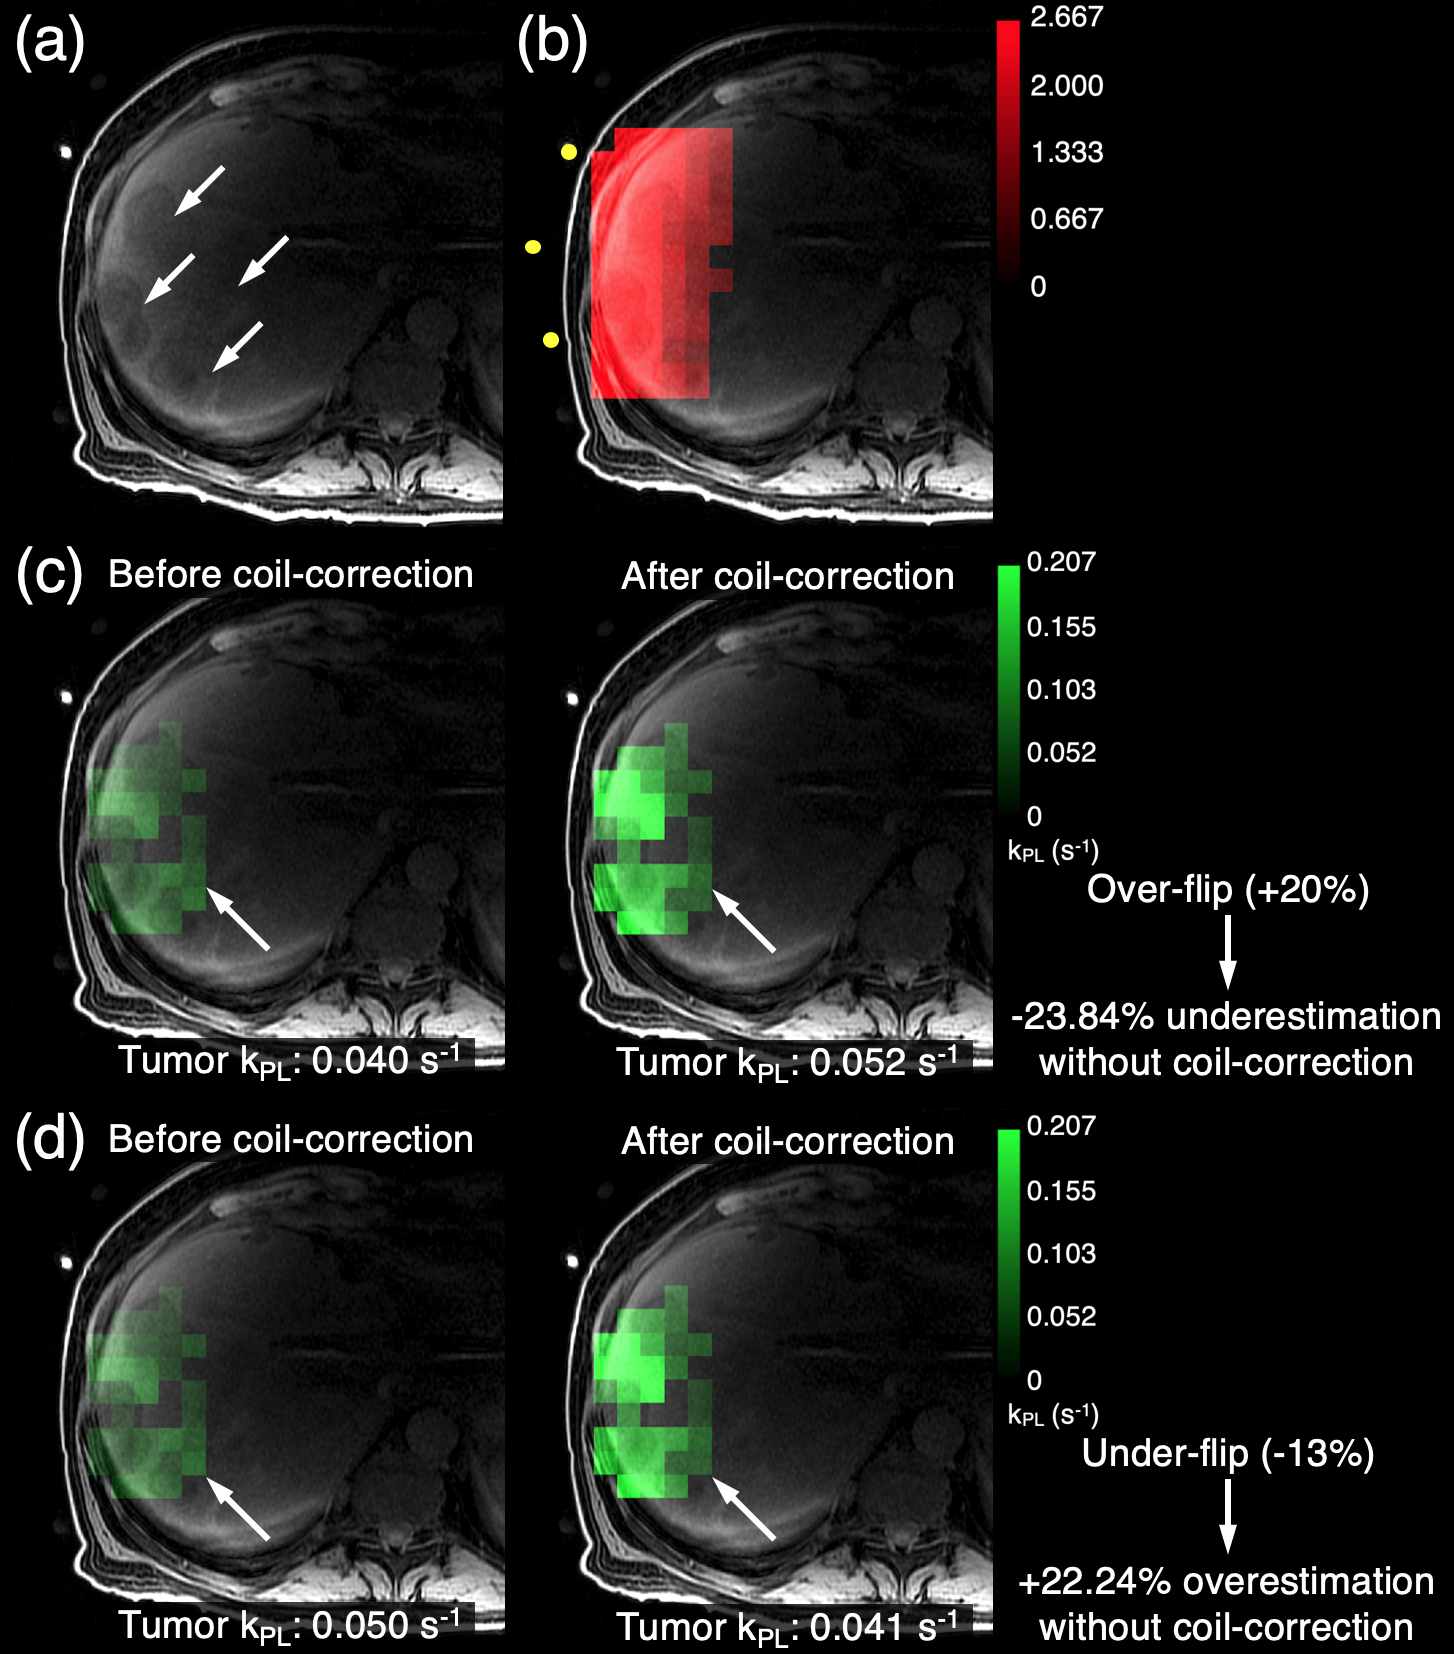
Figure 3. Scan #3 is shown in this figure. (a) An axial T1-weighted spoiled gradient-echo (LAVA) image with the target cancer lesions highlighted. (b) The excitation profile of the 13C T/R coil. (c) kPL values before and after the flip angle correction for an over-flipped tumor voxel. (d) kPL values before and after the flip angle correction for an under-flipped tumor voxel.
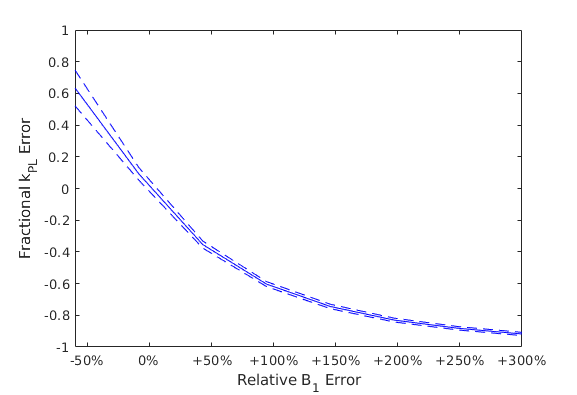
Figure 4. Monte Carlo simulations of the inputless two-site model demonstrated an inverse relationship between the relative B1 error and the fractional kPL error. The accuracy is given by the solid line, which plots the average fit across the simulation, and the variance is given by dashed lines, which plot ±1 standard deviation in the simulation fits. Positive errors in B1 resulted in underestimations of kPL and negative errors resulted in overestimations.