3034
Hyperpolarized 13C MR imaging of metastatic prostate cancer murine models1Department of Radiology and Biomedical Imaging, University of California, San Francisco, San Francisco, CA, United States, 22Division of Hematology/Oncology, Department of Medicine, University of California, San Francisco, San Francisco, CA, United States
Synopsis
The study of prostate patient derived xenografts in kidney, bone and liver demonstrated the impact of microenvironment on metabolic characteristics of the metastatic prostate cancer and how it differs with respect to the host organ’s characteristics. Hyperpolarized 13C MRI was able to identify the modifications in the pyruvate metabolism between the kidney, bone and liver tumors before and after therapeutic intervention. This study demonstrates that Hyperpolarized 13C MRI can be used to monitor the real time changes in metabolic profile of prostate cancer and its metastases.
Purpose
An organ’s microenvironment plays a critical role in establishing itself as a preferred site for seeding of migrating tumor cells and contributes towards tumor progression and response to therapy1,2. Bone, lymph nodes and liver are common sites for prostate cancer (PCa) metastasis with bone found in approximately 90% of the patients with castration-resistant prostate cancer (CRPC)3. Patients with PCa metastases in the liver have a particularly poor prognosis4 and recent clinical trial data showed that patients with CRPC and liver metastases benefitted from second-generation antiandrogens and docetaxel chemotherapy but not from immunotherapy in contrast to men with bone metastasis5. These findings highlight the current gap in knowledge of the mechanistic underpinnings that could involve intrinsic factors to the tumor cell, the tumor microenvironment, and/or systemic factors, which will be critical in evaluating PCa diagnosis and treatment response of metastatic PCa. Neuroendocrine prostate cancer (NEPC) is a lethal subtype of mCRPC with poor survival and limited treatment options6,7. Hyperpolarized 13C MRI is a valuable technique for dynamic, real-time and non-invasive evaluation of metabolism in-vivo8. In this study, we analyzed the underlying differences in metabolism of neuroendocrine tumor models grown in three different sites.Methods
NEPC tumor grafts were established in the renal capsule, bone and liver capsule using LuCaP939 and LTL61010 PDXs (patient-derived xenografts), developed at the University of Washington and Vancouver Prostate Center respectively. All procedures were approved by our IACUC. Tumor sections were implanted under the renal capsule using standard procedures11. Isolated tumor cells were isolated and injected into tibiae and liver (2×10⁵ in 20μL) as previously documented12. All the tumor models underwent baseline imaging on a Bruker 3T scanner with dual tuned 1H/13C volume coil. The mice were treated with 60mgs/kg carboplatin and imaged after one week. T2-weighted proton imaging was used for tumor localization and co-registration of carbon imaging and tumor volume estimation as before. Diffusion-weighted sequence was used to generate ADC maps via Bruker Paravision software. Hyperpolarization was performed using a 3.35T dynamic nuclear polarizer. 80mM [1-13C] pyruvate-13C urea were copolarized as before11 and upon dissolution injected into the mice over 12s. Dynamic 13C spectra was acquired using a 2D CSI with spiral encoding, 12s after the start of the HP injection with a temporal resolution of 4.25s with 15 time-points and a flip-angle of 10°. Images were acquired with 32 x 32 mm FOV, 8 x 8 matrix and slice-thickness 8 mm. Metabolite maps were obtained via SIVIC13 and analyzed using MATLAB. Statistical analysis was conducted via t-tests. kPL, the apparent rate of enzymatic conversion of HP pyruvate to lactate, was calculated as described previously14.Results
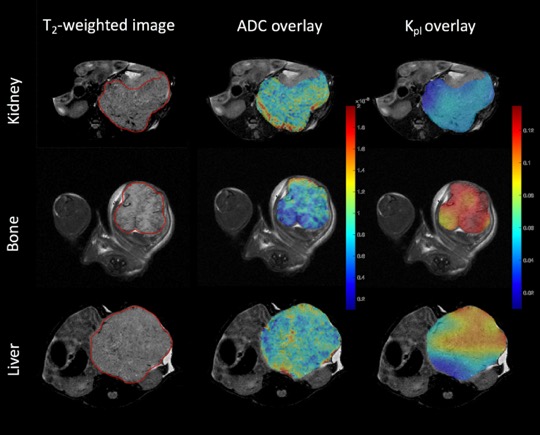
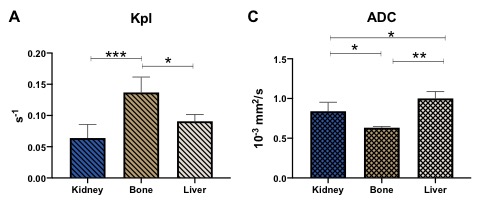
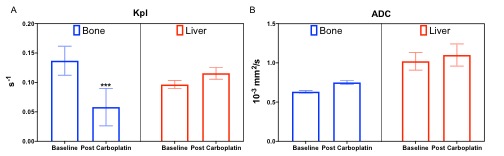
The T2-weighted images (Fig.1 left column) were used to visualize the tumor (outlined in red) with a tumor volume of 2±0.8, 2.4±0.4, 1.7±0.8 cc in the kidney, liver and bone respectively. The middle column of Fig.1 shows the ADC overlaid on T2-weighted images. The mean kidney tumors (n=9, LuCap93=6, LTL610=3) had significantly higher ADC of 0.83±0.11 x10⁻³ mm2/s as compared to bone tumors 0.63±0.01 x10⁻³ mm2/s (n=3, LuCap93=1, LTL610=2) but significantly lower as compared to the liver tumors 1.0±0.08 x10⁻³ mm2/s (n=3, LuCap93=3) (p<0.05) as shown in Fig2C. The bone tumors also had significantly lower ADC as compared to the liver tumors (p<0.01). The pyruvate-to-lactate conversion rate, kPL of kidney was 0.06± 0.02, of bone was 0.14±0.024 and for liver was 0.09±0.01. Bone tumors had significantly higher kPL compared to the kidney tumors (p<0.001) as well as liver tumors (p<0.05). We also investigated the response of bone and liver tumors to carboplatin treatment. Tumor volumes post carboplatin for liver increased by 56% (3.75±0.02 cc) and for bone by 17% (1.99 cc). Bone tumors had a significant decrease (41%) in kPL to 0.058±0.03 from baseline, while liver kPL increased (not significantly) to 0.11±0.01 (fig 3B) after carboplatin treatment. The ADC values for bone and liver post carboplatin increased (although not significant) were 0.75±0.02 x10⁻³ mm2/s and 1.1±0.14 x10⁻³ mm2/s respectively (fig 3C).Discussion and conclusion
ADC maps show that bone tumors had significantly higher cellularity compared to kidney and liver tumors. Liver tumors exhibited significantly higher ADC values which indicates lower cellularity as compared to bone and kidney tumors. kPL indicate that bone tumors are highly metabolic compared to kidney and liver tumors. kPL of bone tumors could partly be attributed to increased cellularity or contamination of the muscle cells (due to the infiltrative tumor) which are naturally higher in LDHA. Ongoing biochemical and immunohistochemical assays will further inform on mechanism behind the higher kPL of bone tumors. Significant decrease in kPL of bone tumors post-treatment indicate response to carboplatin and are currently being evaluated by protracted follow up on tumor volume. In contrast, the NEPC liver tumors shows a slight increase alluding to a differential impact on treatment owing to the tumor microenvironment. We will investigate the molecular and metabolic mechanisms responsible for the differential response to chemotherapy of the NEPC tumors as result of the tumor site. Since clinical assessment of treatment response in metastases via RECIST criteria is difficult15, non-invasive hyperpolarized 13C MR has the potential to provide early metabolic readout of the metastatic tumors and aid in monitoring therapeutic efficacy.Acknowledgements
This study was funded by the following grants: NIH P41EB013598, UCSF Prostate Cancer Pilot Award, DoD PCRP PC160630 (Idea Development Award, NIH R01 CA215694.References
1) Ganguly, Sourik S et al. “The host microenvironment influences prostate cancer invasion, systemic spread, bone colonization, and osteoblastic metastasis.” Frontiers in oncology 4 364. 15 Dec. (2014), doi:10.3389/fonc.2014.00364
2) Mussawy, H., Viezens, L., Schroeder, M. et al. The bone microenvironment promotes tumor growth and tissue perfusion compared with striated muscle in a preclinical model of prostate cancer in vivo. BMC Cancer 18, 979 (2018) doi:10.1186/s12885-018-4905-5
3) Body, J. J., Casimiro, S. & Costa, L. Targeting bone metastases in prostate cancer: improving clinical outcome. Nat. Rev. U rol. 12, 340–356 (2015).
4)Singh, A. et al. Liver Metastases in Prostate Carcinoma Represent a Relatively Aggressive Subtype Refractory to Hormonal Therapy and Short-Duration Response to Docetaxel Monotherapy. World Journal of Oncology 6, 265–269 (2015).
5)Drake, C. G. Visceral metastases and prostate cancer treatment: 'die hard,' 'tough neighborhoods,' or 'evil humors'? Oncology (Williston Park, N.Y.) 28, 974–980 (2014).
6) Daniel J. Crona and Young E. Whang. Androgen Receptor-Dependent and -Independent Mechanisms Involved in Prostate Cancer Therapy Resistance. Cancers (Basel). Jun; 9(6): 67. (2017)
7) Aggarwal R, Zhang T, Small EJ, Armstrong AJ. Neuroendocrine prostate cancer: subtypes, biology, and clinical outcomes. J Natl Compr Canc Netw. May;12(5):719-26. (2014)
8) Aparicio, A. M. et al. Platinum-based chemotherapy for variant castrate-resistant prostate cancer. Clin. Cancer Res. 19, 3621–3630 (2013).
9) Kurhanewicz et al. Analysis of cancer metabolism by imaging hyperpolarized nuclei: prospects for translation to clinical research.Neoplasia 13:81-97 (2011)
10) Lam, H.-M., Nguyen, H. M., & Corey, E. Generation of Prostate Cancer Patient-Derived Xenografts to Investigate Mechanisms of Novel Treatments and Treatment Resistance. In Prostate Cancer, Vol. 1786, pp. 1–27. (2018).
11) Sriram, Renuka et al. “Non-Invasive Assessment of Lactate Production and Compartmentalization in Renal Cell Carcinomas Using Hyperpolarized 13C Pyruvate MRI.” Cancers vol. 10,9 313. 5 Sep. (2018), doi:10.3390/cancers10090313
12) Valta, Maija P et al. “Development of a realistic in vivo bone metastasis model of human renal cell carcinoma.” Clinical & experimental metastasis vol. 31,5 (2014): 573-84. doi:10.1007/s10585-014-9651-8
13) Crane, Jason C et al. “SIVIC: Open-Source, Standards-Based Software for DICOM MR Spectroscopy Workflows.” International journal of biomedical imaging vol. 2013 (2013): 169526. doi:10.1155/2013/169526
14) Larson, P. E. Z. et al. Investigation of analysis methods for hyperpolarized 13C-pyruvate metabolic MRI in prostate cancer patients. NMR Biomed. 31, e3997 (2018).
15) Schwartz, L. H. et al. RECIST 1.1—Update and clarification: From the RECIST committee. European Journal of Cancer 62, 132–137 (2016).
Figures