3033
Simulation and Application of a Variable Resolution Hyperpolarized 13C MRI Approach for Improved Quantification of Brain Metabolism1Bioengineering, UC San Francisco, UC Berkeley, San Francisco, CA, United States, 2Radiology and Biomedical Imaging, UC San Francisco, San Francisco, CA, United States
Synopsis
Downstream metabolic products from hyperpolarized pyruvate, such as lactate and bicarbonate, are acquired with coarse resolution for adequate SNR. However, the injected pyruvate exhibits high signal and can be acquired with higher resolution. A simulation framework has been developed to perform multi-resolution acquisitions of hyperpolarized [1-13C]pyruvate, which analyzes SNR and kinetic rate fits for differing resolution schemes. Utilizing the multi-resolution acquisition, lactate and bicarbonate have respective SNR improvement of 3.3-fold and 5.7-fold compared to high resolution images. Kinetic fits for multi-resolution images accurately estimated ground truth values. This simulation framework performed and analyzed variable resolution acquisitions to improve metabolic quantification.
Introduction
Hyperpolarized substrates have been used to non-invasively image metabolism in preclinical1 and clinical research applications2, but SNR is a limiting factor in imaging metabolic products like 13C bicarbonate for [1-13C]pyruvate or TCA metabolites for [2-13C]pyruvate. These metabolic products can exhibit reduced signal due to slow transport, low conversion rates, and short T1 times. Unlike ionizing imaging modalities, SNR scales with voxel volume for MRI but voxel averaging after acquisition only increases SNR by the square root of voxel volume.3 Acquiring at a coarser resolution can increase SNR and improve quantification of hyperpolarized 13C MRI studies. However, acquiring high resolution pyruvate data is important to minimize partial volume effects between vascular and tissue compartments that confound quantification. Independent imaging for metabolites is possible with metabolite-specific imaging, which is implemented with a spectral-spatial pulse and single-shot echo planar readout.4 A multi-resolution acquisition, with higher resolution for pyruvate and coarser resolutions for metabolic products, could improve metabolic quantification by decreasing partial volume effects in pyruvate images and by maintaining adequate SNR for metabolic products. To explore the accuracy of metabolic quantification from multi-resolution versus constant resolution images, a simulation framework to perform and analyze variable resolution acquisitions of [1-13C]pyruvate was developed and investigated in the normal brain.Methods
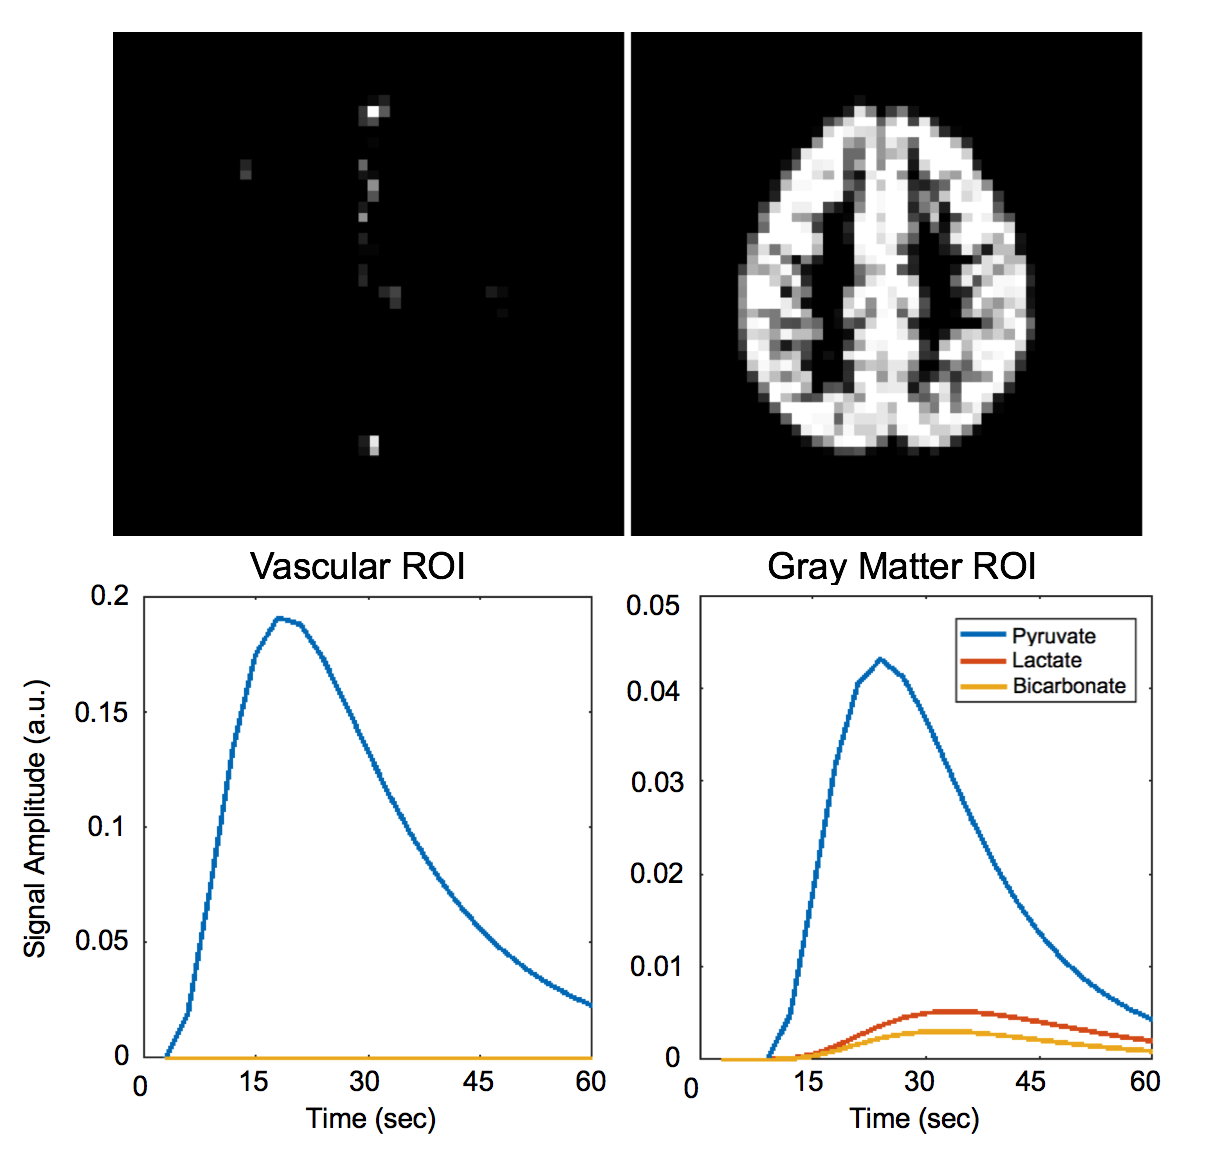
The simulation framework uses functions in the hyperpolarized-mri-toolbox from the LarsonLab GitHub5 to generate metabolite signals and simulate acquisition of a digital phantom. Grey matter and vascular regions of interest (ROIs) in the phantom were extracted from a normal brain model from the BrainWeb Simulated Brain Database6. Conversion of pyruvate to lactate and bicarbonate (kPL = 0.01 s-1, kPB = 0.007 s-1) was mapped to the brain phantom as illustrated in Figure 1. This brain phantom was simulated with a metabolite-selective imaging approach4, using a single-shot echoplanar readout for encoding and a single channel coil for receive. Noise levels and conversion rates were determined based on prior studies in healthy brains. The first experiment acquired data at 5 x 5 mm2 constant in-plane resolution, the second experiment acquired data at 15 x 15 mm2 constant in-plane resolution, and the third experiment acquired data at variable resolutions (5 x 5 mm2 for pyruvate, 10 × 10 mm2 for lactate, 15 × 15 mm2 for bicarbonate). For analysis, SNR gain, area under the curve (AUC) ratios, and kinetic rates were estimated.Results
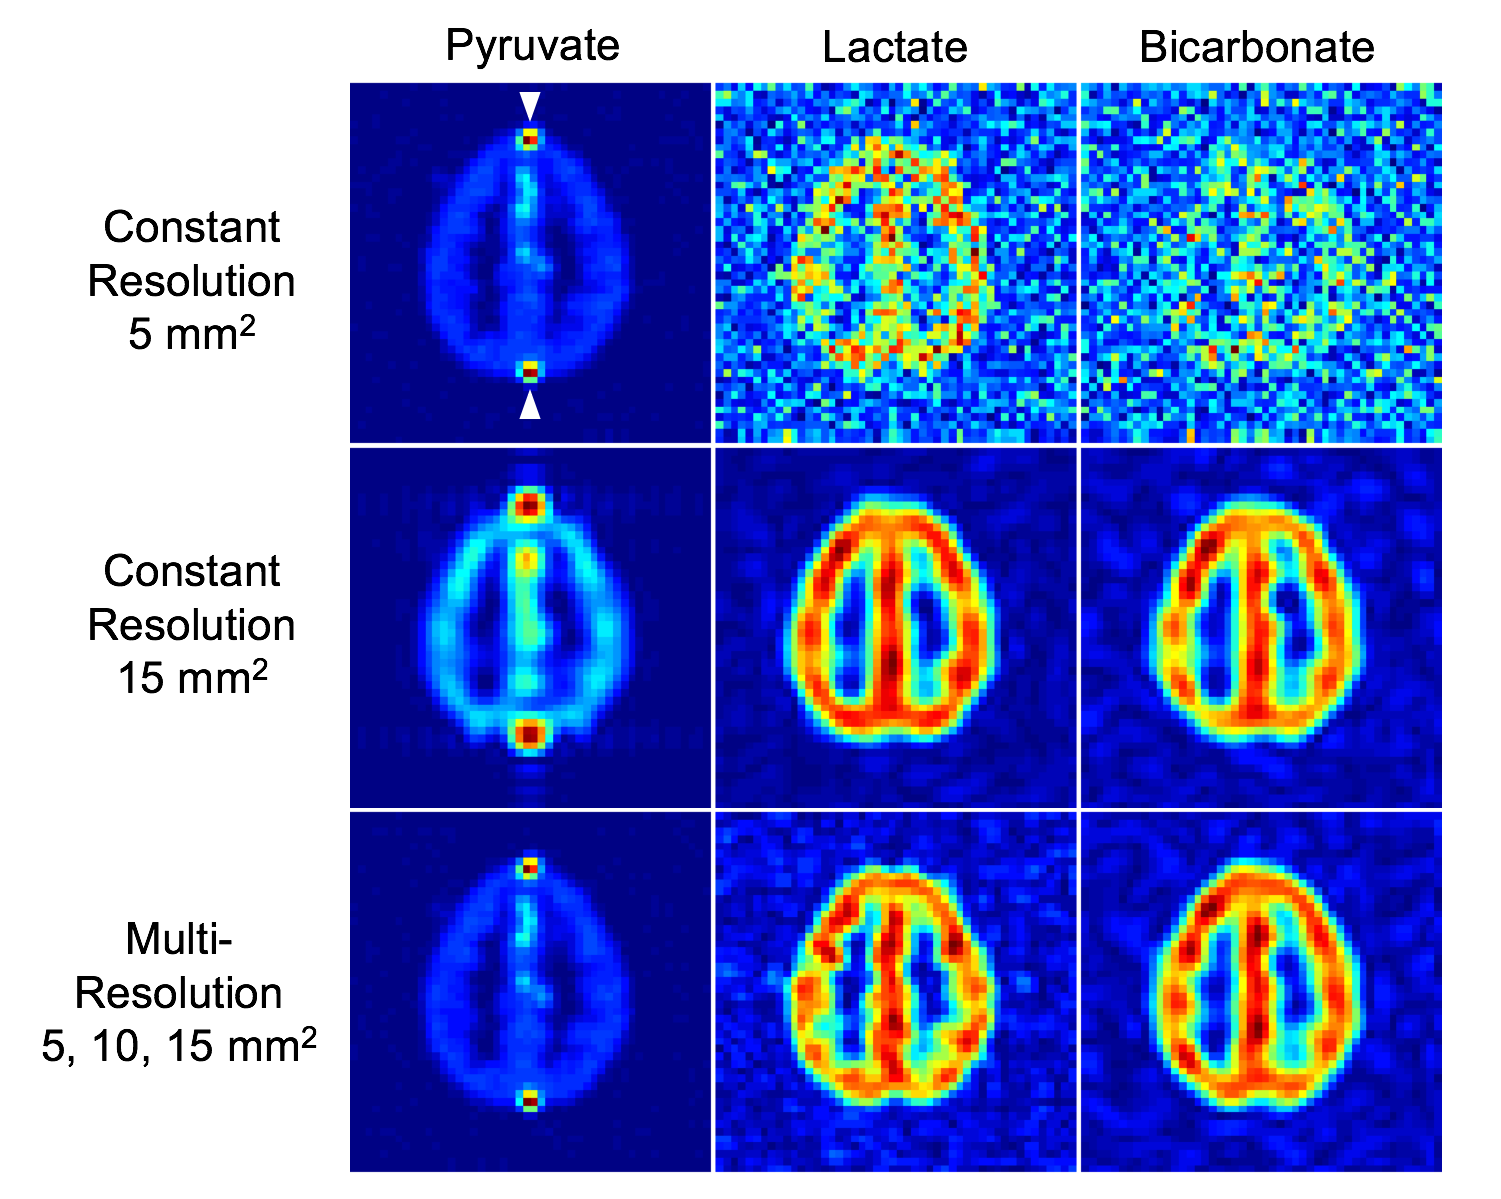
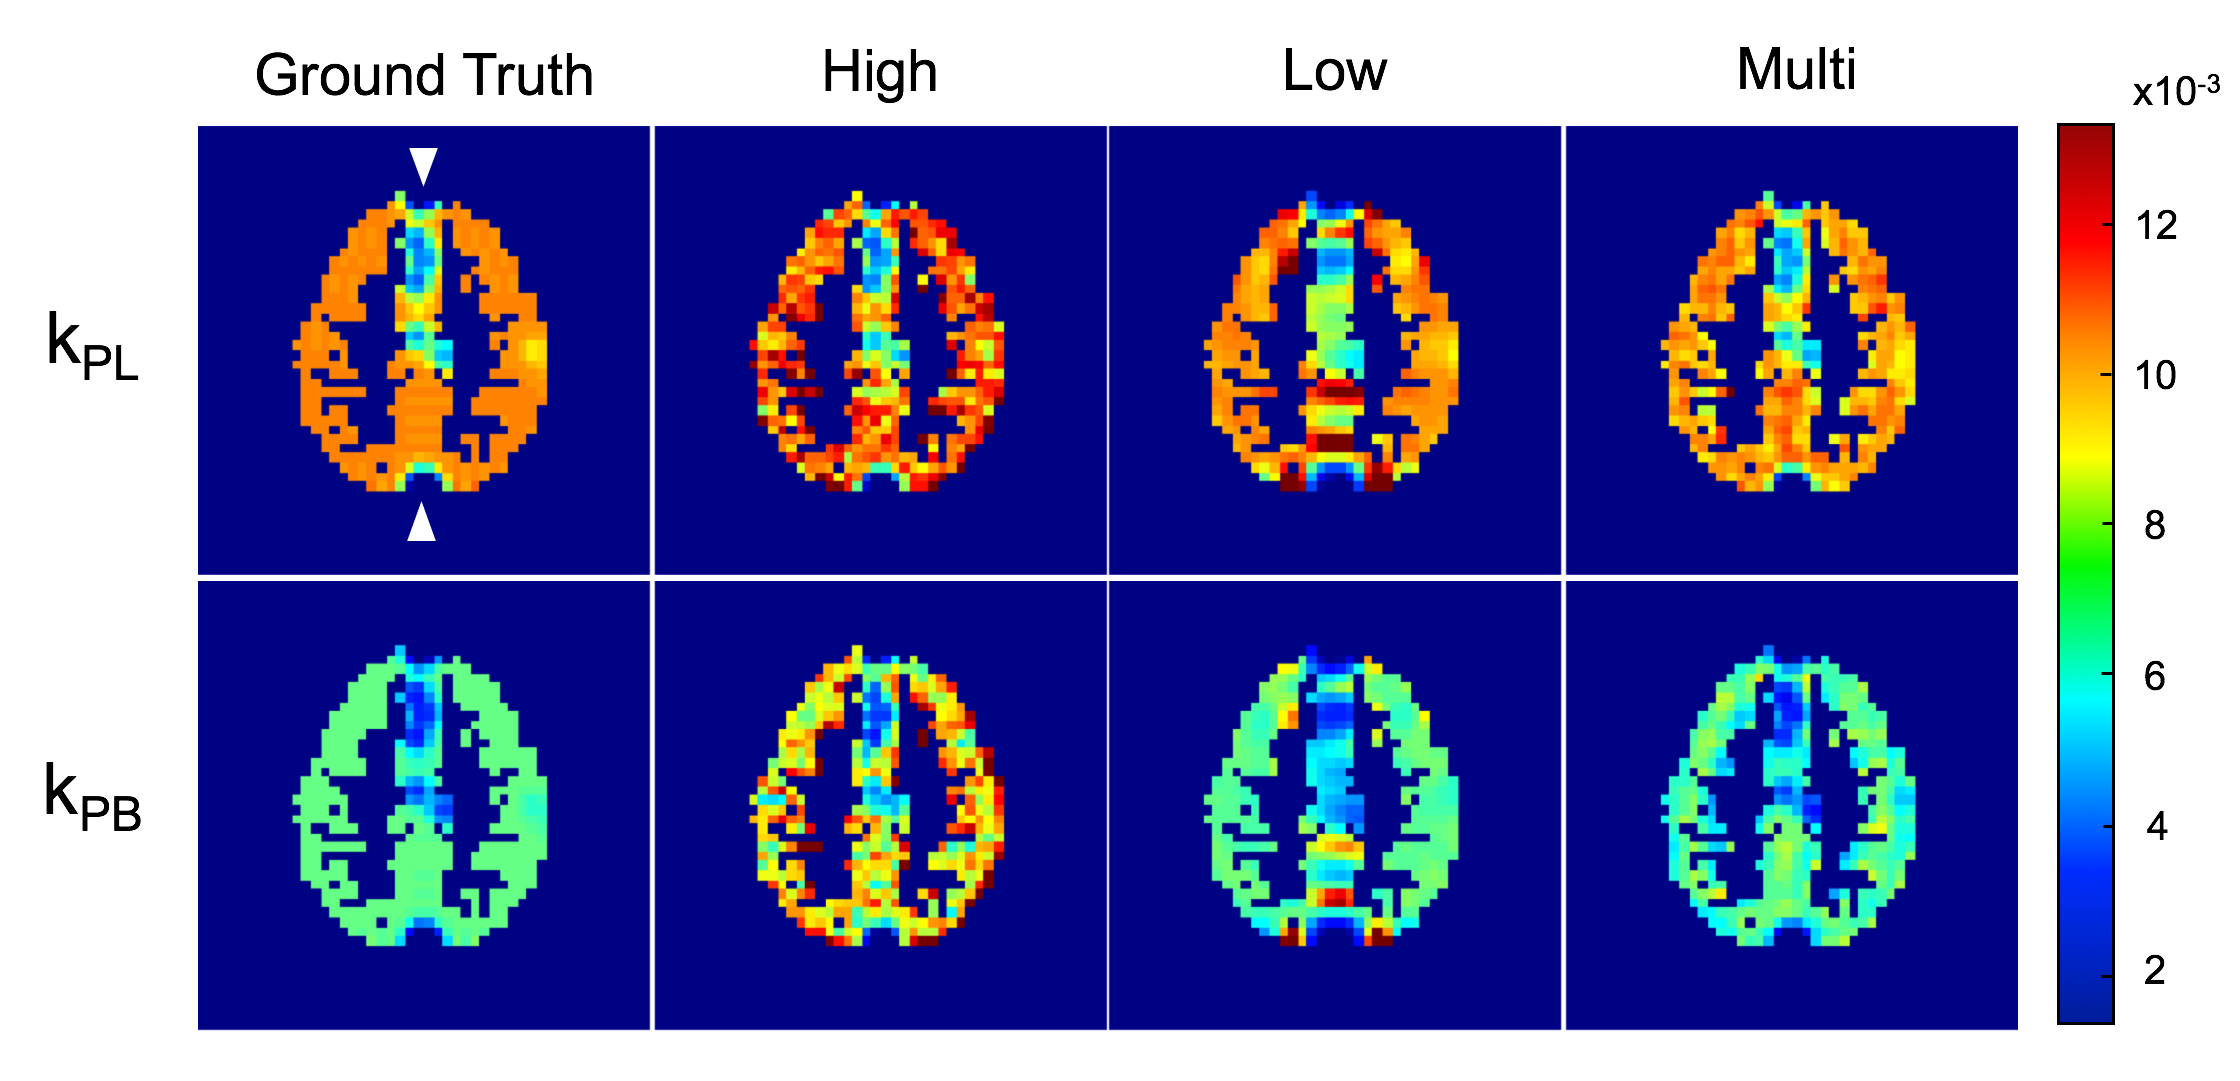
The benefits of the multi-resolution approach can be seen in the single timepoint of pyruvate to lactate and bicarbonate metabolism in Figure 2. High pyruvate signal intensity in the vascular ROIs leads to ringing artifacts and partial volume effects in the constant low resolution (15 × 15 mm2) pyruvate image. Lactate and bicarbonate multi-resolution images exhibited improved mean SNR by 3.3-fold and 5.7-fold in comparison to the constant high resolution (5 × 5 mm2) images. With these SNR gains, kinetic rates calculated from multi-resolution images accurately estimated the ground truth values for both lactate and bicarbonate as seen in Figure 3. The high resolution kinetic rates are overestimated due to non-zero mean noise in the low SNR images. The vascular ROIs, with high pyruvate signal and no conversion to other metabolites, contribute to partial volume effects and ringing artifacts in the low resolution maps. The AUC ratios exhibited similar results, with overestimation for high resolution signals due to the non-zero mean noise in the magnitude images and a high noise floor that exceeded the bicarbonate signal level.Discussion and Conclusion
Utilizing coarser spatial resolution for low SNR metabolites such as lactate and bicarbonate enables more accurate quantification that would otherwise be affected by high noise levels. The SNR gains from acquiring at coarser resolution were lower than theoretical gains, which is likely due to both the low SNR of the high resolution images used for comparison and also to partial volume effects in coarser resolution images. On the other hand, using higher spatial resolution for the injected substrate minimizes partial volume effects from vascular signals, particularly ringing artifacts that result from the combination of sharp transitions in signal amplitude around vessels and coarse spatial resolution. A multi-resolution approach combines the benefits of coarse and high resolution acquisitions while mitigating effects from partial volumes and low magnitude metabolite signals. But the partial volume effects of vascular pyruvate are still not clear, as clinical data suggests that the majority of the pyruvate signal is in the vessels. Vascular pyruvate could have a large impact on the quantification of metabolite signal in nearby voxels since the typical resolution for hyperpolarized acquisitions is much larger than blood vessel diameters. Separating out the vascular pyruvate signal could also allow calculation of pyruvate perfusion, which would be a valuable input to kinetic modeling and to our understanding of hyperpolarized pyruvate dynamics in the human body. Ongoing work includes using MR angiography segmentations and simulated phantoms to separate out the vascular pyruvate signal for calculation of pyruvate perfusion in human studies. This simulation framework enables quantitative analysis of different resolution schemes for future hyperpolarized [1-13C]pyruvate studies, such that the acquisition for eventual clinical studies can maximize metabolite SNR and allow for accurate quantification.Acknowledgements
This research was supported by NIH grants U01EB026412 and P41EB013598.References
- Golman K, Thaning M. Real-time metabolic imaging. Proceedings of the National Academy of Sciences. 2006 Jul 25;103(30):11270-5.
- Nelson SJ, Kurhanewicz J, Vigneron DB, Larson PE, Harzstark AL, Ferrone M, Van Criekinge M, Chang JW, Bok R, Park I, Reed G. Metabolic imaging of patients with prostate cancer using hyperpolarized [1-13C] pyruvate. Science translational medicine. 2013 Aug 14;5(198):198ra108-.
- Edelstein WA, Glover GH, Hardy CJ, Redington RW. The intrinsic signal‐to‐noise ratio in NMR imaging. Magnetic resonance in medicine. 1986 Aug;3(4):604-18.
- Gordon JW, Milshteyn E, Vigneron Daniel B, Larson Peder EZ. Variable Resolution Echo-Planar Imaging for Improved Quantification of Hyperpolarized 13C Metabolism. In Proceedings of the 26th Annual Meeting of ISMRM, Paris, France, 2018 Abstract 3053.
- LarsonLab Github. https://github.com/LarsonLab/hyperpolarized-mri-toolbox. Accessed October 31, 2019.
- BrainWeb Simulated Database. https://brainweb.bic.mni.mcgill.ca/brainweb/. Accessed October 15, 2019.
Figures