3027
Fast 3D hyperpolarized 13C metabolic MRI at 7 T using spectrally selective bSSFP1Nuclear Medicine, Klinikum rechts der Isar, The Technical University of Munich, Munich, Germany, 2Institute of Radiology, Klinikum rechts der Isar, The Technical University of Munich, Munich, Germany, 3Institute for Clinical Chemistry and Pathobiochemistry, Klinikum rechts der Isar, The Technical University of Munich, Munich, Germany, 4TranslaTUM, Center for Translational Cancer Research, The Technical University of Munich, Munich, Germany, 5German Cancer Consortium (DKTK), Heidelberg, Germany, 6German Center for Infection Research (DZIF), Munich, Germany
Synopsis
A fast, spectrally selective 3D bSSFP sequence was developed for preclinical metabolic imaging of hyperpolarized 13C agents at 7 T. High spatiotemporal resolution 3D images of metabolism were produced in healthy mice and in two endogenous models of cancer: pancreatic ductal adenocarcinoma (PDAC) and T-cell lymphoma. Using 900 Hz FHWM pulses, 1.75 mm3 isotropic whole-body images were obtained with a scantime of 1.212 s per image. A significant difference between 3D bSSFP derived AUC ratios in healthy and high-glycolytic-phenotype T-cell lymphoma mice was found, and AUC ratios correlated with PET measurements. Potential tumour heterogeneity was detected in PDAC mice.
Introduction
Metabolic MRI using hyperpolarized (HP) agents requires sequences that can encode in 5 dimensions (1 temporal, 1 spectral, 3 spatial) quickly and efficiently. For MRSI of cancer metabolism using HP pyruvate at 7 T, spectrally selective RF excitations can be used to exploit the sparsity and spacing of the 13C spectrum, allowing much less time to be allocated to spectral encoding, resulting in high spatio-temporal resolution images. The bSSFP sequence lends itself well to this approach1-3 because it is fast and its usage of HP magnetisation is efficient, making even 3D dynamic imaging possible. This work establishes a fast, high resolution spectrally selective 3D bSSFP sequence for preclinical metabolic imaging studies at 7 T.Methods
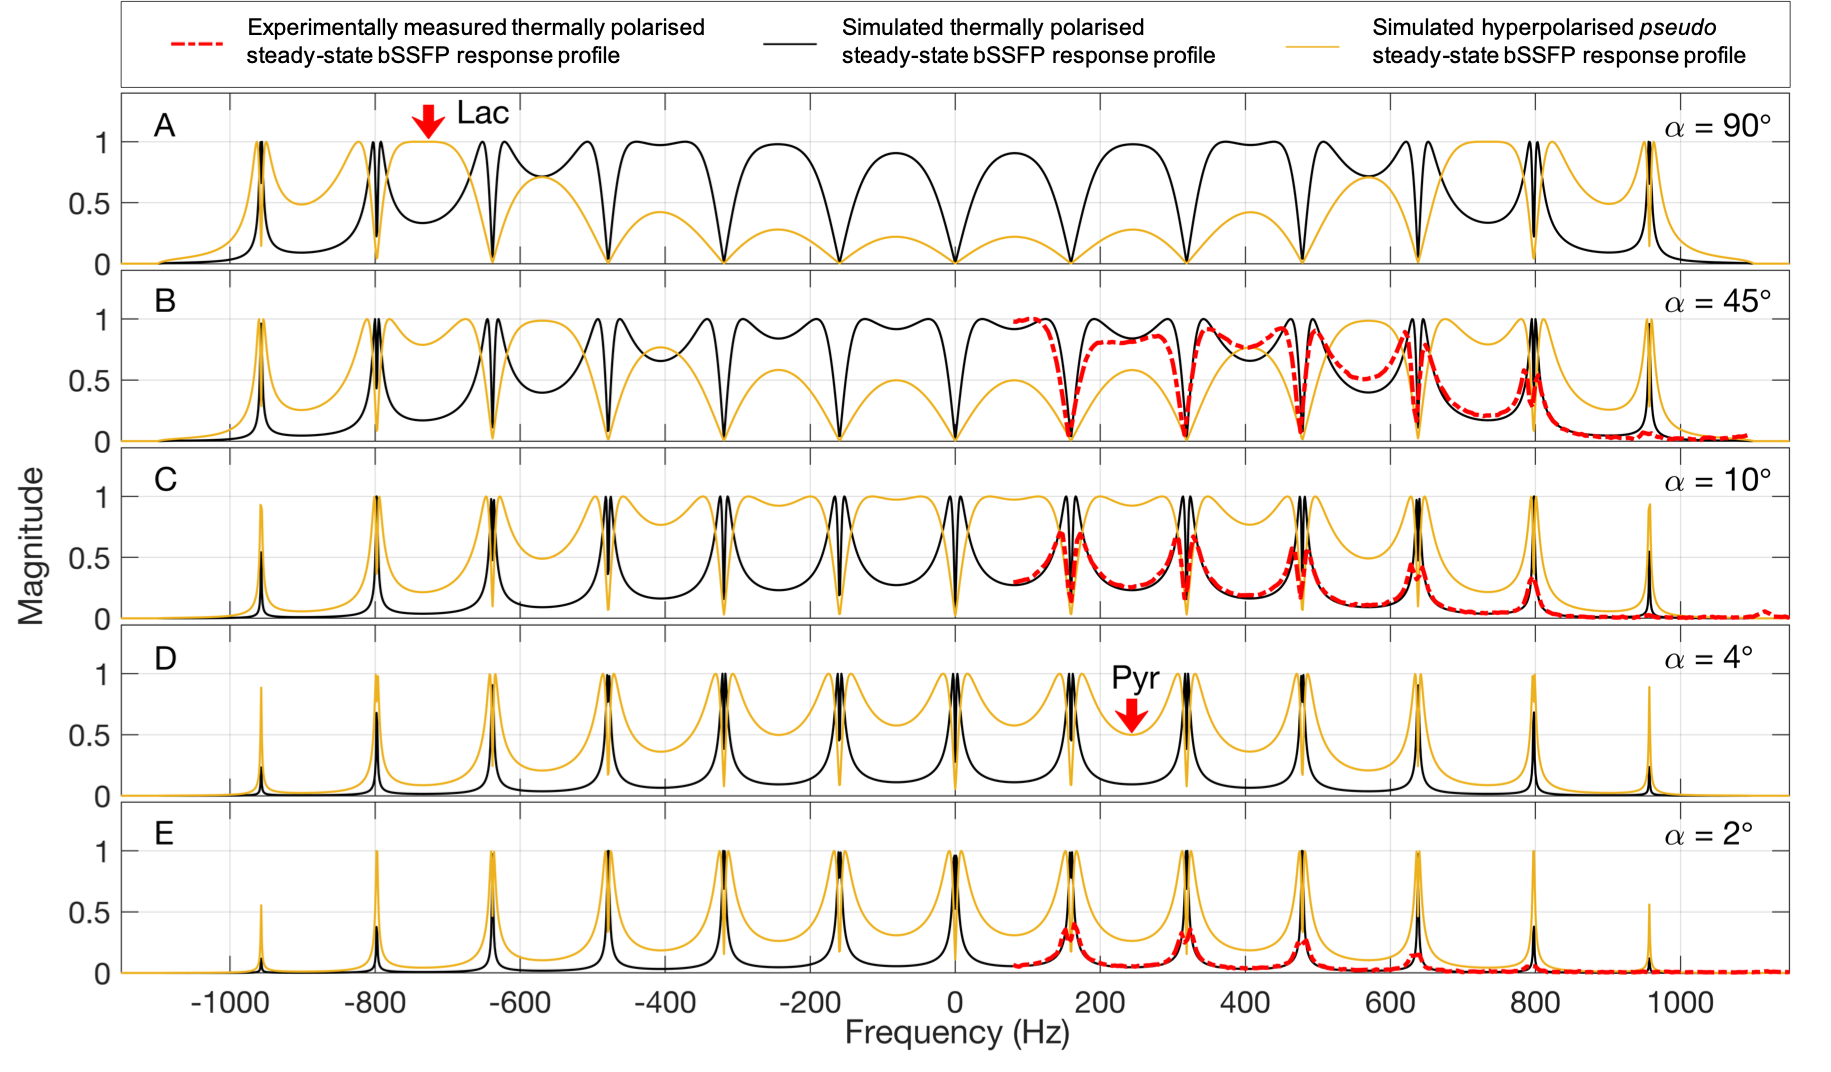
A 3D bSSFP sequence with α/2, TR/2 preparation pulse was modified: slice select and rephasing gradients were removed; alternating B1 frequency and B1 power capabilities (α) were added, permitting the use of spectrally selective excitations with (constant) alternating flip angles; RF phase was made constant.Bloch simulations of bSSFP steadystate response profiles for multiple flip angles were performed for 900 Hz FWHM sinc pulses at TR = 6.29 ms (Fig. 1) and 400 Hz FWHM sinc pulses at TR = 11.27 ms (not shown). For corresponding validation measurements (Fig. 1), a DOTA doped (0.5 mM) 4.4 M 13C lactate phantom was used. The phantom T1 and T2 values were measured using the FAIR-RARE and CPMG sequences. To simulate the HP pseudo steadystate, the same simulation was repeated with estimated HP T1 and T2 values (30 s, 350 ms).
A small animal 7 T MRI (Agilent/GE magnet, Bruker AVANCE III HD electronics), with a 31 mm ID 13C/1H dual tuned volume coil (RAPID) were used for all MR measurements. In vivo MRSI was performed in 9 T-cell lymphoma4 mice with either a high (HGP) or low (LGP) glycolytic phenotype, 6 pancreatic (PDAC) tumour bearing mice,5 and 12 healthy mice. T2w 1H RARE images were used for co-registration and identification of tumours and spleens.
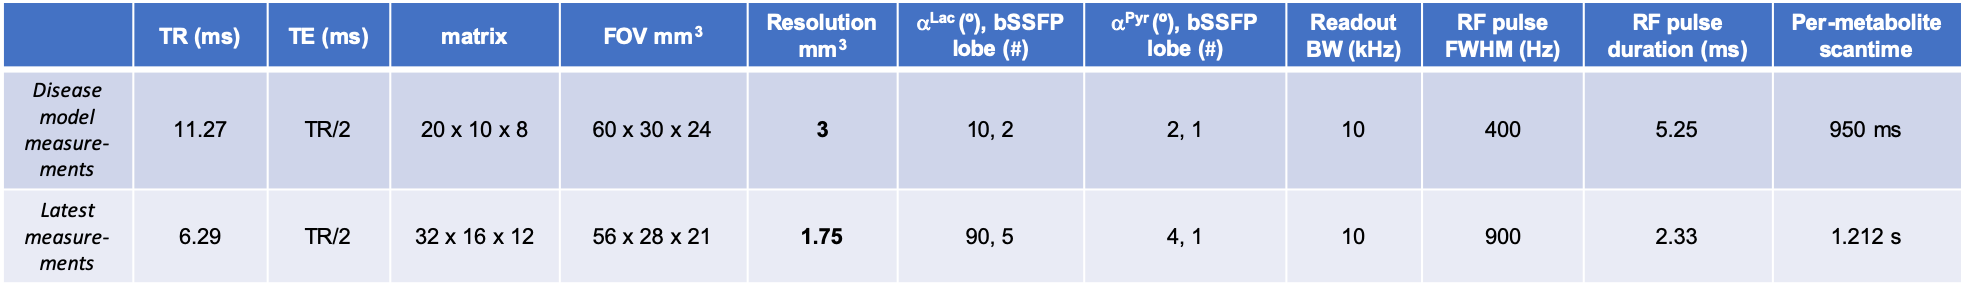
For 13C MRSI, a thermally polarized 1-13C lactate phantom (5 mL, 4.4 M) was used to calibrate 13C RF power and set the lactate and pyruvate bSSFP acquisition frequencies. B0 maps were acquired for shim calculations. 3D bSSFP images were acquired sequentially with alternating B1 frequency and α. Partial Fourier (acceleration = 1.5) was applied in the 1st phase encode direction. See Fig. 2. For imaging parameters.
Hyperpolarisation: 200 mM [1-13C]pyruvic acid and 15 mM OX063 trityl radical was polarized in a HyperSense polarizer (microwave freq. = 94.188 GHz, 100 mW power). The sample was dissolved with ~4 mL of a dissolution buffer (80 mM NaOH, 80 mM Tris, physiological pH) at 185 °C (pressure, 10 bar). 250 µl of this solution (80 mM of HP pyruvate) was injected into the tail veins of the mice. In addition to MRSI, PDAC and T-cell lymphoma animals underwent PET FDG and blood glucose measurements. The spleen sizes of the T-cell lymphoma mice were measured.
Results
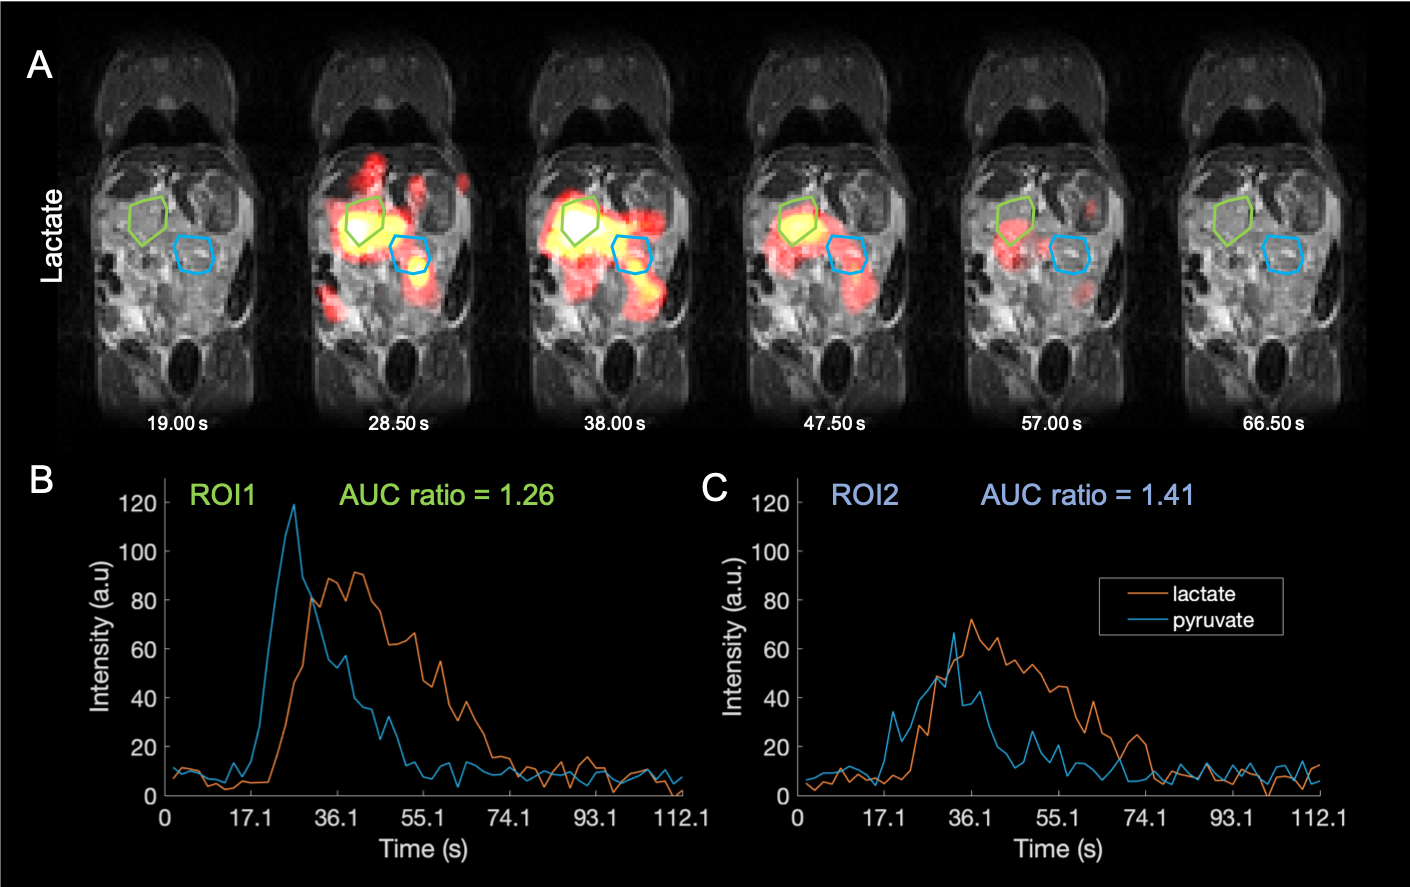
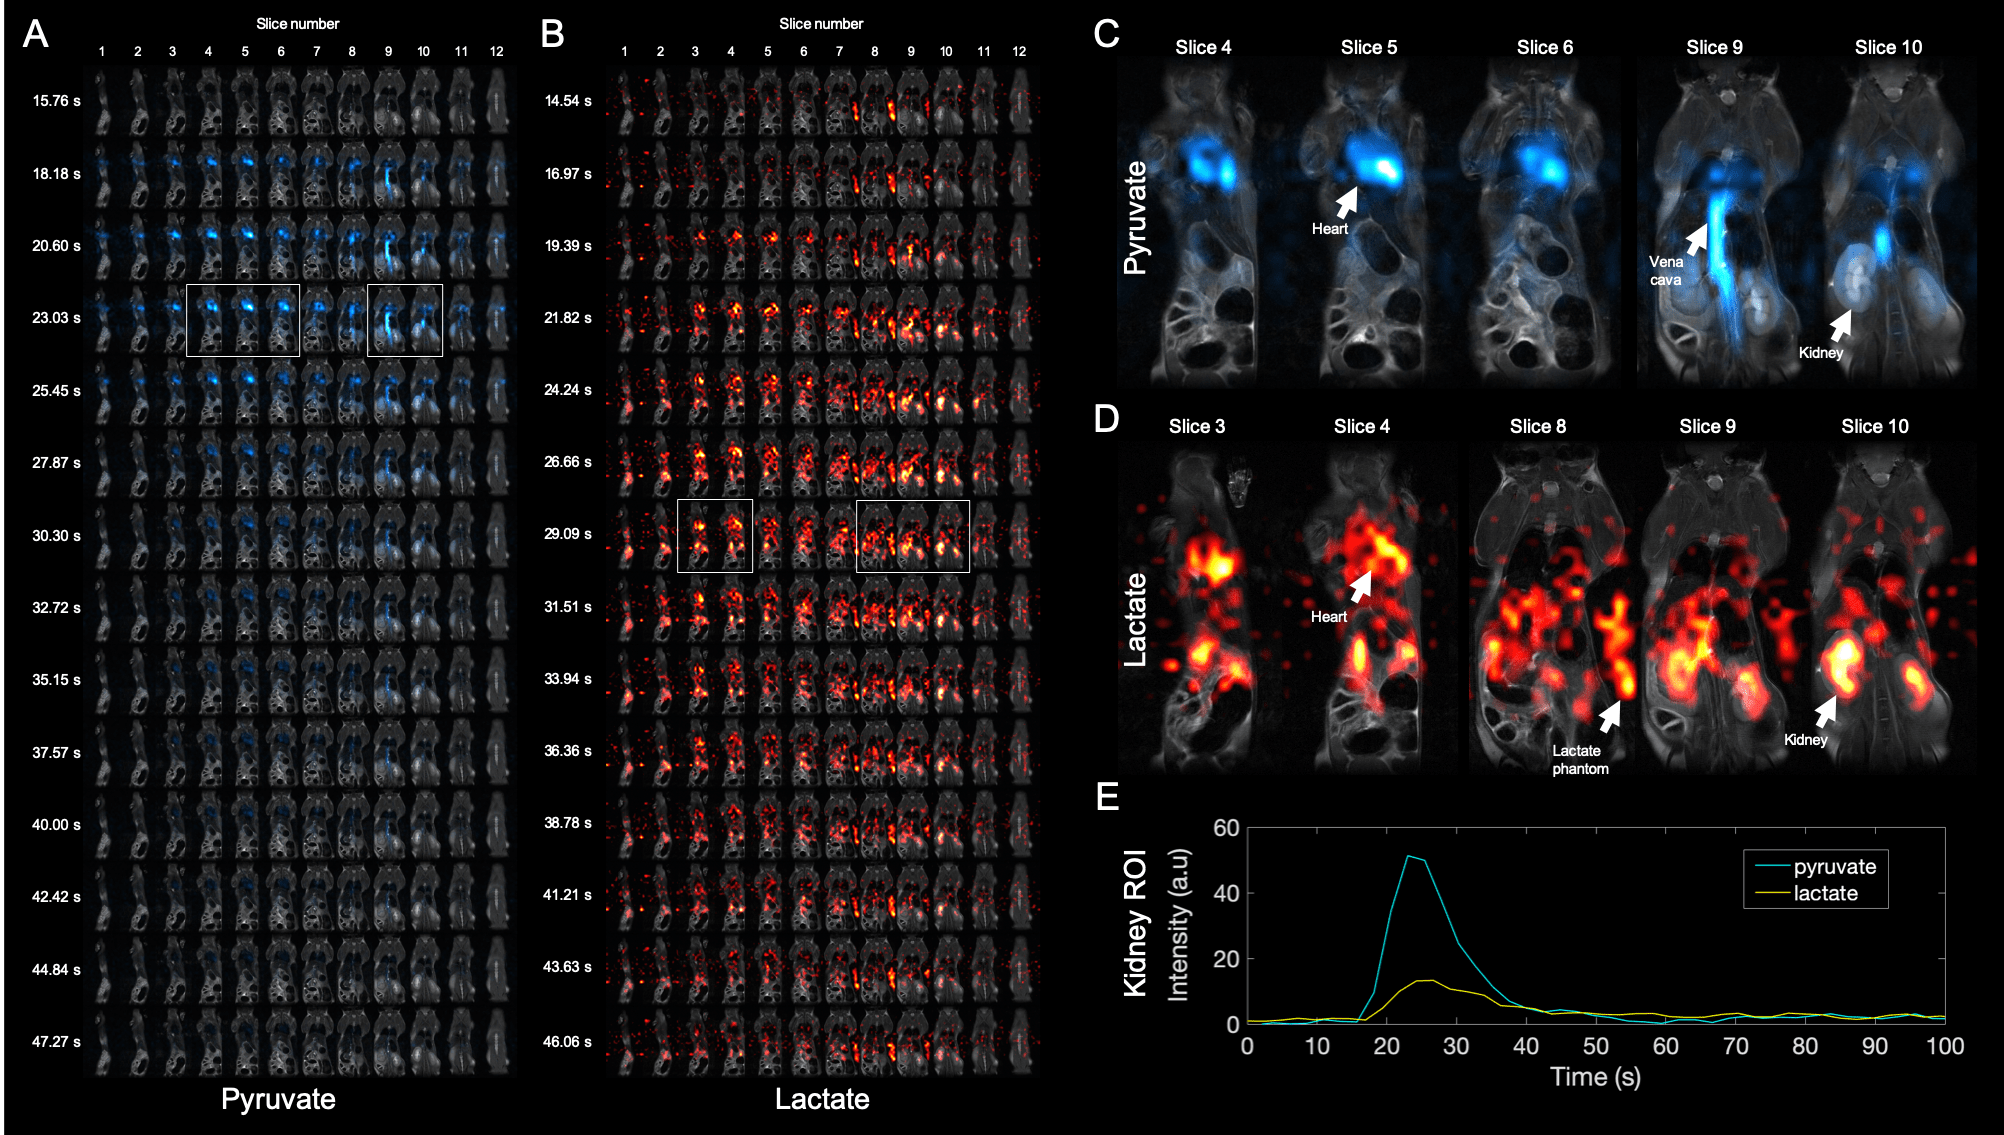
With 400 Hz FHWM pulses, 3D, time series images of pyruvate-lactate metabolism were obtained with 3 mm3 isotropic resolution in 950 ms per 3D image (Fig. 3) in PDAC and T-cell lymphoma mouse models. With 900 Hz FHWM pulses (Fig. 1), 1.75 mm3 isotropic 3D images were obtained (Fig. 4).Steadystate Bloch simulations yielded a spectrally selective bSSFP response profile that was validated by measurements (Fig. 1). Lactate phantom T1 = 1025 ms and T2 = 390.0 ms.
Evidence of heterogeneity was be detected in PDAC mice tumours: AUC ratios for ROI1 and ROI2 (Fig. 3) = 1.26 & 1.41 respectively.
Tumor metabolic volumes (TMV, Fig 5. B&C) calculated from both PET-derived SUVmean values (Fig. 5. E), and 13C-MRSI-derived AUC ratios (Fig. 5 F) were found to increase with glycolytic phenotype. However, only once the AUC ratio is considered as a TMV is a significant difference between controls and LGP/HGP animals observed.
Discussion
The agreement between measurements of the thermally polarised bSSFP steadystate response profiles and the corresponding simulations indicates that the simulations provide a good approximation of the bSSFP steadystate response when selective excitations are utilised. Deviations of the experimental data from the predicted profiles are attributed to an imperfect shim.Shortening the TR by relaxing the RF pulse FWHM from 400 Hz to 900 Hz (Fig. 2) lead to a substantial increase in resolution (from 3 mm3 to 1.75 mm3), with only a slight increase in scantime (950 ms vs. 1212 ms). Additionally, the passbands became broader (88.74 Hz to 158.98 Hz). Placement of the excitations on the far sides of the resonances means only the target resonance is excited. Removing the RF phase increment shifts the bSSFP response profile by 1/TR relative to the RF pulse, adding a further 0.5/TR = ~79.5 Hz clearance.
Conclusion
Spectrally-selective 3D bSSFP can provide high spatiotemporal resolution, banding-artefact-free images of metabolic activity in mice at 7 T. We demonstrate this in healthy mice, and models of PDAC and T-cell lymphoma. A significant difference between 3D bSSFP derived AUC ratios in healthy control mice and HGP T-cell lymphoma animals was found, and AUC ratios correlated with PET measurements. Potential tumour heterogeneity was detected in PDAC mice.Acknowledgements
We acknowledge support from the Deutsche Forschungsgemeinschaft (DFG, German Research Foundation – 391523415, SFB 824), the BMBF (FKZ 13EZ1114) and the Young Academy of the Bavarian Academy of Sciences and Humanities. This project has received funding from the European Union’s Horizon 2020 research and innovation programme under grant agreement No 820374. We thank Sybille Rederand Markus Mittelhäuser for performing the PET measurements, and Sandra Sühnel for assisting with the MRSI experiments.References
1. Milshteyn E, von Morze C, Gordon JW, Zhu Z, Larson PE, Vigneron DBJMrim. High spatiotemporal resolution bSSFP imaging of hyperpolarized [1‐13C] pyruvate and [1‐13C] lactate with spectral suppression of alanine and pyruvate‐hydrate. 2018;80(3):1048-1060.
2. Shang H, Sukumar S, von Morze C, Bok RA, Marco‐Rius I, Kerr A, Reed GD, Milshteyn E, Ohliger MA, Kurhanewicz JJMrim. Spectrally selective three‐dimensional dynamic balanced steady‐state free precession for hyperpolarized C‐13 metabolic imaging with spectrally selective radiofrequency pulses. 2017;78(3):963-975.
3. Eichhorn TR, Takado Y, Salameh N, Capozzi A, Cheng T, Hyacinthe J-N, Mishkovsky M, Roussel C, Comment AJPotNAoS. Hyperpolarization without persistent radicals for in vivo real-time metabolic imaging. 2013;110(45):18064-18069.
4. Wartewig T, Kurgyis Z, Keppler S, Pechloff K, Hameister E, Öllinger R, Maresch R, Buch T, Steiger K, Winter CJN. PD-1 is a haploinsufficient suppressor of T cell lymphomagenesis. 2017;552(7683):121.
5. Heid I, Steiger K, Trajkovic-Arsic M, Settles M, Eßwein MR, Erkan M, Kleeff J, Jäger C, Friess H, Haller BJCCR. Co-clinical assessment of tumor cellularity in pancreatic cancer. 2017;23(6):1461-1470.
Figures