3025
Detecting early response to immune checkpoint inhibitors by multimodal molecular imaging1National Cancer Institute, Bethesda, MD, United States
Synopsis
The purpose of this study is to detect physiologic and metabolic changes in tumor-bearing mouse model in response to immune checkpoint blockade therapy by using multi-modal imaging methods including hyperpolarized 13C-MRI with [1-13C] pyruvate, with [1,4-13C2] fumarate, and DCE-MRI. Lactate/Pyruvate ratio tended to decrease in αPD-L1 Ab + αCTLA-4 Ab treated tumor in mouse model although not statistically significant. Significantly increased Malate/Fumarate ratio and higher permeability were observed in treated tumor. We will investigate capability of detecting early response to immune checkpoint blockade therapy using multi-modal imaging.
Purpose
Immune checkpoint inhibitors have now become a standard therapy for several cancers. However, none of them have become a gold standard for treatment assessment to date although several biomarkers have been proposed for this purpose. Besides, the treatment response in immunotherapy is often delayed; tumors may transiently enlarge even when the treatment is eventually effective (1). The delayed response can pose a potential problem in designing treatment plans. Thus, developing an early prediction of the treatment response to immunotherapy is of great importance. It is reported that metabolic competition between tumor cells and immune cells is one of the reasons that immune system can’t eradicate tumor cells. PD-1/PD-L1 blockade can restore glucose in tumor microenvironment, permitting T cell glycolysis and IFN- γ production and dampen tumor glycolysis by inhibiting mTOR activity (2). In addition to this, physiologic changes by immunotherapy such as inflammation, edema, necrosis, and normalization of tumor vasculature can modulate the metabolic profile in tumor. We employed hyperpolarized 13C MRI using [1-13C] pyruvate and [1,4-13C2] fumarate for detecting early changes in tumor glycolysis and in tumor necrosis, respectively after immune checkpoint blockade therapy. We also evaluated intratumor permeability using dynamic contrast enhanced (DCE) MRI. The aim of this study is to investigate the capability of the multi-modal imaging to evaluate the treatment response to immune checkpoint inhibitor blockade therapy.Methods
MC38 colon adenocarcinoma and B16.F10 melanoma were used as sensitive and less sensitive model to immune checkpoint blockade. C57BL/6 mice were used for all in vivo experiments. 1-10 x 105 tumor cells were inoculated s.c. into the right leg of mice. For in vivo antibody treatments, tumor bearing mice were injected i.p. with 200 μg of αPD-L1 antibody and 200 μg of αCTLA-4 Ab on days 9, 12, and 15 post tumor inoculation at the size of approximately 100-150 mm3. Tumor bearing mice in the control group were injected with 200 μg each of IgG isotype antibody.Hyperpolarized 13C-MRI studies: [1-13C] pyruvic acid (30 μL) or [1,4-13C2] fumaric acid (2.5 M in 30 μL deuterated DMSO), containing 15 mmol/L OX063 and 2.5 mmol/L gadolinium, was hyperpolarized using the Hypersense DNP polarizer (Oxford Instruments). After 30 to 60 minutes, the hyperpolarized sample was rapidly dissolved in 4.5 mL of a superheated alkaline buffer. Hyperpolarized 13C labeled solutions of pyruvate or fumarate were intravenously injected through a catheter placed in the tail vein of the mouse (12 mL/g body weight). Hyperpolarized 13C MRI studies were performed on a 3T scanner using a 17 mm home-built 13C solenoid coil placed inside of a saddle coil for 1H. 13C spectra were acquired every 1 second for 240 seconds.
DCE-MRI: DCE-MRI studies were performed on a 1 T scanner (Bruker BioSpin MRI GmbH). T1-weighted fast low-angle shot (FLASH) images were obtained with TR = 156 ms; TE = 4 ms; flip angle = 45˚; four slices; 0.44 x 0.44 mm resolution; 20-second acquisition time per image; and 98 repetitions. Gd-DTPA solution (4 mL/g of body weight of 50 mmol/L Gd-DTPA) was injected through a tail vein cannula 2 minutes after the start of the dynamic FLASH sequence. To determine the local concentrations of Gd-DTPA, T1 maps were calculated from three sets of Rapid Imaging with Refocused Echoes (RARE) images obtained with TR = 300, 600, 1,000, and 2,000 ms, with the acquisitions being made before running the FLASH sequence.
Results
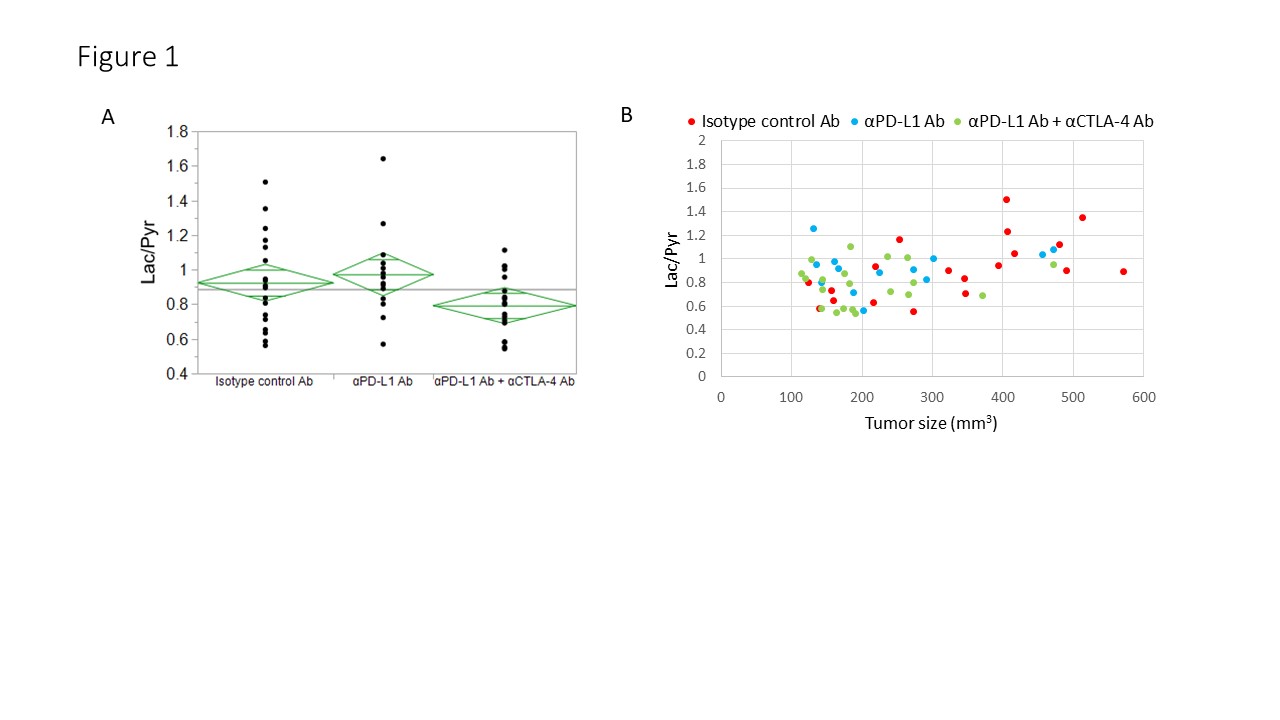
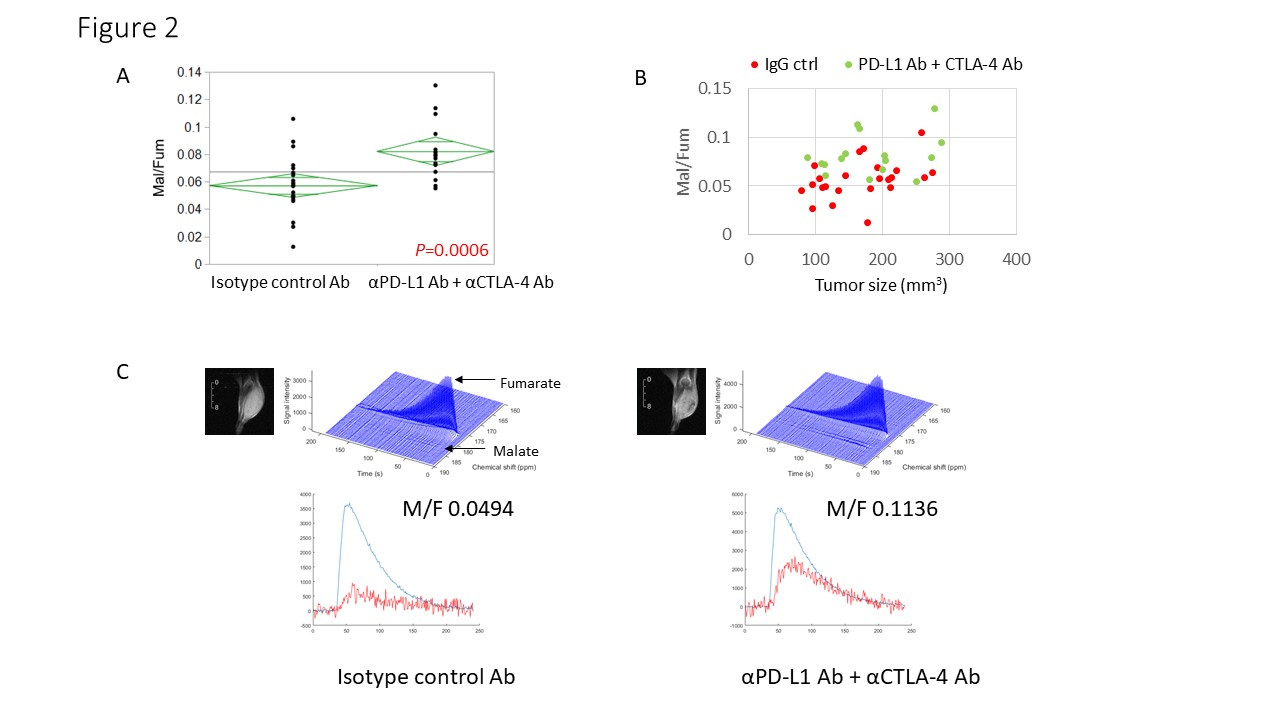
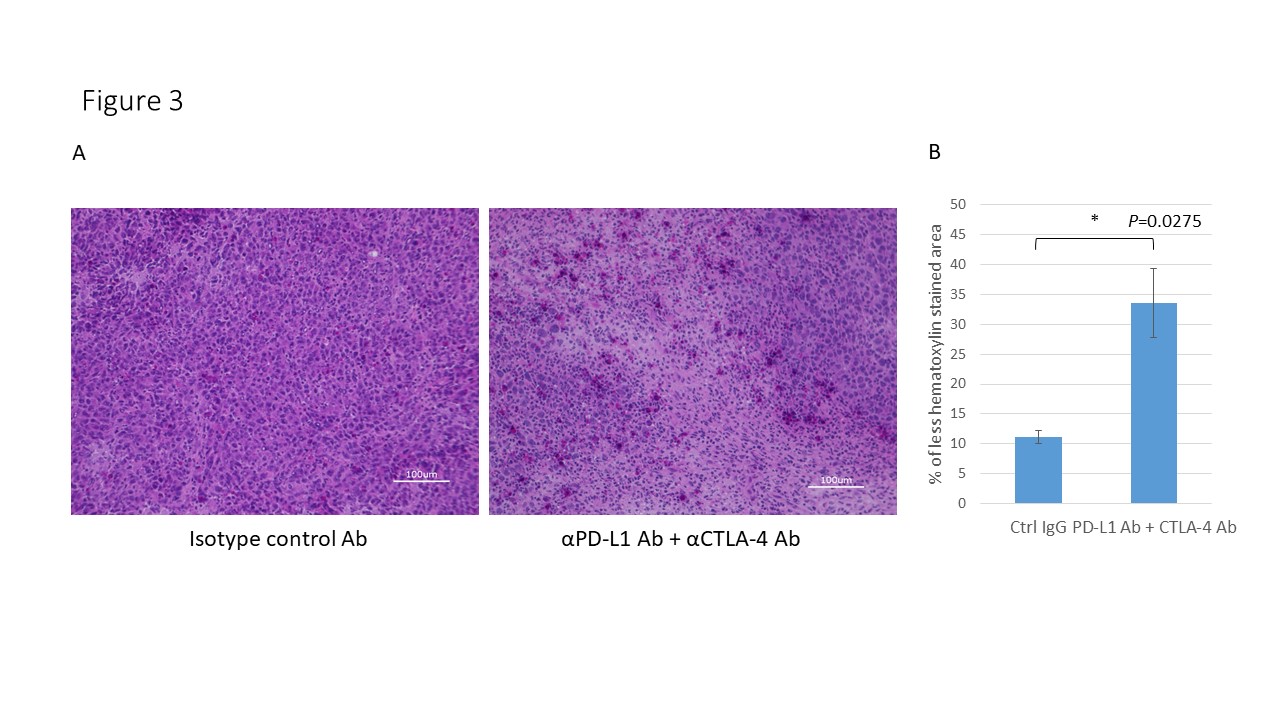
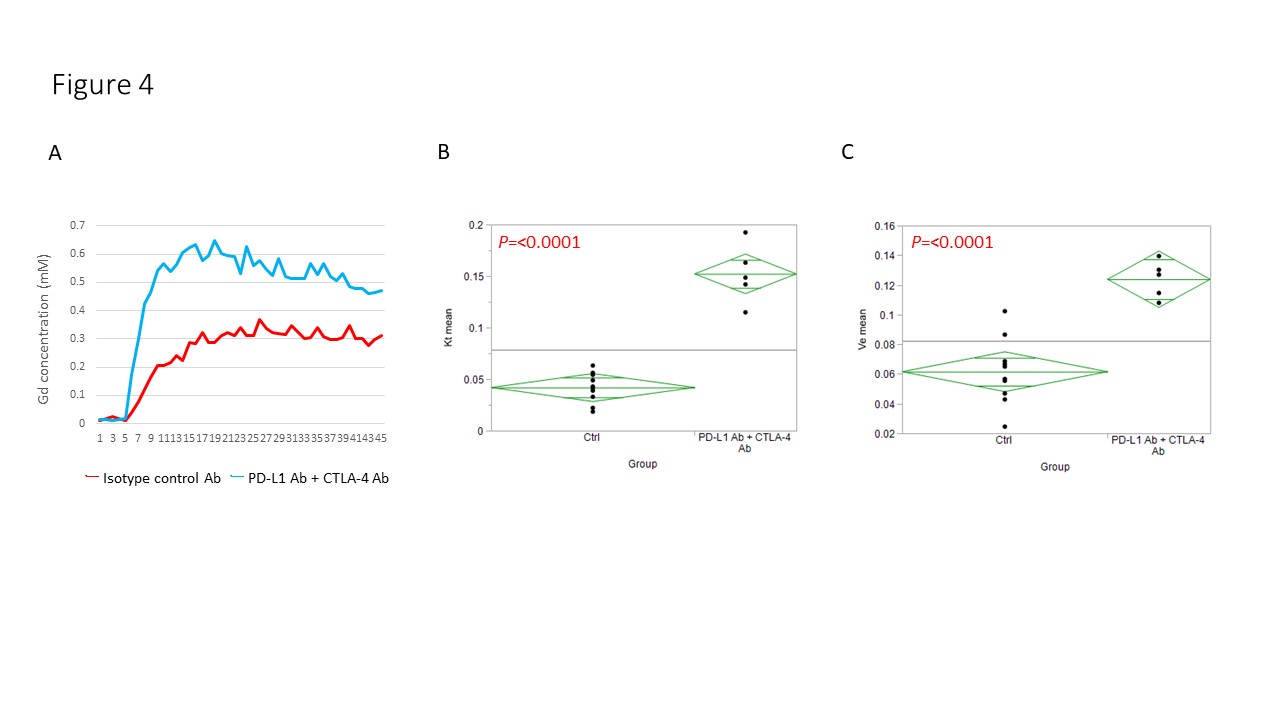
Hyperpolarized 13C-MRI with [1-13C] pyruvate showed that Lactate/Pyruvate ratio (Lac/Pyr) tended to decrease in αPD-L1 Ab + αCTLA-4 Ab treated MC38 tumor compared to isotype control Ab treated tumor, but the difference was not statistically significant (Fig. 1). Multivariable regression showed that tumor size significantly increased the metabolism (p=0.0003). Hyperpolarized 13C-MRI with [1,4-13C2] fumarate showed that Malate/Fumarate ratio (Mal/Fum) significantly increased in PD-L1 Ab + CTLA-4 Ab treated tumor (p=0.0006), suggesting that necrotic tumor cell death was induced in response to this therapy. Multivariable regression showed that both treatment and tumor size significantly increased Mal/Fum (p=0.0008, p=0.04, respectively) (Fig. 2). Histology showed increased replacement by interstitial tissue with lymphocytes infiltration in treated tumor, suggesting tumor cell death (Fig. 3). DCE MRI showed significantly increased permeability of Gd-DTPA in treated tumor (Fig. 4).Conclusion
We performed multi-modal imaging to detect the early response to immune checkpoint blockade therapy. DNP 13C MRI with [1,4-13C2] fumarate showed enhanced production of malate reflecting necrotic tumor cell death after the therapy. DCE-MRI showed increased intratumor permeability in treated tumor. These data can provide imaging biomarkers to detect early response to cancer immunotherapy.Acknowledgements
No acknowledgement found.References
(1) Hodi FS, et al. Evaluation of Immune-Related Response Criteria and RECIST v1.1 in Patients With Advanced Melanoma Treated With Pembrolizumab. J Clin Oncol 2016, 1;34(13):1510-7.
(2) Chang C-H, et al. Metabolic Competition in the Tumor Microenvironment Is a Driver of Cancer Progression. Cell. 2015; 162: 1229–1241.
Figures