3022
Imaging a tumor hallmark: hyperpolarized [U-13C, U-2H]-glucose and [1-13C]-alanine non-invasively monitor TERT expression in gliomas in vivo1Radiology and Biomedical Imaging, University of California San Francisco, San Francisco, CA, United States, 2Neurological Surgery, University of California San Francisco, San Francisco, CA, United States
Synopsis
Telomerase reverse transcriptase (TERT) expression is a fundamental hallmark of tumor proliferation, including in low-grade oligodendrogliomas. Inhibiting TERT expression is also a therapeutic strategy for gliomas. In this study, we show, for the first time, that metabolism of hyperpolarized [U-13C,U-2H]-glucose to 6-phosphogluconate via the pentose phosphate pathway and hyperpolarized [1-13C]-alanine flux to lactate can serve to non-invasively detect TERT expression in orthotopic low-grade oligodendrogliomas in vivo. Our imaging biomarkers will allow non-invasive, longitudinal detection of a molecular hallmark of tumor proliferation and have the potential to enhance imaging of glioma burden and response to emerging TERT therapies in the clinic.
Introduction
Gliomas constitute the majority of malignant primary brain tumors and are a significant clinical problem with long-lasting physical and cognitive effects. Recent advances in genomics have uncovered a variety of clinically relevant mutations in gliomas1. There is an urgent need to identify methods of non-invasively imaging these oncogenic events, thereby integrating this genomic information into patient management.A critical oncogenic event in cancer, including in low-grade oligodendrogliomas, is the acquisition of mutations in the promoter of telomerase reverse transcriptase (TERT), leading to reactivation of TERT expression2. TERT is responsible for the synthesis of telomeres, which are chromosomal structures that are essential for cell proliferation3. TERT is, therefore, a hallmark of tumor proliferation3. Since TERT is silenced in normal cells and specifically reactivated in tumor cells, TERT is also a therapeutic target2, 4. Imaging TERT can differentiate “true” tumor burden from pseudo-progression or pseudoresponse and allow assessment of response to emerging TERT inhibitors. Therefore,the goal of this study was to identify hyperpolarized 13C-magnetic resonance spectroscopy (MRS) agents that can detect TERT expression in low-grade oligodendrogliomas.
Methods
Cell culture: We examined immortalized normal human astrocytes without (NHAcontrol) and with TERT (NHAtert) expression. TERT expression in these models has been confirmed5.1H-MRS: Metabolites were extracted by methanol-chloroform extraction and 1H-MRS spectra acquired on an 11.7T Bruker spectrometer (90°flip angle, 3s relaxation delay, 256 scans)6.
Thermally-polarized 13C-MRS: Cells were incubated with medium containing 5mM [2-13C]-glucose, metabolites extracted and proton-decoupled 13C-MRS spectra acquired on an 11.7T Bruker spectrometer (30°flip angle, 3s relaxation delay, 2048 acquisitions)6. Glucose flux to the pentose phosphate pathway (PPP) was calculated from the relative proportions of [4-13C]-glutamate and [5-13C]-glutamate as described7.
Hyperpolarized 13C-MRS in cells: [U-13C, U-2H]-glucose or [1-13C]-alanine were prepared as described8, 9, polarized, dissolved in isotonic buffer and injected into live cells in a 10mm NMR tube to a concentration of 10mM. 13C spectra were acquired every 3s for 300s on a Bruker 14.1T spectrometer and ratios of area under the curve (AUC) for product to substrate quantified.
In vivo hyperpolarized 13C-MRS: For slab studies, dynamic 13C spectra were acquired following intravenous injection of hyperpolarized [U-13C, U-2H]-glucose or [1-13C]-alanine from a 12mm (glucose) or 15mm (alanine) slab through the brain every 3s using a flyback spectral-spatial RF pulse10. For imaging studies, a 2D spectral-spatial echo-planar spectroscopic imaging (EPSI) pulse10 was used (spatial resolution=231mm3, temporal resolution=3s). 13C slab spectra were analyzed using Mnova. EPSI data was analyzed using in-house Matlab codes. Color heatmaps were produced by interpolating the data using a Lanczos-2 kernel and normalizing to noise.
Statistical analysis: Results are expressed as mean±SD and statistical significance assessed using an unpaired Student’s t-test (** = p<0.01, *** = p<0.005).
Results
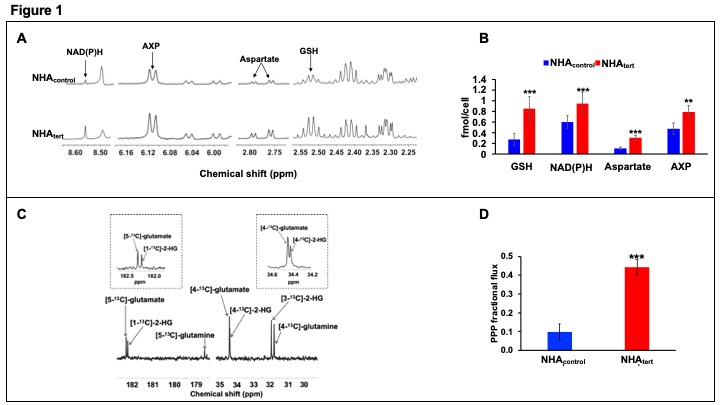
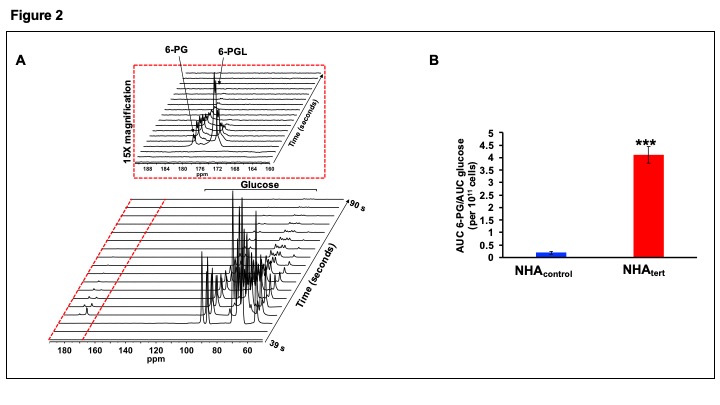
Using 1H-MRS we established that TERT expression induces unique metabolic reprogramming, leading to elevated levels of reduced glutathione (GSH), NAD(P)H, aspartate and AXP in NHAtert cells relative to NHAcontrol (Fig.1A-1B). Since 1H-MRS cannot distinguish between NADPH and NADH, we used spectrophotometric assays to establish that both NADPH and NADH were elevated in NHAtert cells (data not shown in the interest of clarity). Glucose flux through the PPP is a major producer of NADPH, which, in turn maintains GSH in the reduced state11. Using thermally-polarized 13C-MRS to measure the relative proportions of [4-13C]-glutamate and [5-13C]-glutamate produced from [2-13C]-glucose (Fig.1C), we established that PPP flux was elevated in NHAtert cells (Fig. 1D).In order to leverage this TERT-induced increase in PPP flux for non-invasive hyperpolarized 13C-MRS, we examined metabolism of hyperpolarized [U-13C,U-2H]-glucose (Fig. 2A). The flux of hyperpolarized [U-13C,U-2H]-glucose to the PPP metabolite 6-phosphogluconate (6-PG, 179.4ppm) was significantly elevated in NHAtert cells relative to NHAcontrol (Fig. 2B).
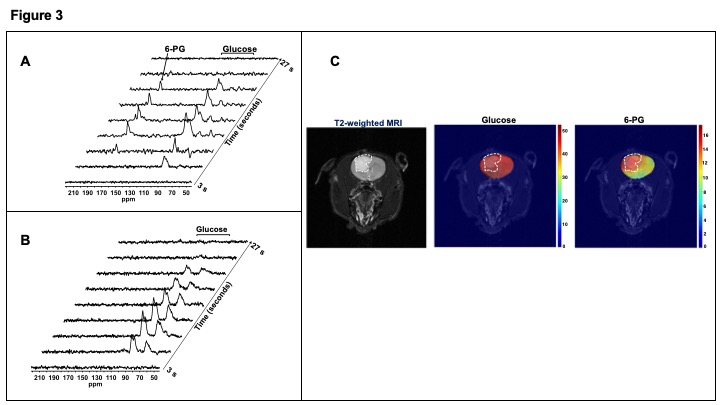
Next, we examined the feasibility of imaging TERT status in vivo using hyperpolarized [U-13C, U-2H]-glucose. Dynamic 13C slab spectra acquired after intravenous injection of hyperpolarized [U-13C, U-2H]-glucose showed build-up of [1-13C]-6-PG only in rats bearing orthotopic NHAtert tumors and not tumor-free controls (Fig.3A-3B). Importantly, 2D EPSI imaging indicated that 6-PG production clearly differentiated tumor from normal brain in orthotopic NHAtert tumors (Fig. 3C).
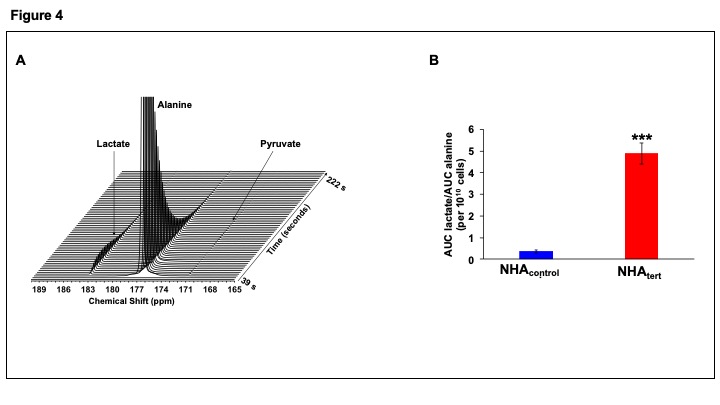
We then exploited the observation that TERT expression increased NADH. Hyperpolarized [1-13C]alanine has been used to measure intracellular NADH in rat abdomen9 and liver12. Hyperpolarized [1-13C]-alanine is first converted to [1-13C]-pyruvate and further conversion of [1-13C]-pyruvate to [1-13C]-lactate is dependent on NADH13, 14. Lactate production from hyperpolarized [1-13C]-alanine was higher in NHAtert cells relative to NHAcontrol (Fig.4A-4B).
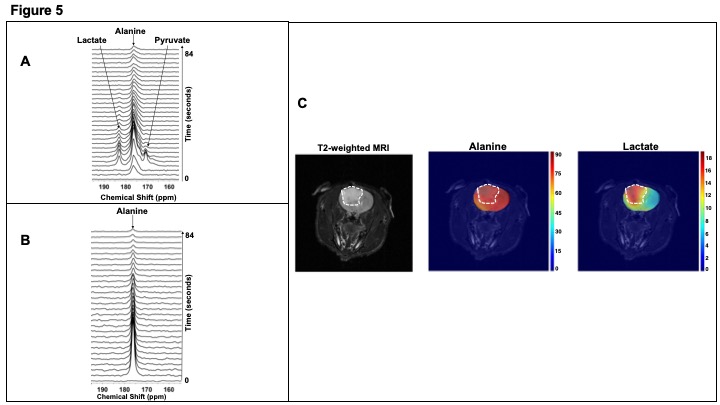
To determine the feasibility of imaging TERT status in vivo using hyperpolarized [1-13C]-alanine, we acquired dynamic 13C spectra from a 15mm slab after intravenous injection of hyperpolarized [1-13C]-alanine. We observed [1-13C]-lactate only in NHAtert tumor-bearing rats (Fig.5A) and not in tumor-free controls (Fig.5B). Importantly, 2D EPSI imaging of hyperpolarized [1-13C]-alanine metabolism in orthotopic NHAtert tumors revealed pronounced differences in lactate production between tumor and normal brain (Fig.5C).
Conclusions
We show, for the first time, that hyperpolarized [U-13C,U-2H]-glucose and hyperpolarized [1-13C]-alanine can non-invasively monitor TERT expression in vivo in low-grade oligodendrogliomas. Since TERT expression is a hallmark of tumor proliferation2, 3, our biomarkers have the potential to differentiate tumor from areas of pseudoprogression and pseudoresponse, which are currently major challenges in glioma imaging15. Our biomarkers can also monitor response to therapy, including novel TERT inhibitors currently under development2, 4.Acknowledgements
This work was supported by the following grants: NIH R01CA172845, NIH R01CA197254, UCSF Brain Tumor Loglio Collective, NICO, NIH P41EB013598 and NIH P50CA97257.References
1. Louis DN, et al. Acta Neuropathol 131, 803-20 (2016).
2. Bell RJ, et al. Mol Cancer Res 14, 315-23 (2016).
3. Hanahan D, Weinberg RA. Cell 144, 646-74 (2011).
4. Mancini A, et al.Cancer Cell 34, 513-28 e8 (2018).
5. Ohba S, et al. Cancer Res 76, 6680-89 (2016).
6. Viswanath P, et al. Cancer Res 78, 2290–304 (2018).
7. Brekke EM, et al. J Cereb Blood Flow Metab 32, 1788-99 (2012).
8. Rodrigues TB, et al. Nat Med 20, 93-7 (2014).
9. Hu S, et al. Magn Reson Imaging 29, 1035-40 (2011).
10. Larson PE, et al. J Magn Reson 194, 121-7 (2008).
11. Stincone A, et al. Biol Rev Camb Philos Soc 90, 927-63 (2015).
12. Park JM, et al. Magn Reson Med 77, 1741-48 (2017).
13. Day SE, et al. Nat Med 13, 1382-7 (2007).
14. Witney TH, et al. J Biol Chem 286, 24572-80 (2011).
15. Villanueva-Meyer JE, et al.Neurosurgery 81, 397-415 (2017).
Figures