3021
Super-Resolution Hyperpolarized 13C Imaging of Human Brain Using Patch-Based Algorithm1Advanced Imaging Research Center, UT Southwestern Medical Center, Dallas, TX, United States, 2Radiology, UT Southwestern Medical Center, Dallas, TX, United States, 3Electrical Engineering, UT Dallas, Richardson, TX, United States
Synopsis
In this study, a patch-based super-resolution algorithm is proposed, which uses prior knowledge from high-resolution 1H MRI to guide the reconstruction of hyperpolarized 13C images. The algorithm was validated with simulation and phantom, and the results show enhanced spatial resolution, SNR and contrast as well as comparable quantification accuracy to the upsampled images from nearest-neighbor, bilinear and spline interpolation methods. Finally, the proposed algorithm was applied to metabolic imaging of human brain with hyperpolarized [1-13C]pyruvate injection, which significantly improve the image resolution, SNR and contrast while keeping the quantification accuracy.
Background
Hyperpolarized 13C MR is a powerful imaging tool that provides unique metabolic profiles of in vivo metabolism1–4. However, data acquisition with an adequate sampling rate is highly challenging for hyperpolarized 13C imaging due to the multi-dimensional nature of MR spectroscopic imaging and the transient characteristics of hyperpolarized signals. Compromises in spatial resolution of hyperpolarized 13C metabolite maps are usually taken because of the limited signal-to-noise ratio (SNR), long acquisition time, and hardware. In this work, we propose a patch-based algorithm (PA) for enhancing the spatial resolution of hyperpolarized 13C images.Methods
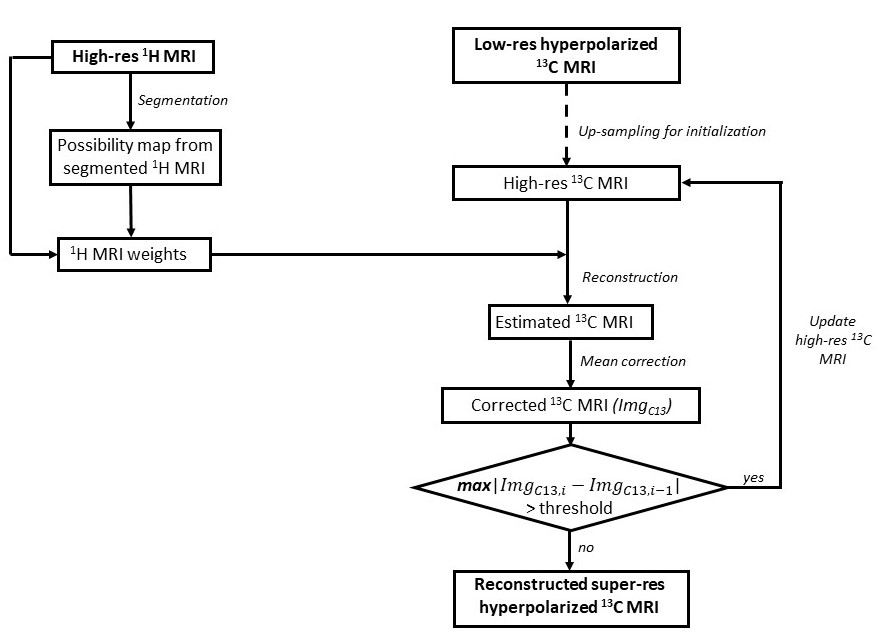
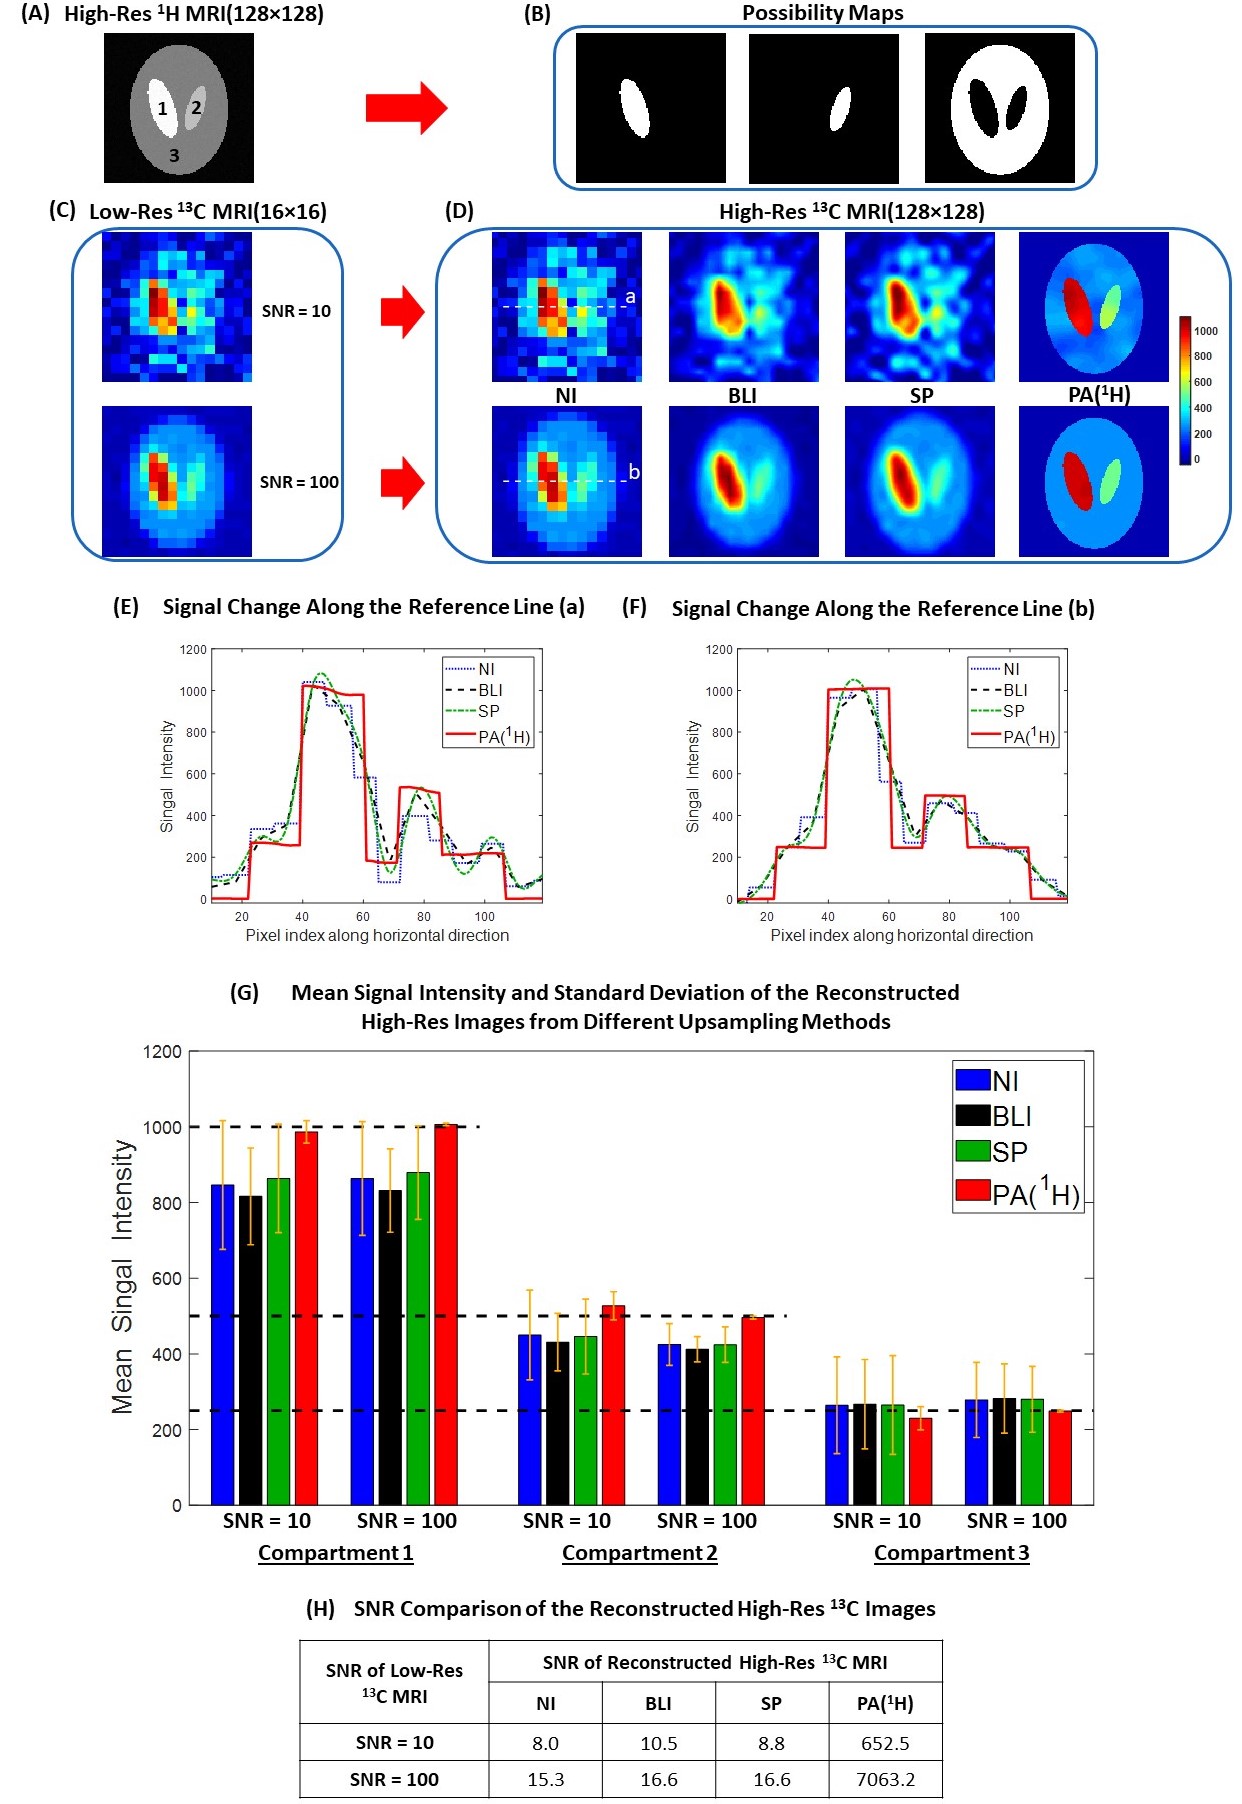
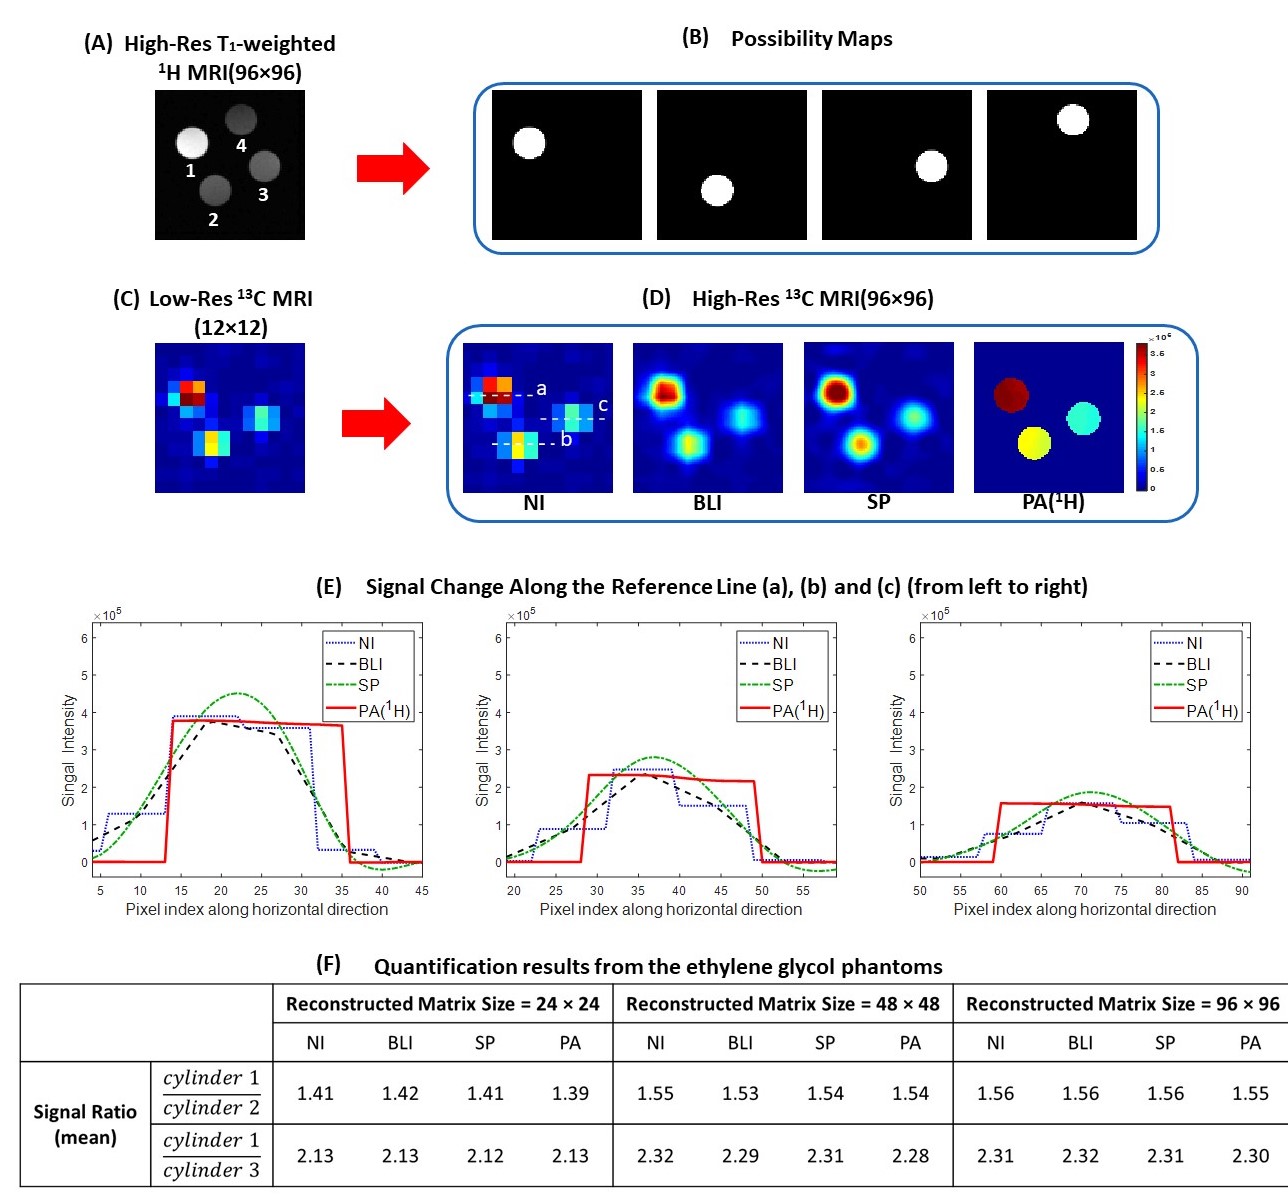
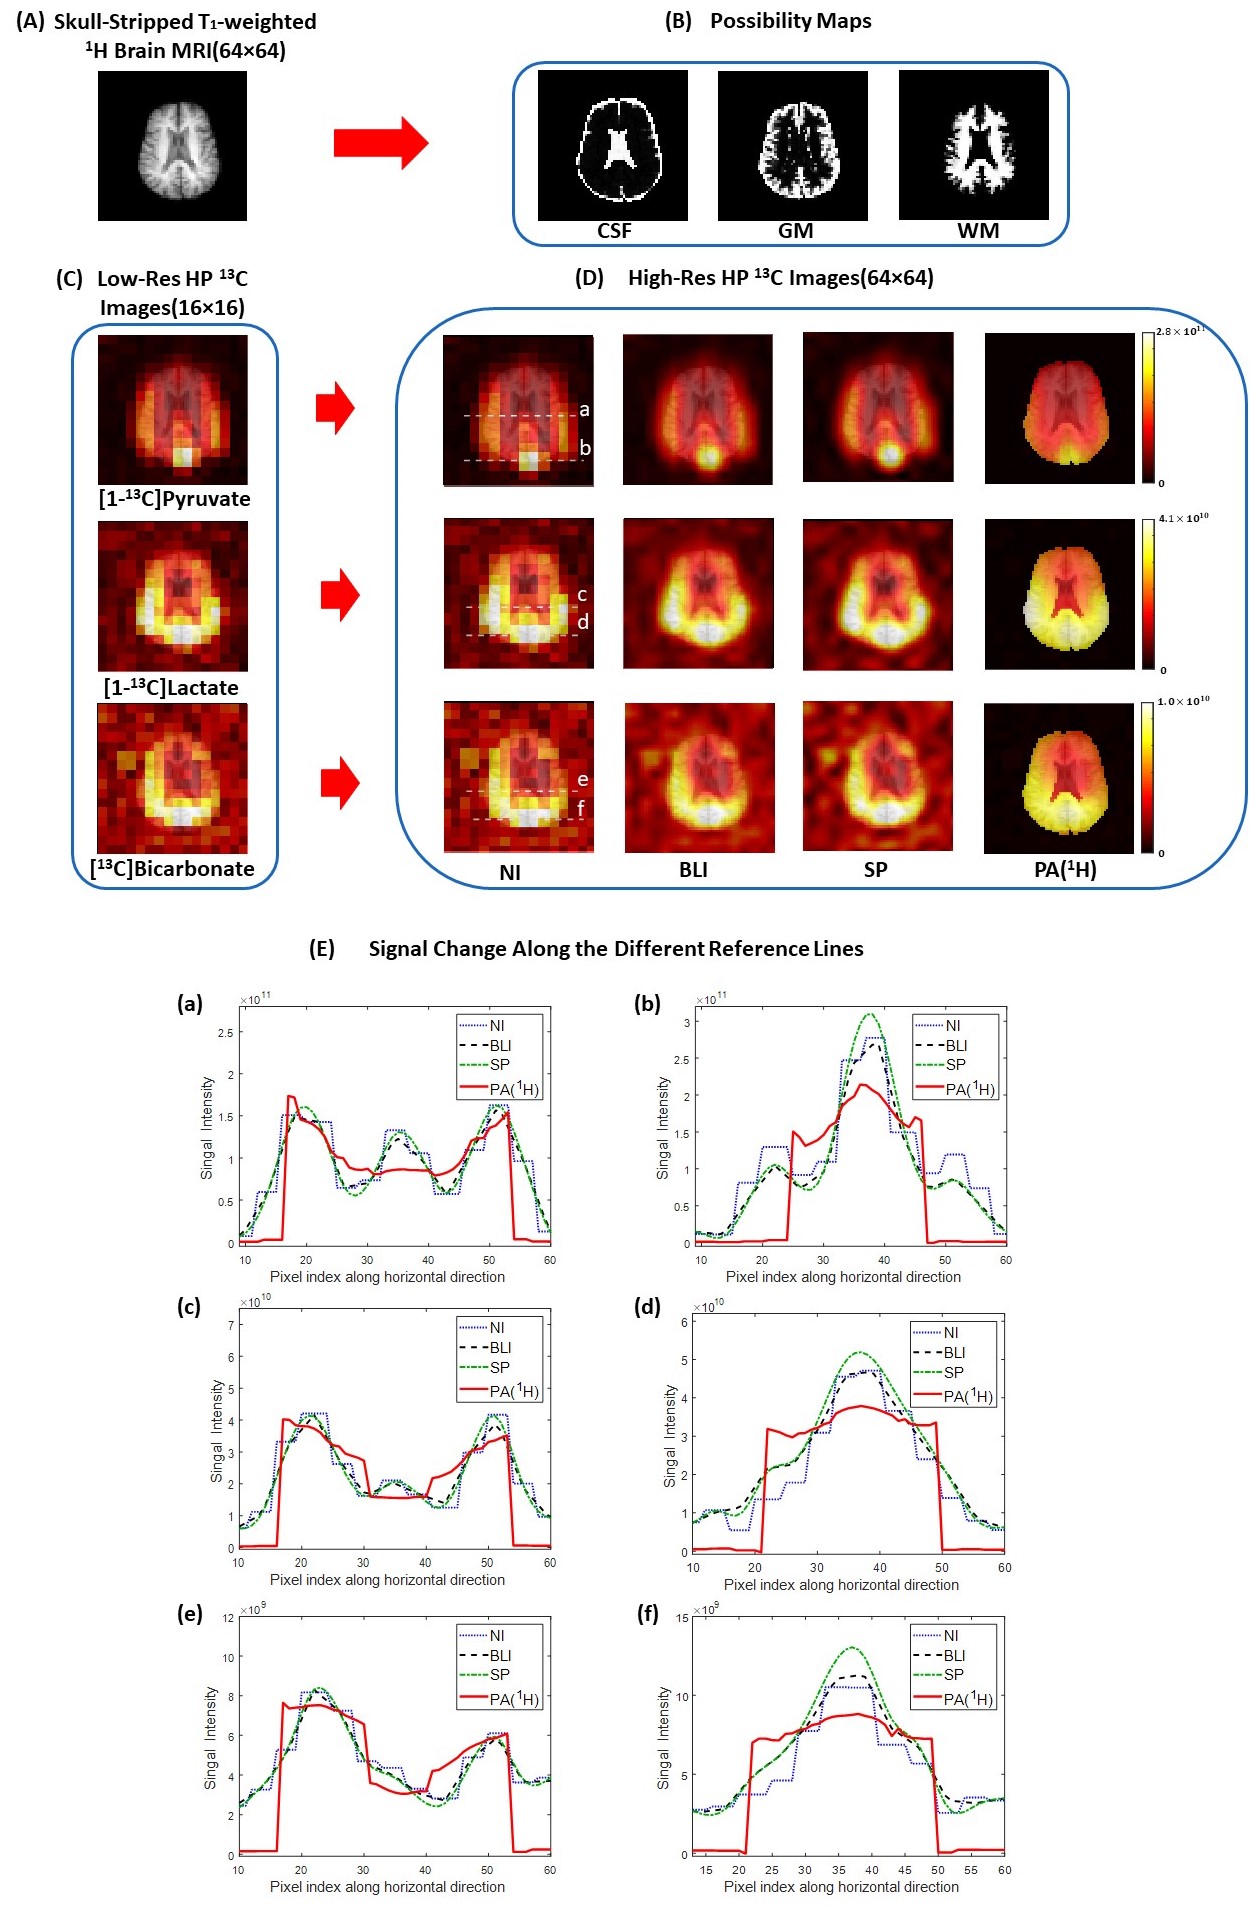
Fig. 1 shows the schematic diagram of the PA5. Simulation was performed using digital phantoms generated from MATLAB to validate the performance of the proposed algorithm. Fig. 2A and Fig. 2B show the simulated high-resolution 1H image that consists of 3 compartments and the corresponding possibility maps. Two low-resolution 13C images were created with SNRs of 10 and 100 (Fig. 2C). The mean 13C signal intensities of compartment 1, 2, and 3 were assigned to 1,000, 500, and 250, respectively. High-resolution 13C images were reconstructed using the PA and compared to the results from nearest-neighbor interpolation (NI), bilinear interpolation (BLI) and spline interpolation (SP) methods.All the MR studies were performed using a clinical 3T 750W wide-bore MRI scanner (GE Healthcare). A 1H/13C dual-tuned quadrature transmit/receive birdcage RF coil was used for phantom studies, and the human brain imaging was performed using a customized dual-frequency human head RF coil6. For phantom study, four cylindrical phantoms (Fig. 3, ∅ = 1 cm, length = 5 cm) were used with phantoms #1 – #3 filled with non-labeled pure ethylene glycol (with concentration of 17.68 M, 13.26 M and 8.84 M, respectively) and phantom #4 filled with water. High-resolution 1H MRI was acquired with 2D T1-weighted fast spin echo sequence (TR = 114 ms, TE = 42 ms, flip angle = 90°, FOV = 6 cm, slice thickness = 10 mm, spatial resolution = 0.23×0.23 mm2, 3 averages). For 13C imaging, free induction decay chemical shift imaging sequence was used (TR = 3,000 ms, flip angle = 90°, FOV = 6 cm, slice thickness = 10 mm, nominal spatial resolution = 5×5 mm2, 32 averages). For in vivo studies, GMP-grade [1-13C]pyruvic acid samples (Sigma Aldrich, St. Louis, MO) were prepared in clinical fluid paths and polarized using a SPINlab clinical dynamic nuclear polarization (DNP) system (GE Healthcare)7. The imaging protocol was approved by the local Institutional Review Board (IRB#: STU 072017-009). Brain data were acquired from a healthy volunteer (63 y.o., male) using a brain MR protocol, which includes 1H MRI and an injection of hyperpolarized [1-13C]pyruvate followed by a 2D dynamic spiral CSI sequence(FOV = 24 cm, matrix size = 16x16, slice thickness = 2-3 cm, variable flip angle up to 30°, TR = 5 s, 7 spatial interleaves, spectral width = 814 Hz, 48 echoes)8. The acquired 1H images were used for brain skull-stripping and brain segmentation with FSL package (FMRIB, Oxford, UK)9,10 to produce the possibility maps of GM, WM and CSF.
Results and Discussion
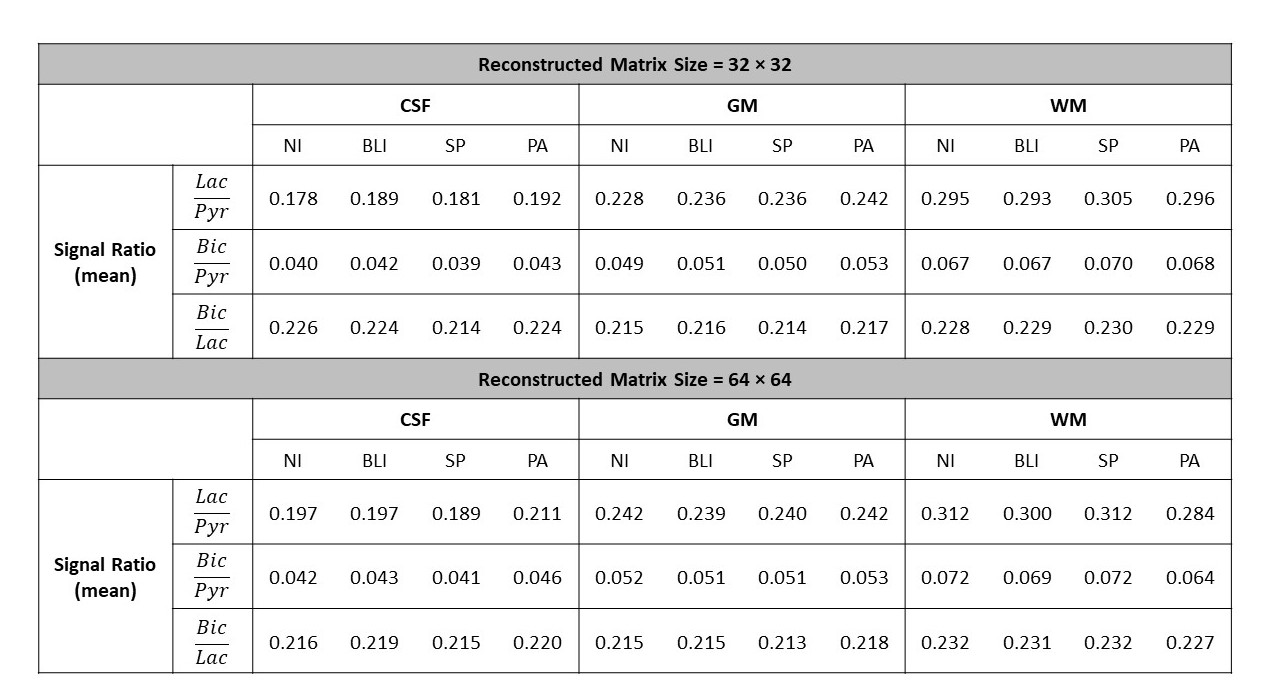
When the 1H-based segmentation is correctly assigned to the 13C signal distribution, the PA reconstructs high-resolution 13C images with better SNR and higher contrast than other interpolation methods, as demonstrated in Fig. 2. The signal intensities calculated from the compartments show that the PA reconstructs high-resolution 13C images more accurately (Fig. 2G). Fig. 3 shows results from the phantom test. The acquired low-resolution 13C image (Fig. 3C) was upsampled by 2, 4, and 8 times using NI, BLI, SP, and PA. Fig. 3D shows the reconstructed high-resolution 13C images with 8-times upsampling. The high-resolution image from PA showed significantly enhanced SNR and also highest contrast (Fig. 3E) while keeping the quantification accuracy (Fig. 3F). Fig. 4A shows the skull-stripped T1-weighted 1H brain image, and the possibility maps were calculated as shown in Fig. 4B. The low-resolution hyperpolarized 13C images of [1-13C]pyruvate, [1-13C]lactate and [13C]bicarbonate (Fig. 4C) were upsampled by 2 and 4 times using NI, BLI, SP, and PA. Fig. 4D shows the 4-times upsampled hyperpolarized 13C images overlying on the corresponding 1H MRI. Compared to the upsampled images using NI, BLI, and SP, the results from the PA showed clearer boundaries with enhanced SNR, and more detailed structural information was observed particularly in lactate and bicarbonate maps. The mean signal ratios in CSF, GM and WM for both 2- and 4-fold upsampled cases are summarized in Fig. 5. In all three compartments, the quantification accuracy of mean bicarbonate-to-lactate ratios are comparable between the PA and the other methods for both cases. However, the mean signal ratios of lactate/pyruvate and bicarbonate/pyruvate from the PA are less concordant with those from NI, BLI and SP, especially in CSF, which may be due to the inaccurate segmentation.Conclusion
In conclusion, we proposed a patch-based super-resolution algorithm that exploits high-resolution 1H MRI for reconstructing hyperpolarized 13C images, and demonstrated the performance in simulation, phantoms, and hyperpolarized [1-13C]pyruvate images in human brain. In addition to the improved spatial resolution, the proposed algorithm also enhanced image contrast and SNR of 13C images while maintaining the quantification accuracy.Acknowledgements
Personnel Support: We appreciate the clinical research team and the supporting staffs of the Advanced Imaging Research Center at UT Southwestern for imaging the volunteers – Craig Malloy, MD, Jeff Liticker, PharmD, Crystal Harrison, PhD, Lucy Christie, RN, Jeannie Baxter, RN, Kelley Durner, RN, Carol Parcel, RN, Salvador Pena, Edward Hackett, MS, Maida Tai, and Richard Martin. We also thank Galen Reed, PhD from GE Healthcare.
Funding: The Texas Institute of Brain Injury and Repair; The Mobility Foundation; National Institutes of Health of the United States (P41 EB015908, S10 OD018468); The Welch Foundation (I-2009-20190330); UT Dallas Collaborative Biomedical Research Award.
References
1. Cunningham, C. H. et al. Hyperpolarized 13C Metabolic MRI of the Human Heart. Initial Experience. Circulation research 119, 1177–1182; 10.1161/CIRCRESAHA.116.309769. (2016).
2. Miloushev, V. Z. et al. Metabolic Imaging of the Human Brain with Hyperpolarized 13C Pyruvate Demonstrates 13C Lactate Production in Brain Tumor Patients. Cancer research 78, 3755–3760; 10.1158/0008-5472.CAN-18-0221 (2018).
3. Grist, J. T. et al. Quantifying normal human brain metabolism using hyperpolarized 1-13Cpyruvate and magnetic resonance imaging. NeuroImage 189, 171–179; 10.1016/j.neuroimage.2019.01.027 (2019).
4. Ardenkjaer-Larsen, J. H. et al. Increase in signal-to-noise ratio of 10,000 times in liquid-state NMR. Proceedings of the National Academy of Sciences of the United States of America 100, 10158–10163; 10.1073/pnas.1733835100 (2003).
5. Jain, S. et al. Patch-Based Super-Resolution of MR Spectroscopic Images. Application to Multiple Sclerosis. Frontiers in neuroscience 11, 13; 10.3389/fnins.2017.00013 (2017).
6. J. Ma, R. Hashoian, C. Sun, S. Wright, A. Ivanishev, R. Lenkinski, C. Malloy, A. Chen, J. M. Park. Development of 1H/13C RF Head Coil for Hyperpolarized 13C Imaging of Human Brain. Proceedings of the 27th ISMRM, Montreal, Canada. #568.
7. Nelson, S. J. et al. Metabolic imaging of patients with prostate cancer using hyperpolarized 1-¹³Cpyruvate. Science translational medicine 5, 198ra108; 10.1126/scitranslmed.3006070 (2013).
8. Park, J. M. et al. Metabolite kinetics in C6 rat glioma model using magnetic resonance spectroscopic imaging of hyperpolarized 1-13C pyruvate. Magnetic resonance in medicine 68, 1886–1893; 10.1002/mrm.24181 (2012).
9. Zhang, Y., Brady, M. & Smith, S. Segmentation of brain MR images through a hidden Markov random field model and the expectation-maximization algorithm. IEEE transactions on medical imaging 20, 45–57; 10.1109/42.906424 (2001).
10. Smith, S. M. Fast robust automated brain extraction. Human brain mapping 17, 143–155; 10.1002/hbm.10062 (2002).
Figures