3020
Multi-compartment pH detection in healthy and tumour bearing mice using hyperpolarized deuterated [1,5-13C2]zymonic acid1Department of Nuclear Medicine, Klinikum rechts der Isar, Technical University of Munich, Munich, Germany
Synopsis
Here, we demonstrate multi-compartment in vivo pH imaging in healthy and EL4-tumor bearing mice using deuterated hyperpolarized [1,5‑13C2, 3,6,6,6-D4]zymonic acid. Three pH-compartments of the healthy kidney (pHureter = 6.53±0.16, pHmedulla = 7.06±0.06 and pHcortex = 7.38±0.03) could be reliably detected using PRESS-voxel spectroscopy and chemical shift imaging. pH-imaging in mice bearing subcutaneous EL4-tumors allowed to identify one physiologic (pHphys = 7.39±0.05) and two acidic pH-compartments in the tumour (pHac,1 = 6.96±0.17, n=5), with the second pH-compartment being only present in subregions (pHac,2 = 6.62±0.10, n=5).
Introduction
Pathologic processes such as in cancer or renal failure involve alteration of the extra- and intracellular pH of the affected tissue. pH plays an important role in the selection of possible treatment strategies and for the subsequent monitoring of treatment efficiency1. However, to date, no fast and reliable technique in the clinic exists to non-invasively image pH2. Previously, in vivo pH-imaging was demonstrated in rats using hyperpolarized [1,5‑13C2]zymonic acid (ZA)3 whereby sensitivity could be enhanced by deuteration of the molecule4. The goal of this study was to establish in vivo pH-imaging in mice using deuterated hyperpolarized [1,5‑13C2, 3,6,6,6-D4]zymonic acid (ZAd) at a 7T preclinical scanner. In this context, we validated the method by non-localized and spatially resolved measurements in kidneys of healthy mice and show the ability to detect multiple pH-compartments per voxel in subcutaneous EL4 tumours.Methods
Study Size: 5 C57BL/6 mice were injected with 1∙107 EL4 lymphoma tumour cells (ATCC) in the lower back. 3 healthy C57BL/6 mice were used as controls.Hyperpolarization: 27 mg [1,5‑13C2, 3,6,6,6-D4]zymonic acid (ZAd) and 25 mg 13C-urea were co-hyperpolarized at 1.2K using a Hypersense DNP Polarizer (Oxford Instruments). Dissolution was performed using D2O containing 80 mM TRIS-buffer, 50 mM NaOD, 0.3 mM Na2EDTA, resulting in a final concentration of 50 mM ZAd and 100 mM 13C-urea. 5ml/kg were injected through the tail vein ca. 25s after start of dissolution.
MRI System: All experiments were performed in a small animal 7T magnet (Agilent/GE) MR901 with Bruker AVANCE III HD electronics and a 31 mm inner diameter 13C/1H-volume resonator (RAPID Biomedical).
MR-Imaging + Hyperpolarized MRSI/MRS: Tumours and a Gd-doped [1‑13C]lactate‑phantom for B1-calibration were covered with carbomer gel (Carbopol 980, Caelo) to improve shimming. Tumours and kidneys were located using 1H T2-weighted (T2w) RARE imaging. Hyperpolarized MRSI was performed using a FIDCSI-sequence starting 7s after end of injection with FA 15°, TR 83.1 ms, matrix size 14x14, slice thickness 5 mm, FOV 28x28 mm2, voxel size 2x2x5 mm3, spectral bandwidth 3201 Hz, 256 spectral points, total scan time 16.3 s. Hyperpolarized MRS was performed using a PRESS‑sequence with FAs 90°‑180°-180°, TE 13.9 ms, voxel size ~ 10 x 5 x 5 mm3, spectral bandwidth 2000 Hz, 512 spectral points, total scan time 531 ms.
Data Processing: Processing and analysis was performed in MatLab (The MathWorks Inc.). Line broadening was applied to CSI data (15 Hz for tumours, 0 Hz for kidneys) and to PRESS spectra (5 Hz). Imaging data was zero-filled by a factor of four and pH-maps were generated from magnitude spectra3. pH-values were determined using least-squares fitting of the relative difference of 13C1- and 13C5-peaks with respect to 13C-urea peak. For PRESS-data, spectra were phased manually, and pH-values calculated simultaneously for 13C1- and 13C5‑peaks relative to 13C-urea. For CSI-data from kidneys, tumours and subregions of tumours, spectra were averaged across ROIs and pH-compartments fitted.
Results
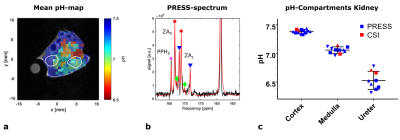
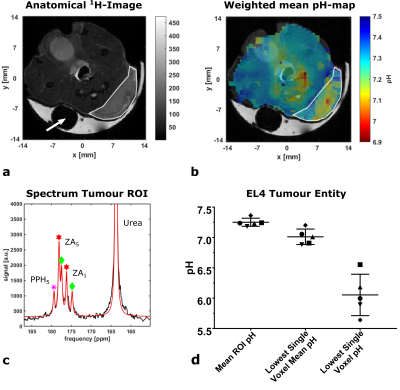
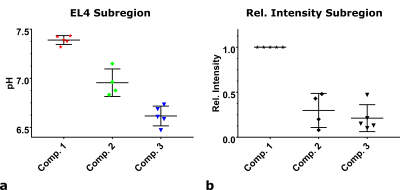
pH-maps of the kidneys in healthy mice show three pH-compartments in CSI- and PRESS‑acquisitions (Fig. 1a, b, n=3, 3-6 repetitions). The pH-compartments could be grouped unambiguously and were assigned to the ureter (pHureter = 6.53±0.16), the medulla (pHmedulla = 7.06±0.06) and the cortex (pHcortex = 7.38±0.03) (Fig. 1c). For EL4-tumour bearing mice, pH-maps of all detected compartments as well as a mean pH-map weighted by the compartment intensities were generated (Fig. 2 + 3). Tumour entities showed to have a weighted mean pH = 7.25±0.07, n=5. This mean pH consists of physiologic (pHphys = 7.39±0.05, n=5) and an acidic pH-compartment (pHac,1 = 6.96±0.17, n=5) being detectable across the entire tumour (Fig. 2c). Lowest mean single voxel pH = 7.01±0.13, n=5 and lowest single voxel pH = 6.05±0.34, n=5 (Fig. 2d) indicate strong acidity compared to healthy tissue. Further, a second even more acidic pH‑compartment (pHac,2 = 6.62±0.10, n=5) is present only in parts of the tumour which can be best resolved by analysis of ROI spectra from subregions (Fig. 4a, b). Despite both acidic compartments being present in several animals (n=4)(Fig. 5a), the relative intensities of each of these compartments normalized to the physiological compartment are only ca. 20 – 25% (Fig. 5b).Discussion
Three pH-compartments in kidney of healthy mice could be detected, agreeing with values previously reported3,5, therefore indicating hyperpolarized ZAd to be a suitable pH-sensor in mice. pH-measurements in subcutaneous EL4 tumours showed the tumour mean pH being mainly influenced by the physiological, most likely vascular pH-compartment. Nevertheless, one globally and a second, locally present, acidic pH-compartment could be detected, indicating intratumoural pH heterogeneity on a sub-voxel scale. However, the relative size of these acidic compartments is ca. 25% of the physiological compartment, indicating the need for high sensitivity and even higher spatial resolution for further investigations.Conclusion
We have established an in vivo pH-imaging protocol on a 7T preclinical MRI for healthy and EL4-tumour bearing mice. We demonstrated the ability to detect multiple pH-compartments per voxel in kidneys and EL4 tumours using hyperpolarized ZAd. Our results indicate sub‑voxel pH heterogeneity in these tumours which was not accessible by other non-spectroscopic pH imaging methods so far. The established method might prove useful for characterization of intratumoural metabolic heterogeneity and related acidity, for example when evaluating treatment strategies for cancer therapies.Acknowledgements
We acknowledge support from the Deutsche Forschungsgemeinschaft (DFG, German Research Foundation – 391523415, SFB 824).References
1. Granja S, Tavares-Valente D, Queiros O, et al. Value of pH regulators in the diagnosis, prognosis and treatment of cancer. Seminars in Cancer Biology 2017; 43: 17-34.
2. Anemone A, Consolino L, Arena F, et al. Imaging tumor acidosis: a survey of the available techniques for mapping in vivo tumor pH. Cancer Metastatis Rev. 2019;38(1-2): 25-49.
3. Duewel S, Hundshammer C, Gersch M, et al. Imaging of pH in vivo using hyperpolarized 13C‑labelled zymonic acid. Nature Commun 8, 15126 (2017).
4. Hundshammer C, Duewel S, Koecher S, et al. Deuteration of Hyperpolarized 13C‐Labeled Zymonic Acid Enables Sensitivity‐Enhanced Dynamic MRI of pH. Chemphyschem. 2017; 18(18): 2422-2425.
5. Raghunand N, Howison C, Sherry A D, et al. Renal and Systemic pH Imaging by Contrast-Enhanced MRI, Magn Reson Med. (2003); 49: 249 – 257.
Figures

a: Mean pH-map from three kidney pH-compartments (equal weights) and anatomical T2w 1H-image of a healthy mouse. Kidney ROIs are encircled with white lines.
b: PRESS-voxel spectrum of a single kidney and fit of 13C-urea-(right), parapyruvate‑hydrate‑C5(PPH5, magenta)- and ZAd-13C1- and 13C5-peaks corresponding to three pH-compartments (red, green, blue markers).
c: pH-compartments derived from multiple measurements in three animals (individual indicated by symbol type) on different days from PRESS-voxels and CSI-ROIs assigned to their anatomical kidney compartments.

a: Anatomical T2w 1H-RARE-image of a mouse bearing a subcutaneous EL4-tumor (ROI encircled by white line) and Gd‑doped [1-13C]lactate-phantom (white arrow) covered by gel.
b: Mean pH-map weighted by compartment-intensities in the corresponding voxel overlaid with anatomical image.
c: Spectrum averaged across tumour ROI. Fitting returns one physiological (pH = 7.40) and one acidic compartment (pH = 6.88).
d: Mean weighted pH in EL4-tumour ROIs (pH = 7.25±0.07, n=5), lowest mean pH in a single tumour voxel (pH = 7.25±0.07, n=5) and lowest single voxel pH = 6.05±0.34, n=5.

a: pH-map of physiological pH-compartment of a single mouse (mean pH = 7.40 in ROI) overlaid with anatomical image.
b: pH-map of first acidic compartment of a single mouse (mean pH = 6.88 in ROI) overlaid with anatomical image.
c: pH-map of second acidic compartment of a single mouse (mean pH = 6.61 in ROI) overlaid with anatomical image.

a: Anatomical 1H-image with subregion limited to strongest presence of second acidic compartment (encircled by white lines).
b: Magnitude spectrum averaged across tumour subregion as indicated in the ROI. Fitting of the spectrum returns a physiological compartment (pH = 7.38, red markers) and two acidic compartments at pH = 6.88 (green markers) and pH 6.47 (blue markers).

a: Physiologic (pH = 7.39±0.05, n=5) and two acidic pH-compartments (pHac,1 = 6.96±0.14, n=4 and pHac,2 = 6.62±0.10, n=5), detected in averaged magnitude spectra of subregions in subcutaneous EL4 tumours (n=5).
b: Intensities of the fitted peak amplitudes of the corresponding pH-compartments detected in the magnitude spectra from EL4 subregions relative to the intensity of the physiologic compartment in this region. Intensities from C1 and C5 peak of ZA of one compartment were averaged.