3019
A new open-source quality assurance protocol for unbiased 13C coil comparison across sites1Department of Health Technology, Technical University of Denmark, Kgs. Lyngby, Denmark, 2Cancer Research UK Cambridge Institute, University of Cambridge, Cambridge, United Kingdom, 3MR Research Centre, Department of Clinical Medicine, Aarhus University, Aarhus, Denmark, 4Department of Clinical Physiology, Nuclear Medicine and PET, Rigshospitalet, Copenhagen, Denmark, 5Danish Research Centre for Magnetic Resonance, Centre for Functional and Diagnostic Imaging and Research, Copenhagen University Hospital Hvidovre, Hvidovre, Denmark, 6GE Healthcare, Brøndby, Denmark
Synopsis
We propose a new quality assurance (QA) protocol for signal to noise ratio (SNR) evaluation of 13C receive coils to both guide coil developments and assist the choice of the best suited coil for a given hyperpolarized 13C MR experiment. The protocol allows fair comparison of coils with different number of elements and comparison across scanner vendors. The protocol was used to test and compare seven different coils at three different MR sites, which provided insights into coil performance, trade-offs, and malfunctions. All data and source code are shared publicly online.
Introduction
RF coil performance is crucial for the success of any MR experiment, but even more when low SNR cannot be compensated by prolonged acquisition time, and for acquisition at frequencies of low-gamma nuclei. These are the terms for hyperpolarized 13C MRI.1 With the first multicenter clinical trials on the horizon,2,3 the need for standardized quality assurance (QA) of RF hardware is further emphasized.The purpose of this study is to establish a QA protocol for 13C RF receive coil SNR evaluation, to facilitate regular coil tests and comparisons locally, across sites, and globally (in future literature).
Methods
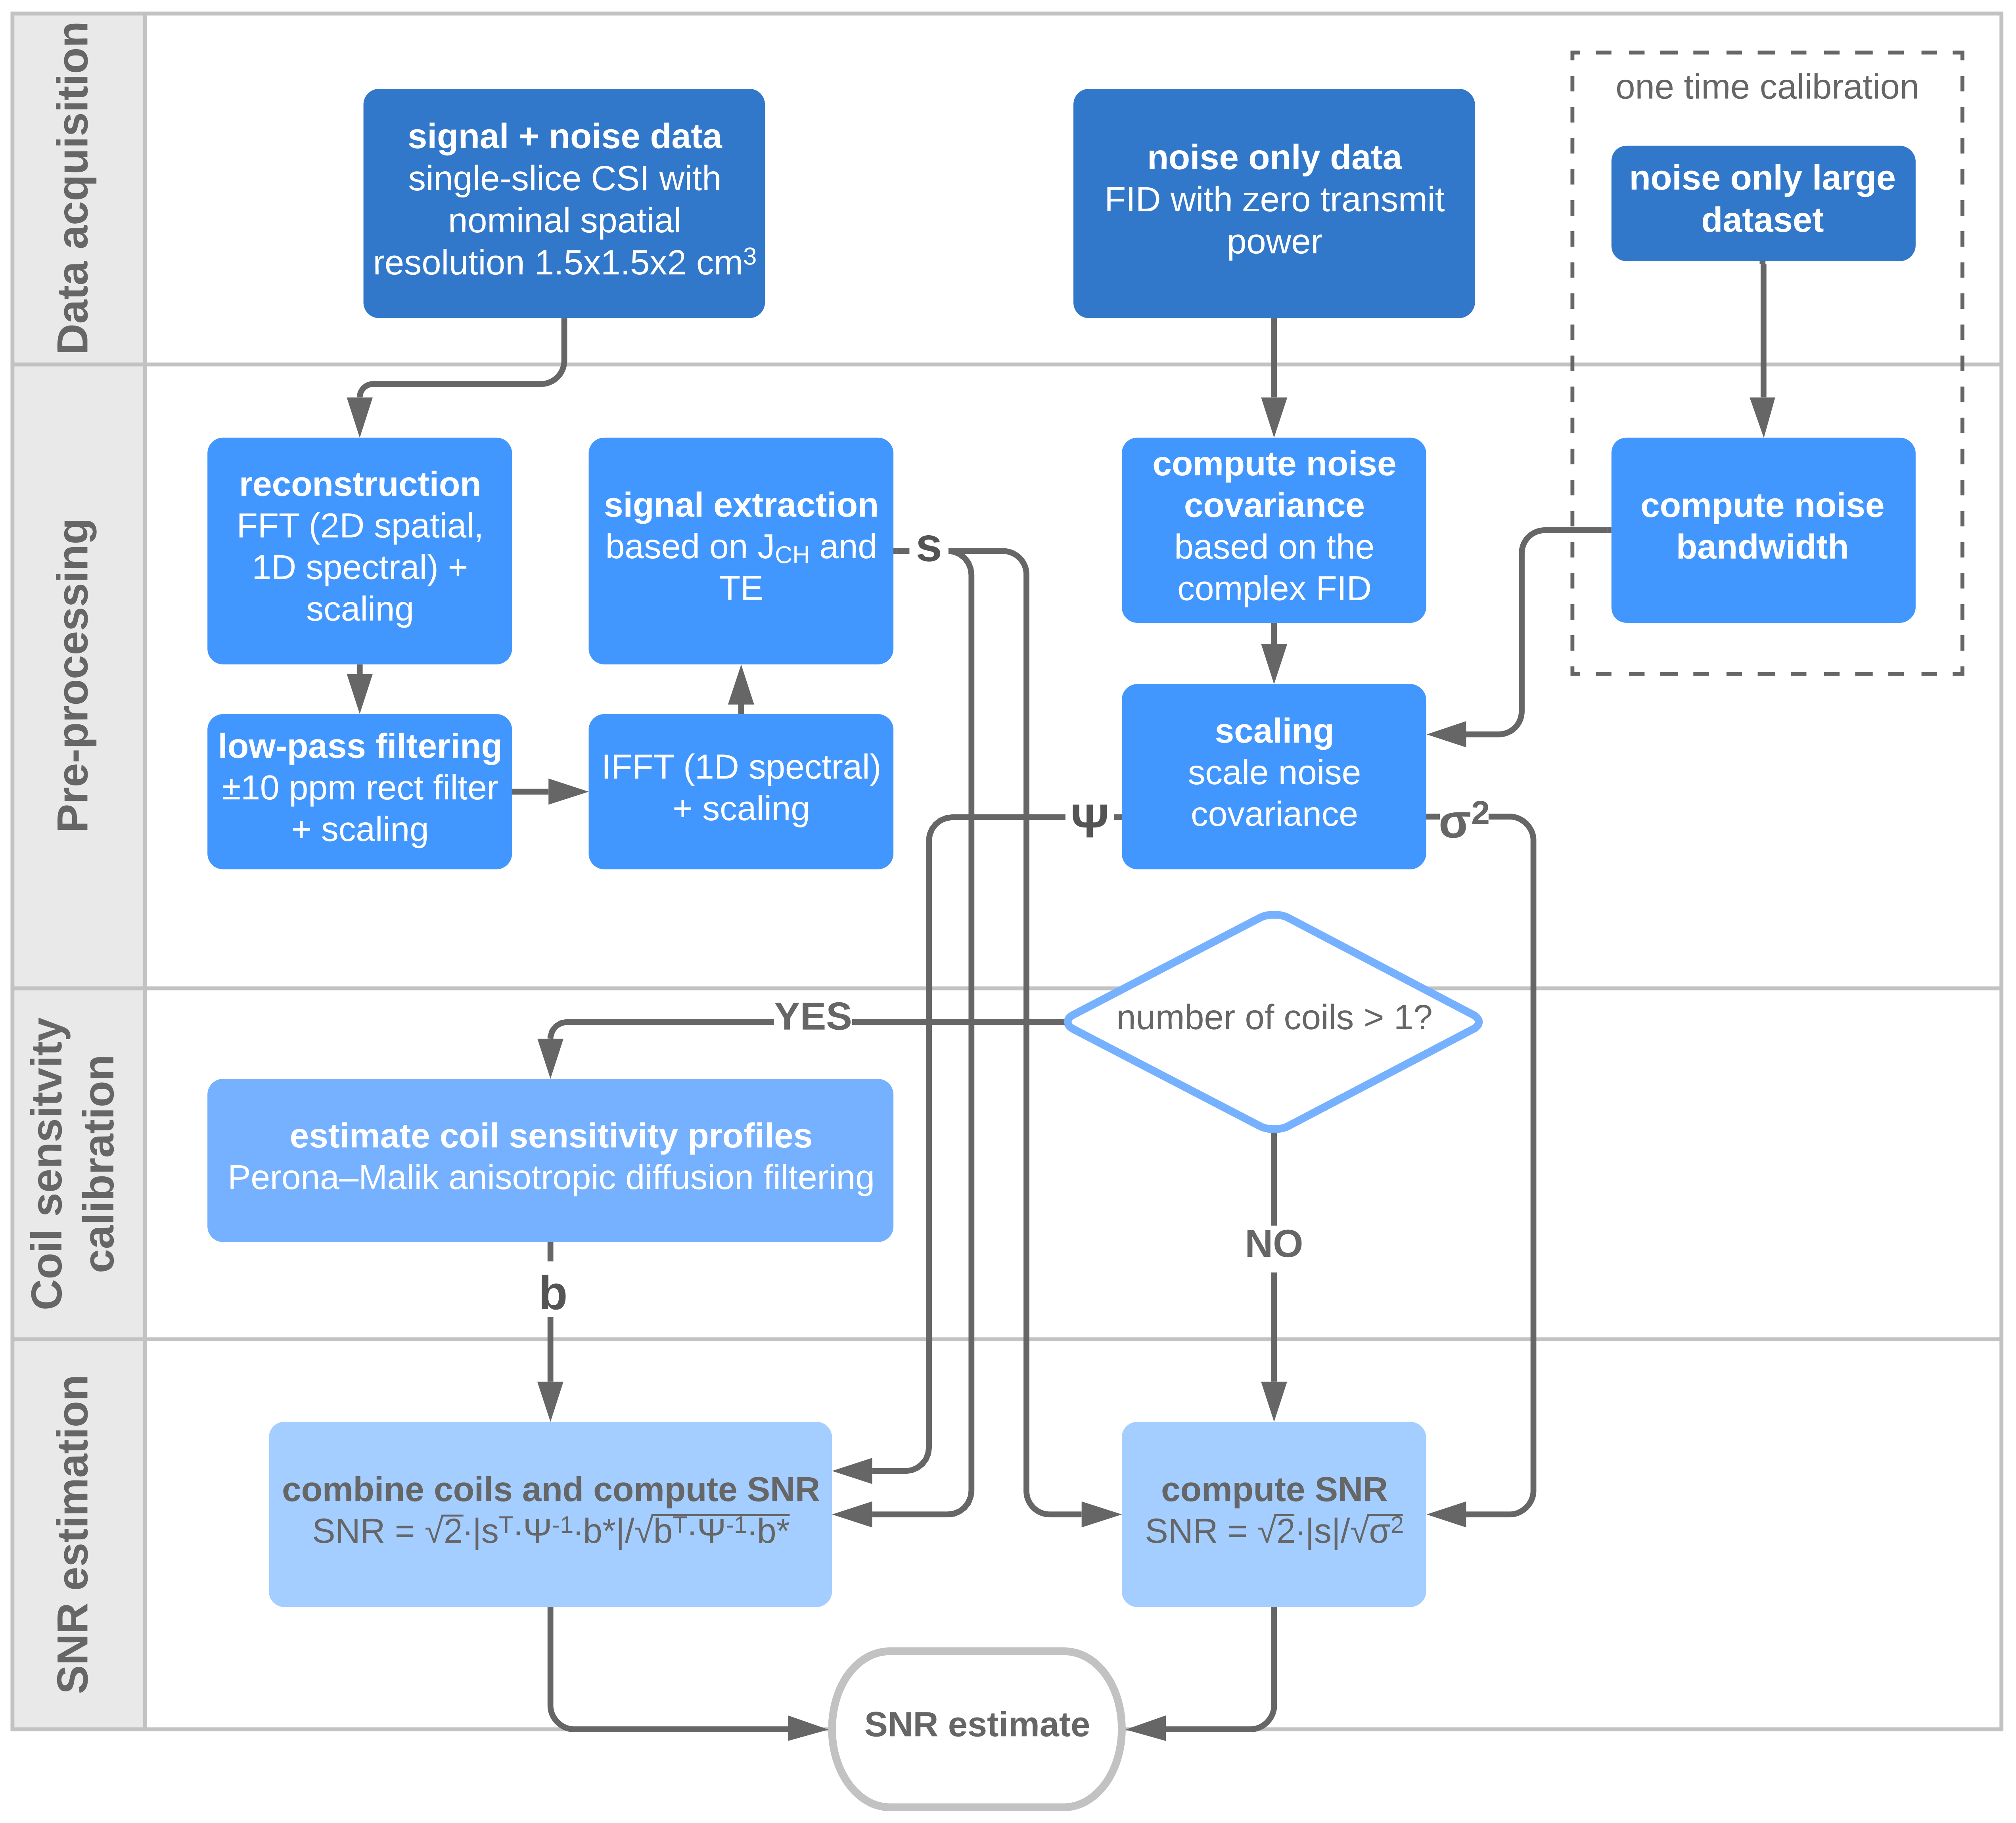
QA protocolThe QA protocol, summarized in Figure 1, follows the SNR estimation principles described by Kellman & Mcveigh.4
The protocol is based on imaging with a non-enriched 13C ethylene glycol phantom. MR spectroscopic data are acquired at the ethylene glycol center peak resonance using a CSI sequence, chosen due to its robustness and availability in most scanner’s standard software (including necessary raw data access). Sequence parameters: FOV = 36x36 cm2, slice thickness = 20 mm, matrix = 24x24, flip angle = 70°, TR = 1000 ms, spectral bandwidth = 5000 Hz, FID points = 1024. Total acquisition time is 9 min 36 s. A separate measurement is required for noise estimation (non-localized FID with TR = 1000 ms, spectral bandwidth = 5000 Hz, FID points = 1024, and flip angle = 0° (ia_rf1 = 0 for GE systems)). A scanner-dependent noise bandwidth factor needs to be estimated based on a one time, noise-only measurement as described in.4
Image reconstruction of the raw CSI data is based on signal data extraction from the first in-phase time point of the FIDs, instead of peak amplitude, to minimize signal variations from shimming and resulting spectral linewidths. The coil noise covariance matrix, which for single-receiver coils is a scalar representing noise variance, is estimated from the complex noise FID and scaled by the noise bandwidth factor.
Coil combination for arrays is done using sensitivity profiles extracted from the data.5
Coil comparison
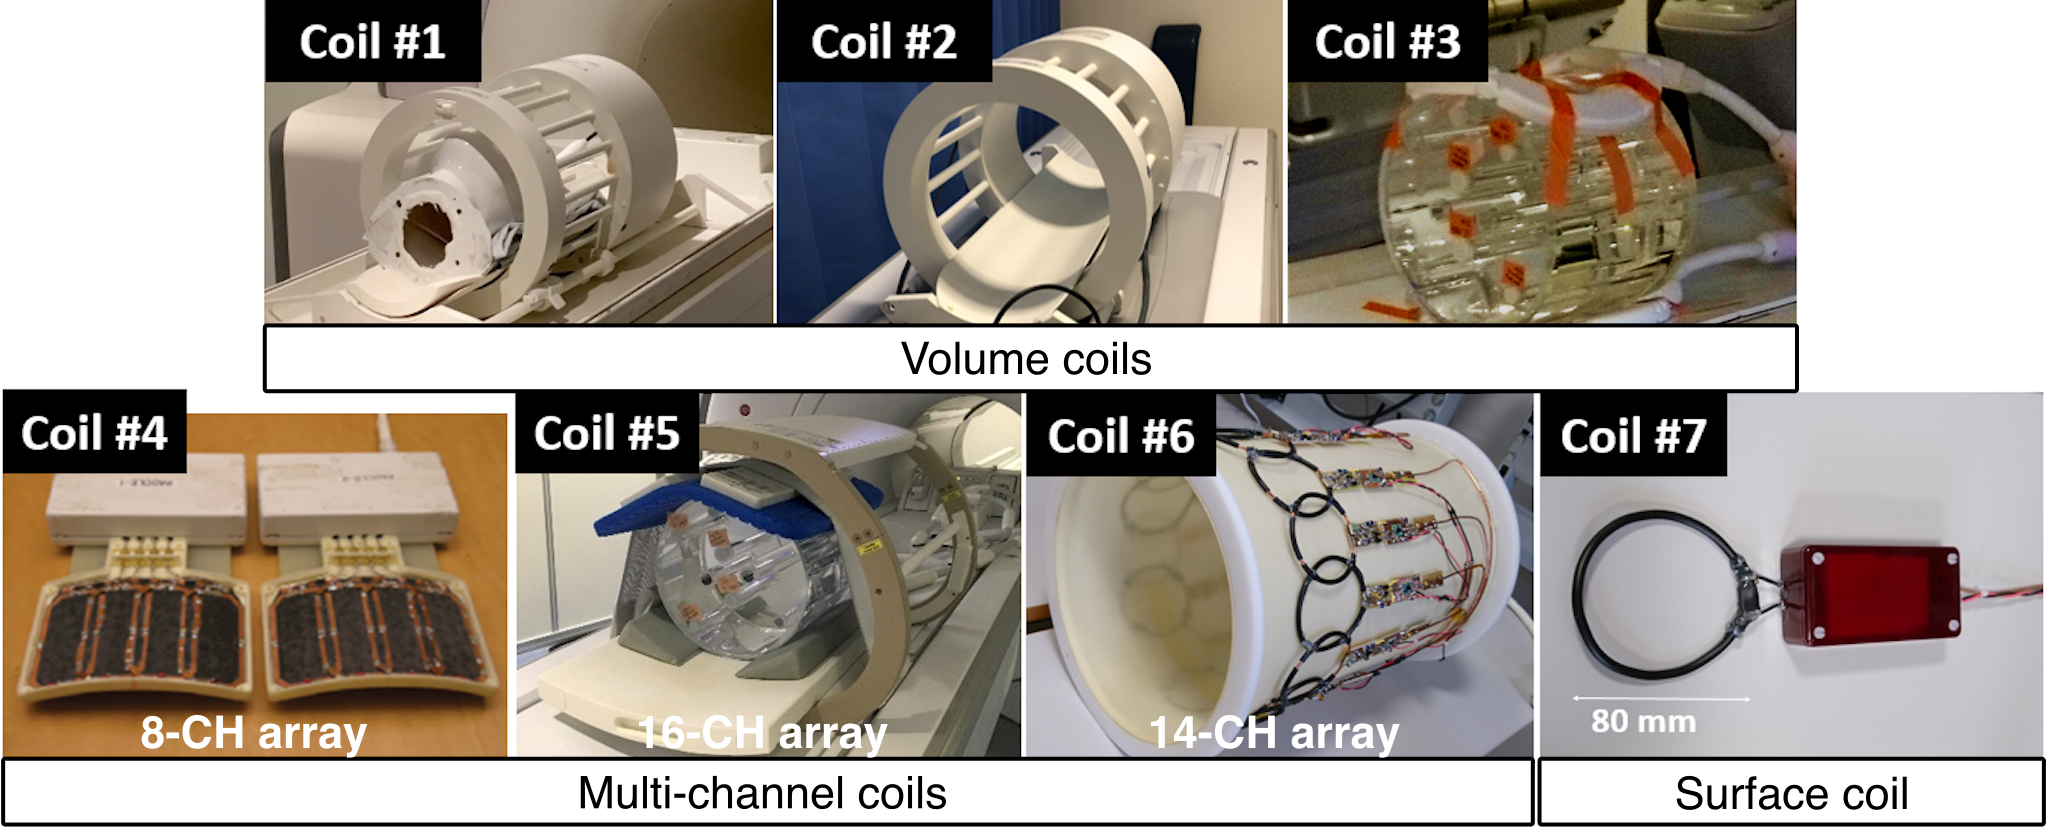
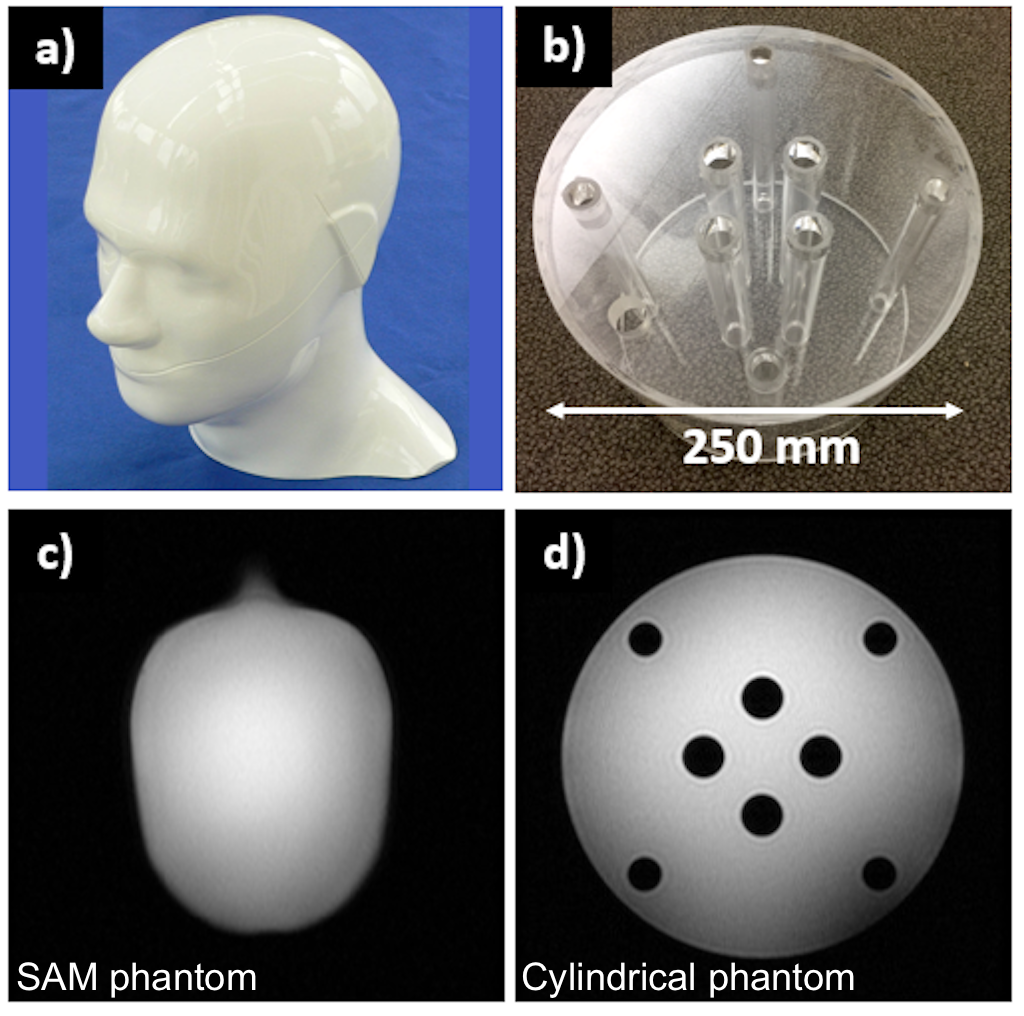
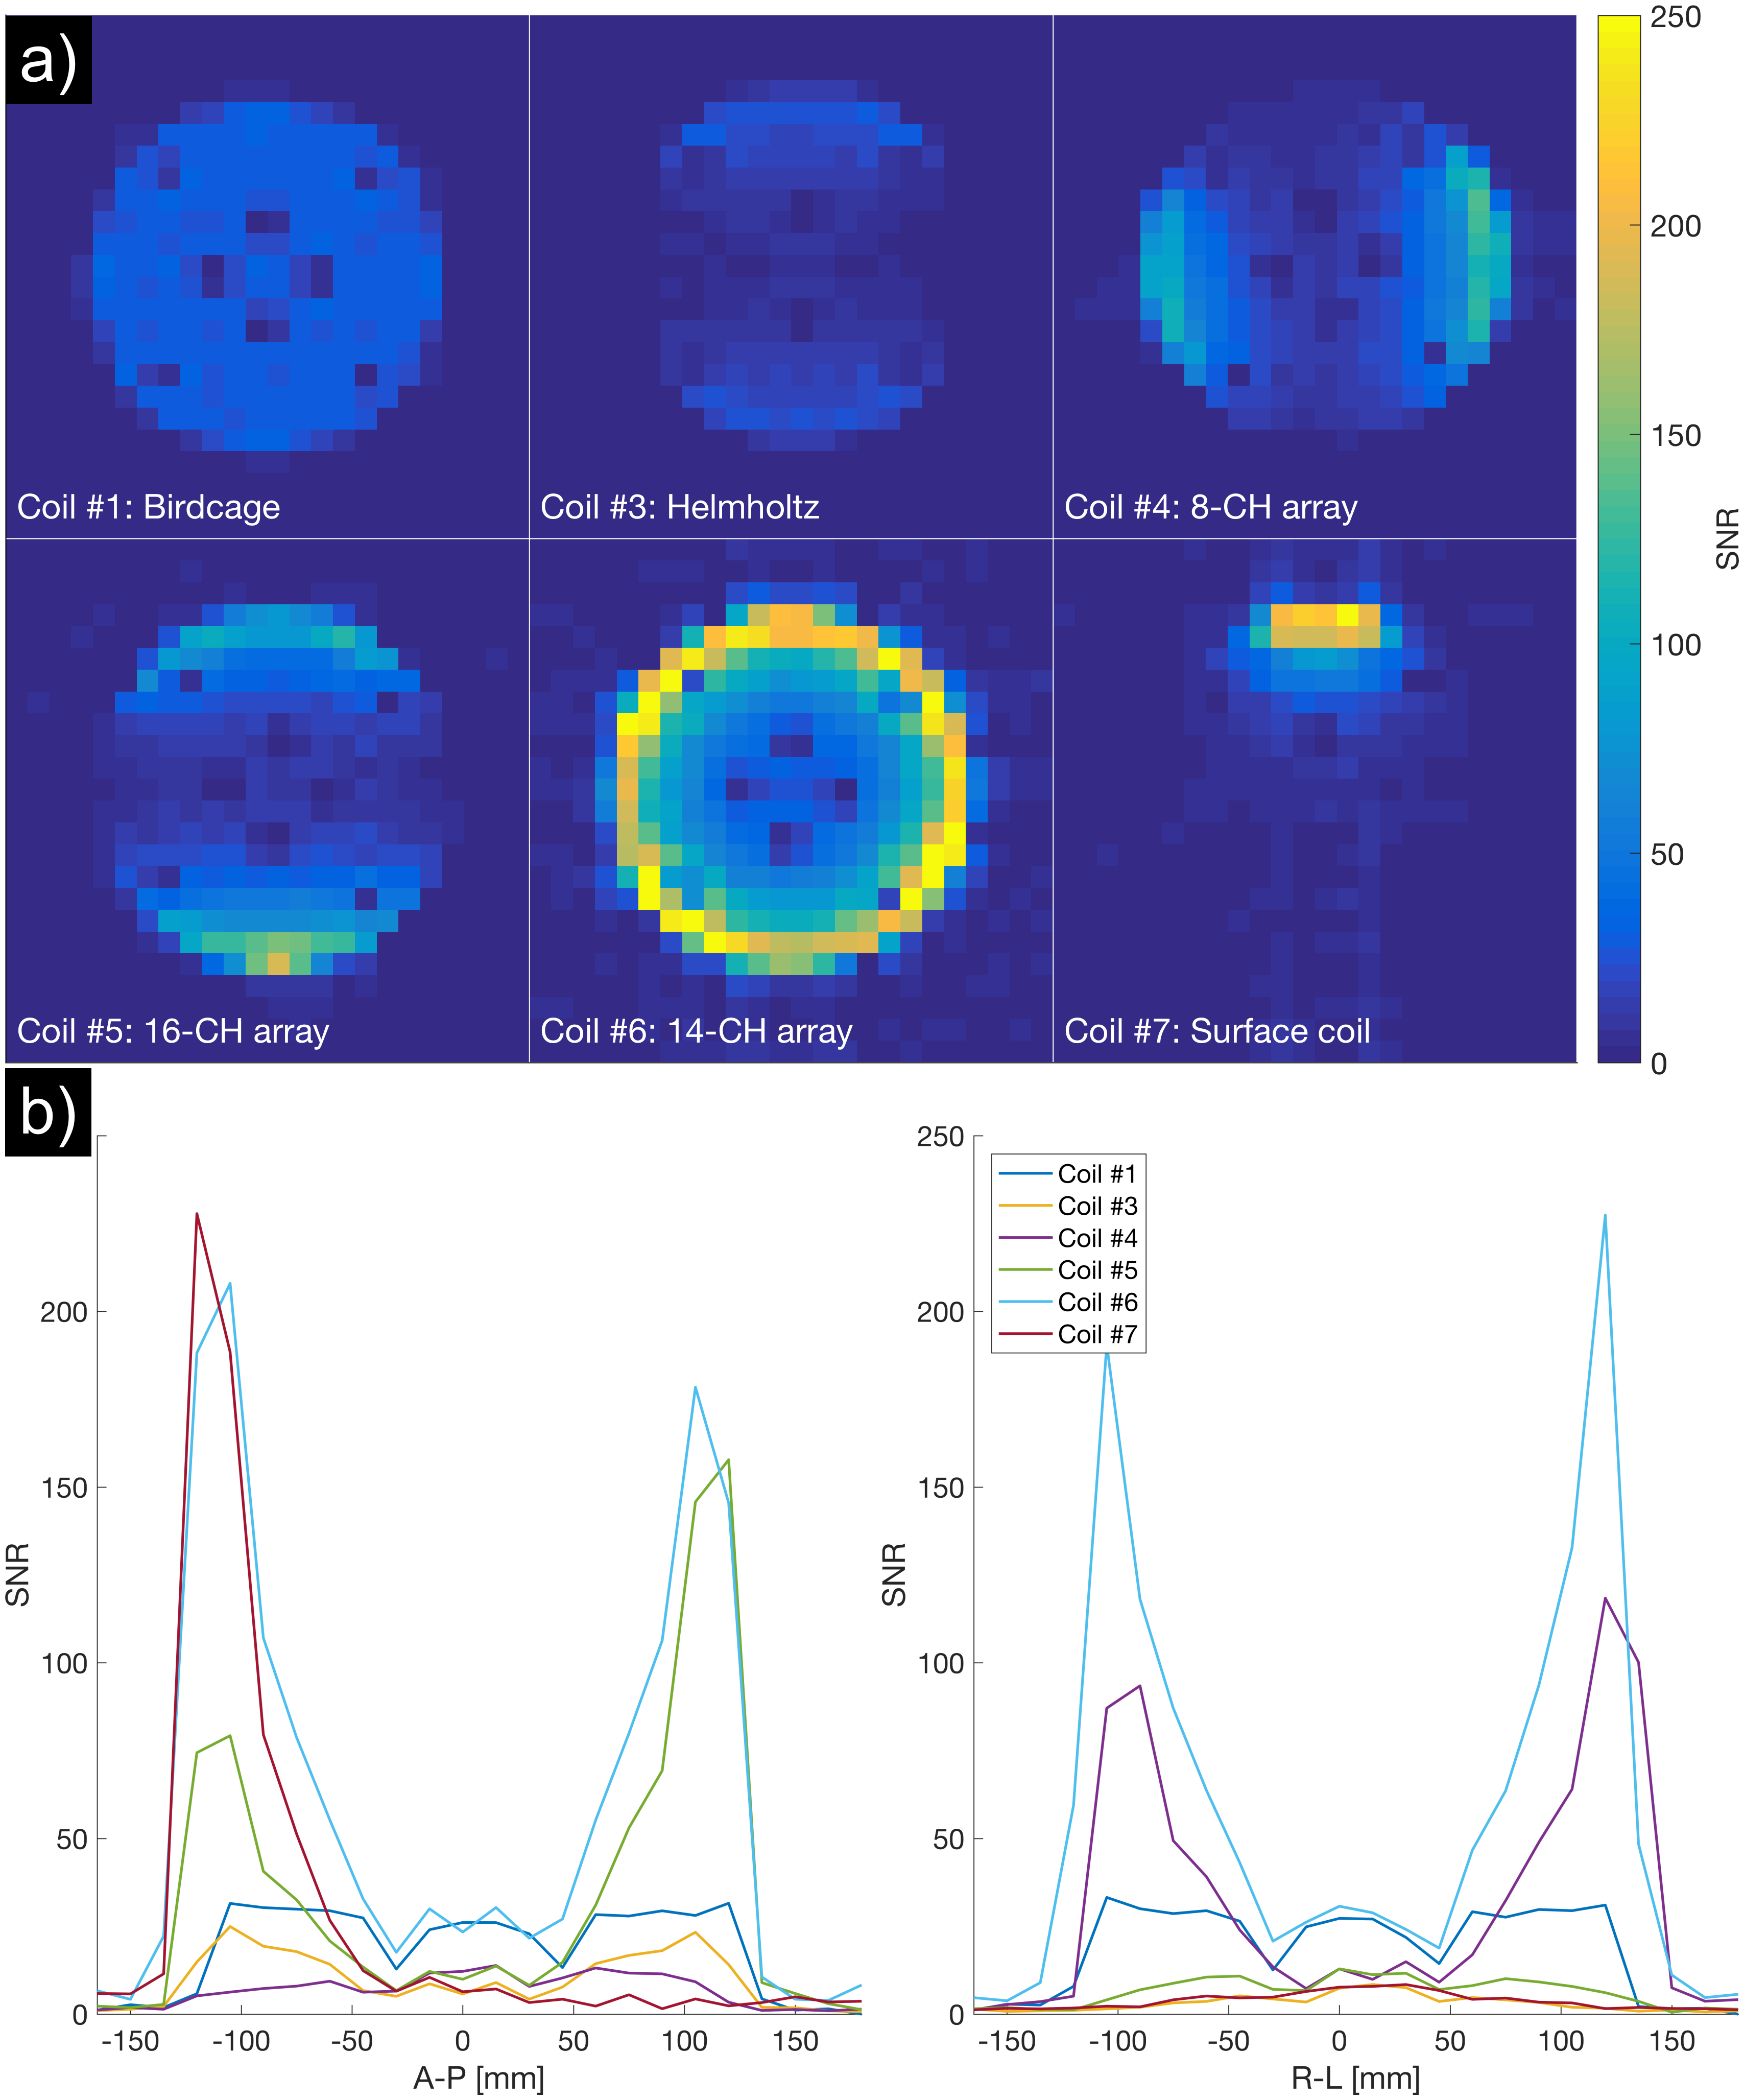
Seven different coils (Figure 2) were compared using two different ethylene glycol phantoms (“SAM” and “cylindrical”) (Figure 3). The coils include volume coils (Coils #1-3), multi-channel coils (Coils #4-6) and a single-channel surface coil (Coil #7). Coils #1-4 and #6-7 were tested using the SAM phantom, and Coils #1 and #3-7 using the cylindrical phantom. All receive-only coils were used jointly with a clamshell-type 13C transmit coil (RAPID Gmbh).
Data were acquired for three separate 3T MRI systems: a Siemens Biograph mMR PET/MR scanner at Rigshospitalet (Copenhagen, DK) and two GE Discovery MR750 scanners, one at Aarhus University Hospital (Aarhus, DK) and one at Addenbrooke's Hospital (Cambridge, UK).
RF power was calibrated using non-localized excitation and different approaches for the Siemens system6 and the GE systems.7 Siemens raw data were read using the FID-A toolkit8 and GE raw data using GE provided reading routines.
Results
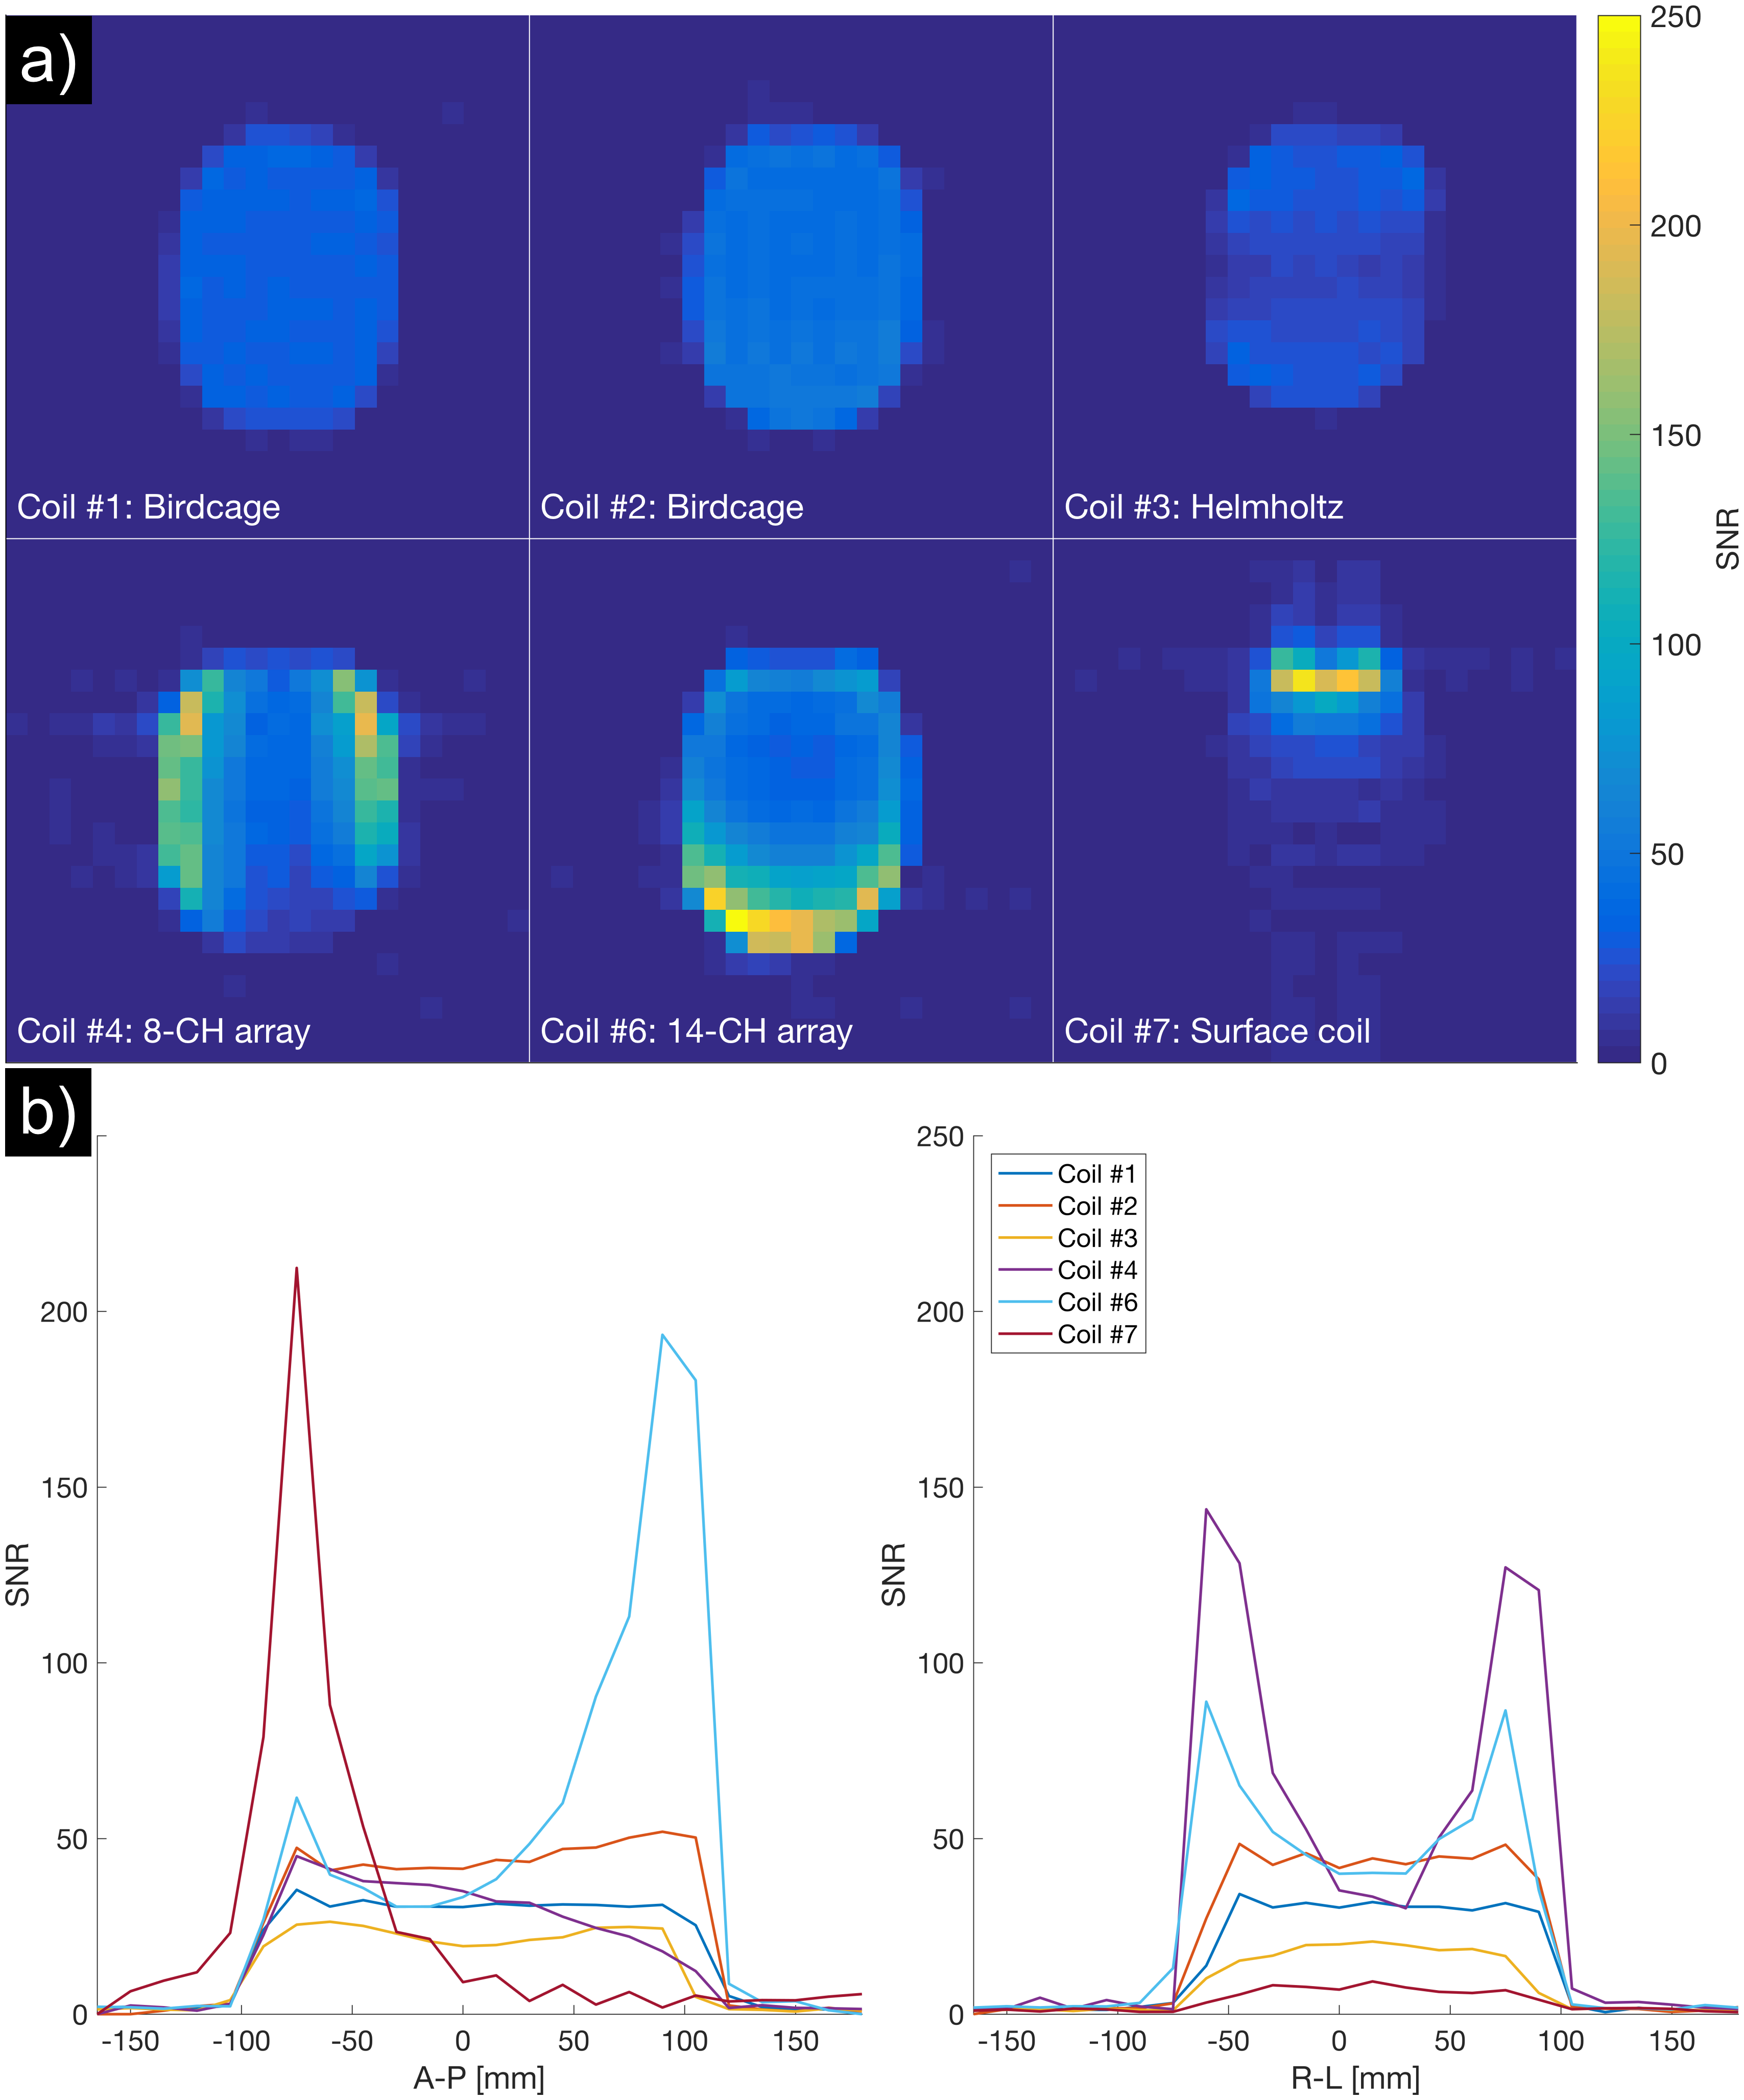
The QA protocol was implemented at three different MR sites for two different scanner vendors and enabled a 13C coil comparison study of seven different coils.The SNR results from the 13C coil comparison are shown in Figure 4 and 5 and illustrate trade-offs for central vs. superficial SNR and homogeneity. The results reveal variability in coil performance, e.g. 110 % SNR difference between volume coils at the phantom center in Figure 4. The QA protocol also revealed one faulty element for Coil #4.
Discussion
Special care was taken to assure an unbiased SNR comparison both across vendors by accounting for scanner-specific filters, and between coils with different numbers of elements by performing sensitivity-based coil combination. The SNR statistics of sensitivity-combined magnitude images follow those of a single-receiver system; a Rician distribution, and hereby provide an even starting point when comparing SNRs of arrays and volume coils. This is not the case for sum-of-squares combined images with SNR statistics that follow a non-central chi distribution.9The source code assumes ethylene glycol signal for SNR evaluation, but can be adapted for other phantoms,10 if deemed favorable. Consensus is, however, important if the community is to draw maximum benefit of across site 13C coil QA.
Besides SNR estimation the source code also provides estimates of noise correlations,11 G-factors,12 and T2* values.
To extend the protocol for evaluation of coil volumetric coverage as in,13 the QA protocol can be repeated for different scan planes.
Finally, it should be stated that the repeatability and reproducibility of the SNR estimates are highly dependent on accurate RF power calibration, which is not standardized for 13C MR. Additionally, the reported receive coil performance cannot be viewed independently of the transmit coil or the scanner's receiver characteristics.
Conclusion
The proposed QA protocol will aid local 13C coil tests to reveal coil malfunctions and to choose the best suited coil for a given imaging target. But more importantly, the protocol can guide design decisions for coil developments across sites and MR vendor systems.All source code and data are provided at14 to enable easy implementation at other MR facilities.
With the open-source availability of the source code, we hope that the 13C community will feel encouraged to contribute with additional coil data and feedback.
Acknowledgements
This work has been partly funded by the Danish Council for Independent Research (DFF – 4005-00531) and the Danish National Research Foundation (DNRF124).References
1. Ardenkjær-Larsen JH, Fridlund B, Gram A, et al. Increase in signal-to-noise ratio of > 10,000 times in liquid-state NMR. Proc. Natl. Acad. Sci. U. S. A. 2003;100(18):10158–10163.
2. Kurhanewicz J, Vigneron DB, Ardenkjær-Larsen JH, et al. Hyperpolarized 13C MRI: Path to Clinical Translation in Oncology. Neoplasia 2019;21(1):1–16.
3. Wang ZJ, Ohliger MA, Larson PE, et al. Hyperpolarized 13C MRI: State of the Art and Future Directions. Radiology 2019;291(2):273–284.
4. Kellman P, McVeigh ER. Image Reconstruction in SNR Units: A General Method for SNR Measurement. Magn. Reson. Med. 2005;54:1439–1447.
5. Hansen RB, Sánchez-Heredia JD, Bøgh N, et al. Coil profile estimation strategies for parallel imaging with hyperpolarized 13C MRI. Magn. Reson. Med. 2019;82(6):2104–2117.
6. Hansen RB, Gutte H, Larsen MM, et al. Characterization and flip angle calibration of 13C surface coils for hyperpolarization studies. In: Proc. Intl. Soc. Mag. Reson. Med. ; 2017. p. 3042.
7. Schulte RF, Sacolick LI, Deppe MH, et al. Transmit gain calibration for nonproton MR using the Bloch-Siegert shift. NMR Biomed. 2011;24(9):1068–1072.
8. Simpson R, Devenyi GA, Jezzard P, Hennessy TJ, Near J. Advanced processing and simulation of MRS data using the FID appliance (FID-A)—An open source, MATLAB-based toolkit. Magn. Reson. Med. 2017;77(1):23–33.
9. Constantinides CD, Atalar E, Mcveigh ER. Signal-to-Noise Measurements in Magnitude Images from NMR Phased Arrays. Magn. Reson. Med. 1997;38:852–857.
10. Reed GD, Schulte RF, Park JM, Malloy CR, Hansen RB, Chen AP. Protocol for multi-site quantitative evaluation of 13C radio frequency coils. In: Proc. Intl. Soc. Mag. Reson. Med. ; 2019. p. 2510.
11. Tunnicliffe E, Graves MJ, Robson MD. Use of the noise covariance matrix in array coil quality assurance. In: Proc. Intl. Soc. Mag. Reson. Med. ; 2011. p. 4548.
12. Hansen MS. Source code for the ISMRM Sunrise Recon Course. GitHub. https://github.com/hansenms/ismrm_sunrise_matlab. Published 2014. Accessed April 12, 2018.
13. Autry AW, Gordon JW, Carvajal L, et al. Comparison between 8- and 32-channel phased-array receive coils for in vivo hyperpolarized 13C imaging of the human brain. Magn. Reson. Med. 2019;82(2):833–841.
14. Olin RB. Source code for 13C coil QA protocol. GitHub. https://github.com/rbecko/CoilQA_13C. Published 2019. Accessed October 31, 2019.
Figures