3014
Distinguishing metabolic signals of liver tumors from surrounding liver cells using hyperpolarized 13C MRI and Gadoxetate
Shubhangi Agarwal1, Jeremy Gordon1, Natalie Korn1, Robert A Bok1, Cornelius von Morze2, Daniel B Vigneron1, John Kurhanewicz1, and Michael Ohliger1,3
1Department of Radiology and Biomedical Imaging, University of California, San Francisco, San Francisco, CA, United States, 2Biomedical Magnetic Resonance Laboratory, Washington University School of Medicine, St. Louis, MO, United States, 3Liver Center, University of California, San Francisco, San Francisco, CA, United States
1Department of Radiology and Biomedical Imaging, University of California, San Francisco, San Francisco, CA, United States, 2Biomedical Magnetic Resonance Laboratory, Washington University School of Medicine, St. Louis, MO, United States, 3Liver Center, University of California, San Francisco, San Francisco, CA, United States
Synopsis
Hyperpolarized (HP) 13C MRI is a promising technique that can assess the metabolic pathways in a variety of tumors non-invasively and in real time. In this study, we show the ability of a gadolinium-based contrast agent (gadoxetate) to selectively suppress the HP metabolic signal arising from normal hepatocytes by altering the relaxation rates of metabolites 13C pyruvate and 13C lactate in order to evaluate the metabolic profile of tumors within the liver.
Purpose
Improved metabolic imaging of liver tumors is important clinically, particularly for colon cancer metastases to the liver. Imaging liver tumor metabolism could assist in studying tumor viability, heterogeneity, aggressiveness, treatment response, tumor prognosis and to study metabolic biomarkers for development of novel therapies. Molecular imaging strategies such as FDG-PET have limited sensitivity for small intrahepatic lesions due to high background metabolism of normal hepatocytes. The metabolic conversion of pyruvate to lactate is upregulated in many tumors, a phenomenon known as the Warburg effect1. Conversely, hyperpolarized (HP) 13C MRI is a powerful emerging molecular imaging technique for evaluating metabolism in vivo1 but it is not selective for different cell types. Gadoxetate (Eovist™, Bayer Pharmaceuticals) is an FDA-approved gadolinium-based contrast agent that is used routinely for visualizing liver tumors. Gadoxetate is selectively taken into hepatocytes but excluded from tumors due to lack of organic anion transporting polypeptide 1 (OATP12). Gadoxetate has been previously shown to selectively suppress the metabolic signal arising from the liver as compared to kidneys3. In this study, we separate the metabolic signals arising from tumor cells by using gadoxetate to selectively quench the background signals arising from normal hepatocytes.Methods
CC531 rat-derived colon cancer cells (Cell Lines Services, Heidelberg Germany, 0.5-1 x 10⁶ cells) were implanted into the livers of WAG-Rij rats (n = 2, Charles River Laboratories). Hyperpolarization of 1-13C Pyruvate (24 ml) was performed using a 3.35T dynamic nuclear polarizer (Hypersense, Oxford Instruments) at 1.35 K for one hour. The hyperpolarized pyruvate was rapidly dissolved with superheated 80 mM NaOH dissolution buffer and 2-2.5 mL was injected into each rat over 12 secs. Imaging was performed on a clinical 3T MRI (Bruker BioSpin) scanner with multinuclear imaging capability and a dual tuned 1H/13C volume coil. T1-weighted (FLASH, TE=4 ms TR=230ms NEX 4 and 60o FA) and T2-weighted images (RARE, TE=45ms TR=2s NEX 8) with FOV of 50 x 50 mm and 1 mm slice thickness were acquired before and after administration of gadoxetate. Dynamic 13C images of pyruvate and lactate were acquired using a 2D CSI sequence, beginning 25 sec after the start of the HP 1-13Cpyruvate injection with a temporal resolution of 4.25 s for a total of 1 min and 15 time-frames. Images were acquired with a FOV of 50 x 50 mm, matrix size of 8 x 8, 8 mm slice thickness and flip angle of 5 degrees. 13C images were acquired prior to and 15 minutes following injection of gadoxetate (0.1 mmol/kg). Metabolite maps were obtained via SIVIC12 and analyzed using MATLAB scripts. Metabolite maps (pyruvate and lactate) were analyzed from two different ROIs: one through normal liver (red, figure 1) and one through liver tumor (green, figure 1).Results
Proton images show expected hepatocyte enhancement following gadoxetate administration, with tumors appearing as defects in gadoxetate uptake (Fig 1). Under the influence of gadoxetate, the lactate/pyruvate ratio in normal livers reduced from 0.48 to 0.29 (40%), while lactate/pyruvate ratio in the tumors remained close to 1 (approximately no suppression, Fig 2).Discussion and Conclusion
We have reported the ability to produce high quality hyperpolarized 13C images post administration of gadoxetate despite the presence of residual gadolinium circulating in the bloodstream. In this study we observed higher suppression in liver and almost negligent suppression in the lactate to pyruvate ratio. We hypothesize that this difference in suppression is likely becuase 25 seconds duration between HP pyruvate injection facilitates the accumulation of pyruvate within the intracellular regions of liver and tumor, where the gadoxetate is able to interreact with the accumulated metabolites. The use of targeted relaxation agents with selective compartmentalization is a novel and promising tool for increasing the specificity of hyperpolarized 13C MRI. Gadoxetate was able to successfully suppress the hyperpolarized 13C signal arising from hepatocytes as compared to tumors. Further experiments in a larger sample size are required to confirm these observations.Acknowledgements
This study was funded by grants from the UCSF Liver center, Radiological Society of North America Research and Education Foundation and the National Institutes of Health (P30DK026743, K01DK099451, R21EB023605 and P41EB013598).References
1. Kurhanewicz J. et al Neoplasia 13:81-97 (2011),
2. Leonhardt M et al Drug Metab Dispos. 38:1024–1028 (2010),
3. Ohliger, M. A. et al. Magn Reson Med 77, 2356–2363 (2017).
Figures
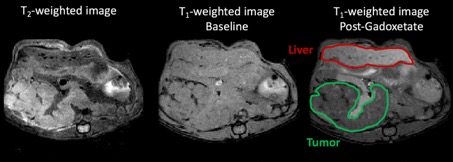
Fig 1: T2-weighted
image and T1-weighted image of the tumor and liver pre and post
gadoxetate administration. The tumor (green) and liver (red) regions are
delineated and metabolite maps from these regions were analyzed.
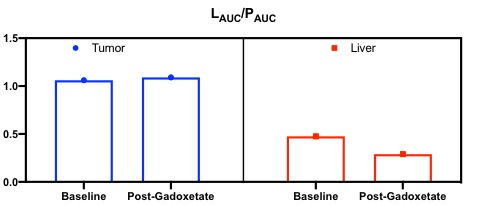
Fig 2: Comparison of lactate to pyruvate ratio
before and after gadoxetate in tumor and liver. We observe suppression in the liver.
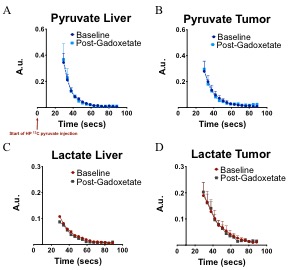
Fig 3: Dynamic pyruvate and lactate signal (normalized
to pyruvate area under the curve) arising from liver and tumor before and after
gadoxetate administration. The graphs show the conversion of pyruvate to
lactate in liver and tumors. As expected the lactate was higher in tumors as
compare to liver.
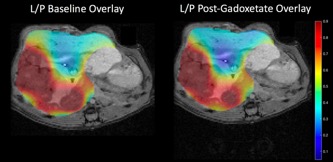
Fig 4: Lactate/pyruvate area under the curve ratios
overlaid on a post gadoxetate T1-weighted image.