3013
Flow-Suppressed Metabolic Imaging of Hyperpolarized [1-13C]Pyruvate in the Healthy Rat Brain In Vivo
Minjie Zhu1, Aditya Jhajharia1, and Dirk Mayer1
1Diagnostic Radiology & Nuclear Medicine, University of Maryland Baltimore, Baltimore, MD, United States
1Diagnostic Radiology & Nuclear Medicine, University of Maryland Baltimore, Baltimore, MD, United States
Synopsis
Dynamic metabolic imaging was used to investigate the origin of the lactate signal in rat brain after injection with hyperpolarized (HP) [1-13C] pyruvate. In order to suppress signal with vascular components, we applied a bipolar gradient pulse with different duration prior to data acquisition. The presented results provide further evidence that transport of HP pyruvate into the brain and its subsequent conversion to lactate is limited by blood-brain barrier transport and that the majority of the HP lactate observed in brain was indeed produced there.
Introduction
Metabolic imaging of hyperpolarized (HP) 13C-pyruvate has been applied in multiple rodent studies to investigate brain metabolism in healthy animals1-5 and disease models such as brain tumor6-11, traumatic brain injury12,13, and neuroinflammation14. A recent report by Miller et al.15 concluded: “earlier reports of whole-brain metabolism in anesthetized animals may be confounded by partial volume effects and not informative enough for translational studies” after the authors did not observe HP 13C-lactate in the brain of healthy rats or in normal-appearing brain tissue of animals with brain tumors. The goal of this study was to further investigate the origin of the lactate signal in rat brain after injection with HP [1-13C]pyruvate. To this end, we used a dynamic spiral chemical shift imaging(spCSI) sequence16 that was modified to include a bipolar gradient pulse prior to data acquisition to suppress signal components from flowing spins17.Methods
All measurements were performed on a clinical 3T GE 750w MR scanner (GE Healthcare, Waukesha, WI, USA) using a 1H-13C dual-tuned RF coil (i.d. = 50 mm) for both excitation and signal reception. The gradient system had a maximum amplitude of 33 mT/m and a slew rate of 120 T/m/s. In vivo experiments using spCSI sequence without and with different bipolar gradient widths W (6ms and 9.6ms for a single lobe, 30 mT/m along z and 23.3 mT/m along x and y) were performed on two healthy male Wistar rats (265-270g body weight). Animals were anesthetized with isoflurane (1.7-2% in 1L/min O2) throughout the imaging session. Each rat received a 1µmol/g dose of 125mM hyperpolarized pyruvate (approximately 2.2 mL) injected over ~6 seconds through a tail vein catheter, followed by 0.5mL saline flush. Scan parameters for the 2D dynamic spCSI sequence were: 40mm FOV, 2.5x2.5mm2 nominal in-plane resolution, 10mm slice thickness in axial orientation (animal coronal) centered in the middle of the brain, 8 spatial interleaves, 280Hz spectral width with 24 echoes, 3s temporal sampling. The echo time (TE) was adjusted for the different suppression levels: TE=5.6ms for W=0, TE=16ms for W=6ms, and TE=23.2ms for W=9.6ms. A constant 5.625° flip angle excitation with 16 time points over 48 seconds (starting at 6s after the start of pyruvate injection) were used for the first rat. A variable flip angle scheme, $$$ \theta_i = \arctan{\frac{1}{\sqrt{48 - i}}} $$$, was used for the 48 excitations for 6 time points over 18 seconds (starting at 9s after the start of pyruvate injection) for the second rat. The imaging order was: W = 6ms, W = 0, and W = 9.6ms for both animals.Results and Discussion
Time-averaged metabolic maps of pyruvate and lactate from three acquisitions with different suppression levels from the two animals are shown in Figure 1. For each map only the data corresponding to the 19 echoes starting at TE=23.2ms was used achieve the same T2* weighting. Three regions of interest (ROIs) were selected to quantify the effect of flow suppression – brain, vasculature, and tongue/muscle tissue. Figure 2 shows the mean pyruvate and lactate intensity in the brain and vascular ROIs normalized to the mean lactate of tongue/muscle ROI for each acquisition to correct for different polarization levels. The signal reduction relative to the acquisition without flow suppression for pyruvate and lactate in the selected ROIs averaged for the two animals are shown in Figure 3. As expected, the strongest signal reduction was observed in the vascular ROI for both pyruvate and lactate that increased with duration of the suppression pulse. Pyruvate in the brain ROI showed similar behavior. This is consistent with transport across the blood-brain barrier (BBB) being the rate-limiting step in the production of HP lactate in brain and the pyruvate observed in the brain ROI being predominately in the cerebral blood volume1. In contrast, lactate in the brain ROI showed the least amount of reduction, only about 20% for both suppression levels. Altogether these results suggest that the brain lactate signal is predominantly stationary or slower moving. Dynamic 13C data of rat 1 acquired with 6 ms bipolar gradient width are shown in Figures 4 and 5. Although the transport of lactate across the BBB is on the order of 3 to 10 times faster compared to pyruvate18 the early appearance of lactate in the brain ROI strongly supports that the lactate signal in rat brain was most likely due to metabolic conversion of pyruvate in the brain, rather than lactate being produced in other organs, released into the circulatory system, and eventually taken up by the brain.Conclusion
The presented results provide further evidence that transport of HP pyruvate into the brain and its subsequent conversion to lactate is limited by BBB transport. The data further supports that the majority of the HP lactate observed in the brain was indeed produced there rather than due to partial volume effects or uptake of lactate elsewhere in the body. Therefore, metabolic imaging of HP pyruvate could be a useful tool for the investigation of brain metabolism in rodent studies.Acknowledgements
This work was supported by NIH grants R21 NS096575, R01 DK106395, R21 CA213020, and R21 CA202694.References
- Hurd, Ralph E., et al. "Cerebral dynamics and metabolism of hyperpolarized [1-13C] pyruvate using time-resolved MR spectroscopic imaging." Journal of Cerebral blood flow & metabolism 30.10 (2010): 1734-1741.
- Mayer, Dirk, et al. "Dynamic and high‐resolution metabolic imaging of hyperpolarized [1‐13C]‐pyruvate in the rat brain using a high‐performance gradient insert." Magnetic resonance in medicine 65.5 (2011): 1228-1233.
- Josan, Sonal, et al. "Effects of isoflurane anesthesia on hyperpolarized 13C metabolic measurements in rat brain." Magnetic resonance in medicine 70.4 (2013): 1117-1124.
- Park, Jae Mo, et al. "Measuring mitochondrial metabolism in rat brain in vivo using MR Spectroscopy of hyperpolarized [2‐13C] pyruvate." NMR in biomedicine 26.10 (2013): 1197-1203.
- Marjańska, Małgorzata, et al. "Brain metabolism under different anesthetic conditions using hyperpolarized [1‐13C] pyruvate and [2‐13C] pyruvate." NMR in Biomedicine 31.12 (2018): e4012.
- Park, Ilwoo, et al. "Hyperpolarized 13C magnetic resonance metabolic imaging: application to brain tumors." Neuro-oncology 12.2 (2010): 133-144.
- Day, Sam E., et al. "Detecting response of rat C6 glioma tumors to radiotherapy using hyperpolarized [1‐13C] pyruvate and 13C magnetic resonance spectroscopic imaging." Magnetic resonance in medicine 65.2 (2011): 557-563.
- Park, Jae Mo, et al. "Metabolite kinetics in C6 rat glioma model using magnetic resonance spectroscopic imaging of hyperpolarized [1‐13C] pyruvate." Magnetic resonance in medicine 68.6 (2012): 1886-1893.
- Chaumeil, Myriam M., et al. "Hyperpolarized 13C MR spectroscopic imaging can be used to monitor Everolimus treatment in vivo in an orthotopic rodent model of glioblastoma." Neuroimage 59.1 (2012): 193-201.
- Park, Jae Mo, et al. "Metabolite kinetics in C6 rat glioma model using magnetic resonance spectroscopic imaging of hyperpolarized [1‐13C] pyruvate." Magnetic resonance in medicine 68.6 (2012): 1886-1893.
- Park, Jae Mo, et al. "Hyperpolarized 13C‐lactate to 13C‐bicarbonate ratio as a biomarker for monitoring the acute response of anti‐vascular endothelial growth factor (anti‐VEGF) treatment." NMR in Biomedicine 29.5 (2016): 650-659.
- Guglielmetti, Caroline, et al. "In vivo metabolic imaging of Traumatic Brain Injury." Scientific reports 7.1 (2017): 17525.
- DeVience, Stephen J., et al. "Metabolic imaging of energy metabolism in traumatic brain injury using hyperpolarized [1-13 C] pyruvate." Scientific reports 7.1 (2017): 1907.
- Le Page, Lydia M., et al. "Hyperpolarized 13C magnetic resonance spectroscopy detects toxin‐induced neuroinflammation in mice." NMR in Biomedicine (2019): e4164.
- Miller, Jack J., et al. "13 C pyruvate transport across the blood-brain barrier in preclinical hyperpolarised MRI." Scientific reports 8.1 (2018): 15082.
- Mayer, Dirk, et al. "Fast metabolic imaging of systems with sparse spectra: application for hyperpolarized 13C imaging." Magnetic resonance in medicine 56.4 (2006): 932-937.
- Lee, Hansol, et al. "Flow‐suppressed hyperpolarized 13C chemical shift imaging using velocity‐optimized bipolar gradient in mouse liver tumors at 9.4 T." Magnetic resonance in medicine 78.5 (2017): 1674-1682.
- J E Cremer et al. “Kinetics of blood-brain barrier transport of pyruvate, lactate and glucose in suckling, weanling and adult rats.” J. Neurochem. 33.2 (1979), pp. 439–445.
Figures
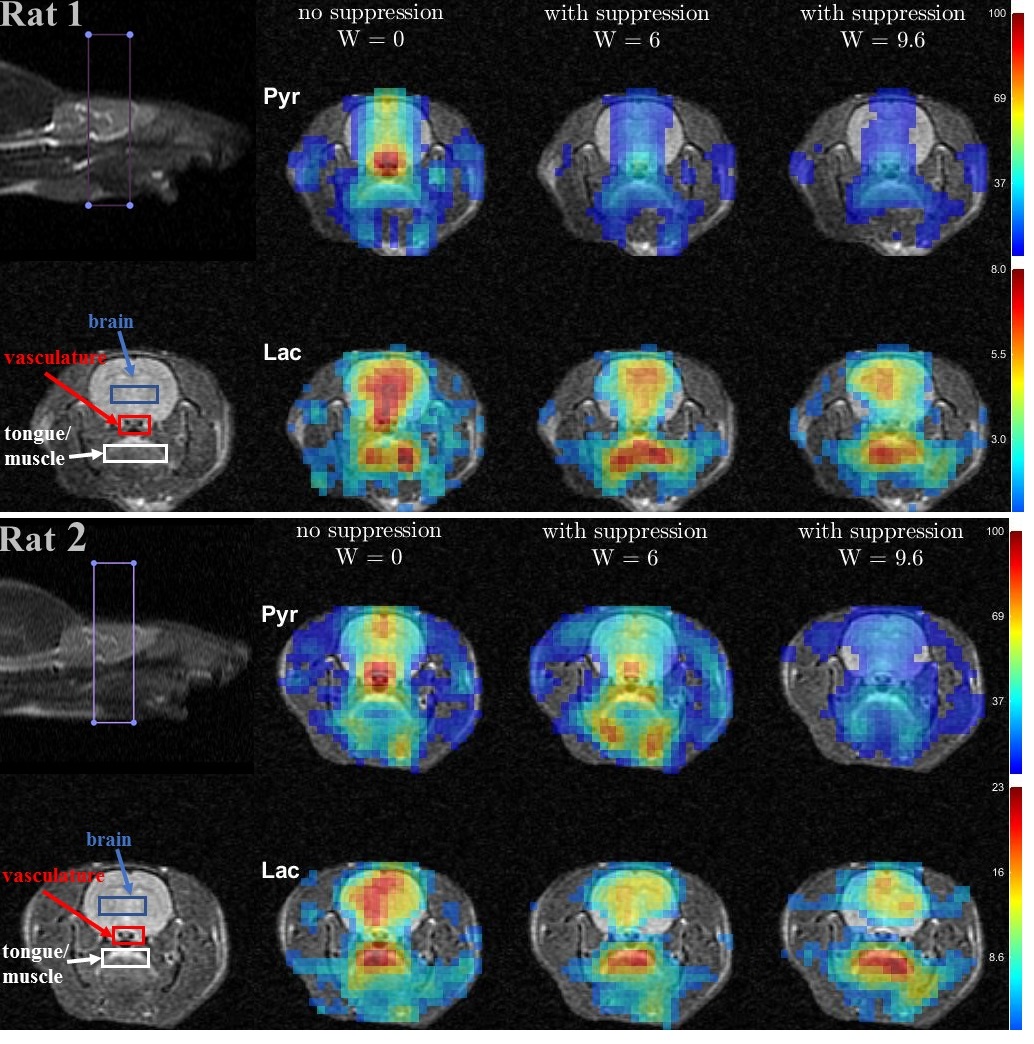
Figure 1. Metabolic maps for the
two rats, each scanned three times with different bipolar gradient
width:0/6/9.6ms respectively. For each map data were averaged over 6 time
points ranging from 9s to 24s with respect to the start of injection. Three regions
of interest – brain, vasculature, and tongue/muscle tissue were used for
quantitative analysis. For each column, image intensity is normalized with mean lactate
intensity in the muscle/tongue ROI to correct for the differences in
polarization level between the three injections.
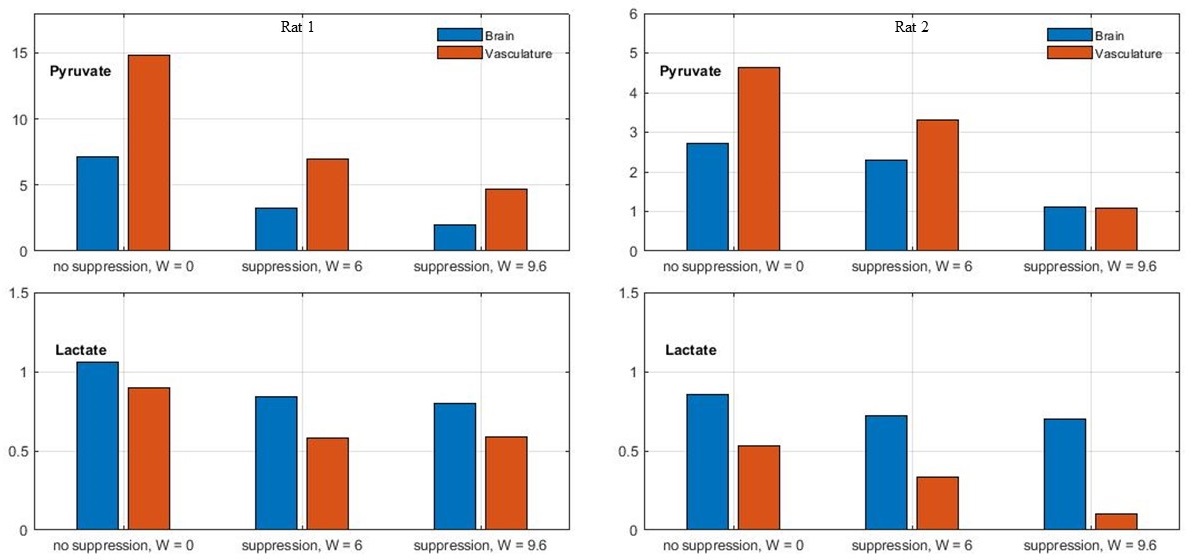
Figure 2. Mean pyruvate (top) and
lactate (bottom) intensity in brain and vasculature ROIs relative to the mean
lactate intensity in muscle/tongue ROIs for each acquisition for rats 1 (left)
and 2 (right).
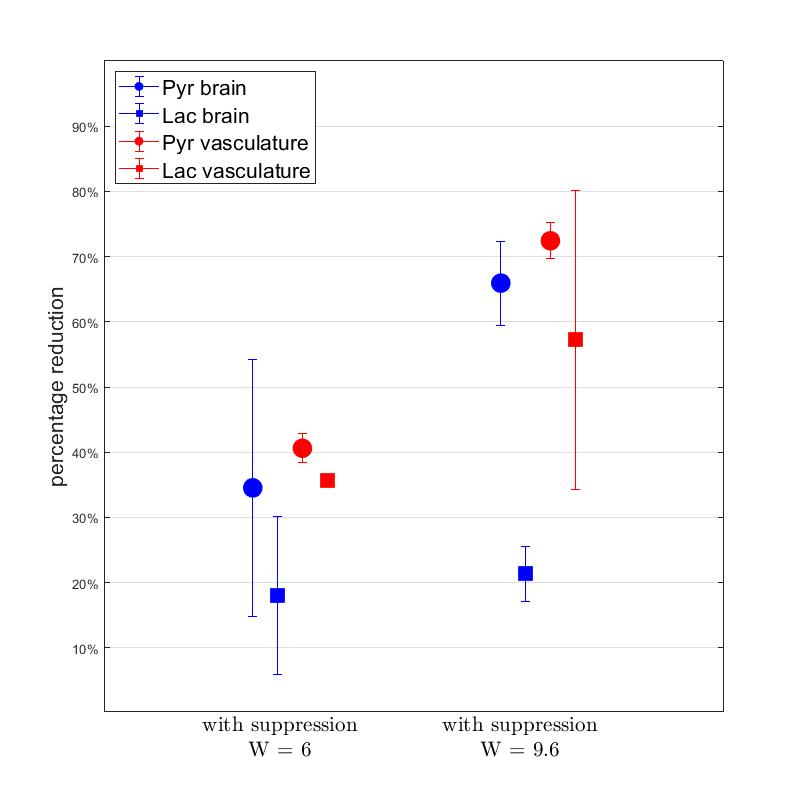
Figure 3. Mean intensity reduction (relative
to acquisition without flow suppression) of pyruvate and lactate in the
selected ROIs for the two animals.
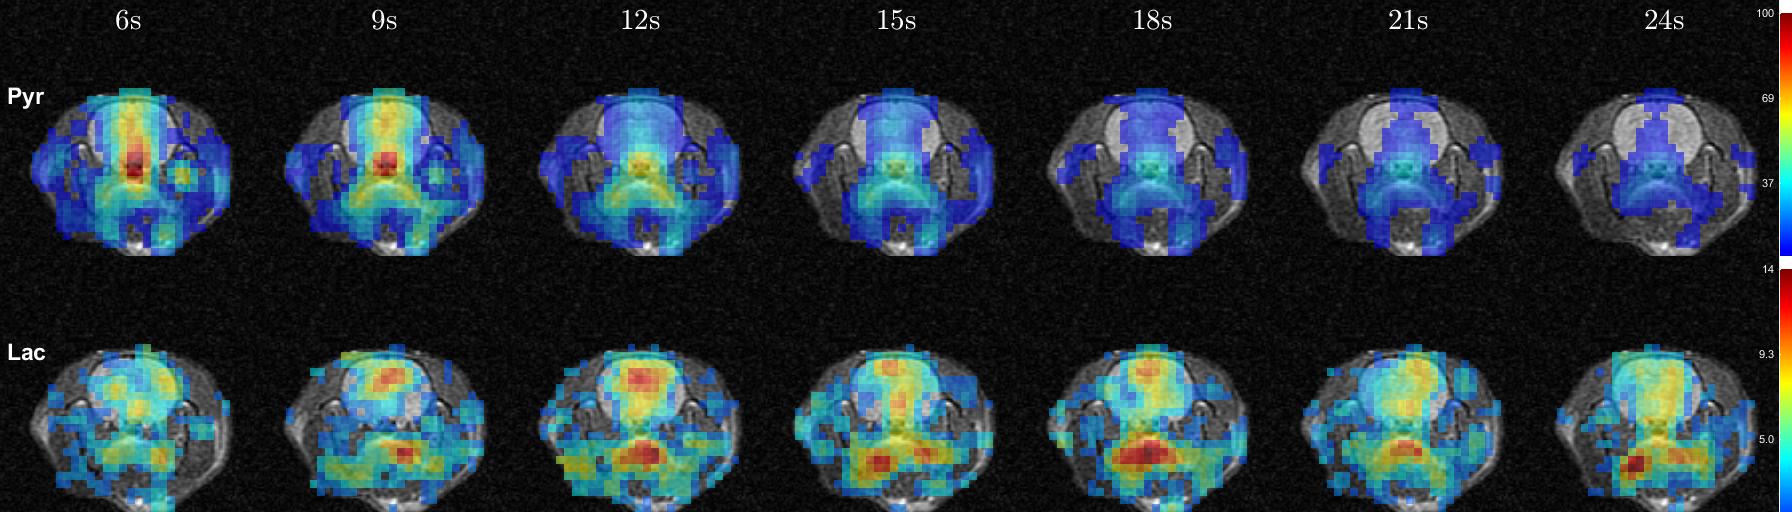
Figure 4. Metabolic maps of rat 1 with
6ms bipolar gradient width from 6 seconds to 24 seconds after the start of intravenous
injection of pyruvate.
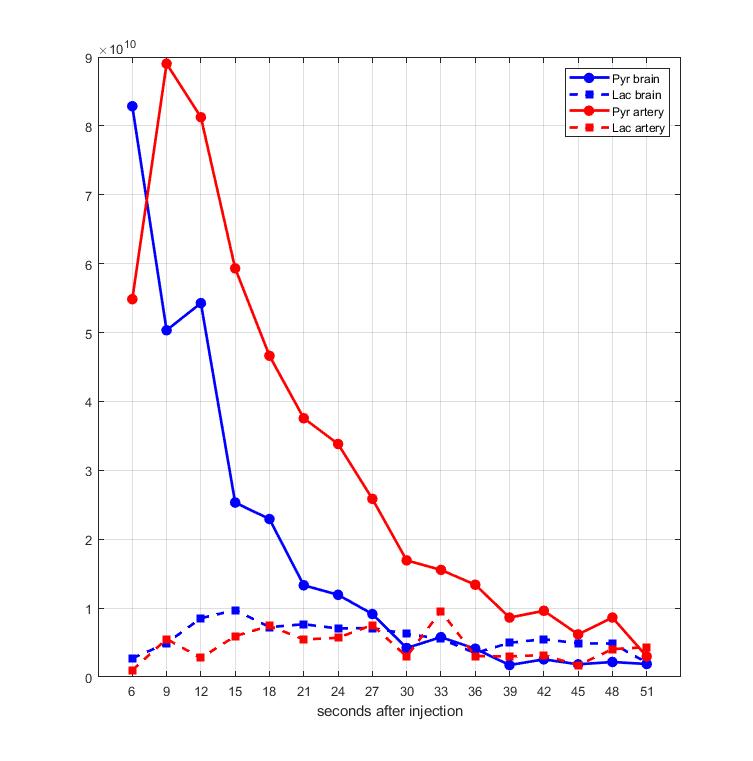
Figure 5. Mean pyruvate and
lactate intensity in brain and vascular ROIs of rat 1 with 6ms bipolar gradient
width from 6 seconds to 51 seconds after start of intravenous injection of
pyruvate.