3009
Association of prostate cancer androgen sensitivity with dynamic metabolic imaging of hyperpolarized [1-13C]pyruvate1Diagnostic Radiology and Nuclear Medicine, University of Maryland School of Medicine, Baltimore, MD, United States, 2Department of Surgery, Division of Urology, Baltimore, MD, United States, 3Greenebaum Cancer Center, University of Maryland School of Medicine, Baltimore, MD, United States, 4The Veterans Health Administration Research and Development Service, Baltimore, MD, United States
Synopsis
Metabolic signatures of androgen-dependent (LNCaP) and androgen-independent (CSS90) prostate tumors were investigated using hyperpolarized [1-13C]pyruvate imaging. Higher pyruvate-to-lactate conversion in CSS90 were confirmed by higher glycolysis in CSS90 measured by extracellular acidification rate of the tumor slices. Treatment with MDV3100 lead to higher oxidative phosphorylation measured by oxygen consumption rate. Initial in vivo experiments suggested a reduced pyruvate-to-lactate conversion in LNCaP tumors after treatment, potentially a marker for positive response to therapy. These findings demonstrated that conversion of hyperpolarized pyruvate to lactate is a useful biomarker to both characterize tumor androgen sensitivity and potentially to evaluate response to therapy.
Introduction
Prostate cancer (PCa) is a major healthcare problem and expected to increase due to aging of the population. The disease presents with a wide range of risk-profiles ranging from indolent tumors (70%) to highly-aggressive lethal tumors (10%). Aggressive prostate cancer cells convert more lactate from pyruvate than normal cells by utilizing an aerobic glycolysis.1 Hyperpolarized magnetic resonance spectroscopic imaging (MRSI) plays an important role as a marker to analyze the metabolic processes in vivo. MRSI enhances the 13C MR signal by a factor of up to five orders of magnitude,2 which allows the real-time detection of the metabolites. Hyperpolarized (HP) [1-13C]pyruvate (Pyr) and its conversion to lactate (Lac) has been developed as a new biomarker to characterize the tumor aggressiveness in preclinical studies3 and was used in its first clinical application in patients with PCa.4Androgen receptor (AR) signaling plays an important role in PCa and is an effective target of therapy. Recently, a clinical case study applying HP [1-13C]Pyr reported MRSI detection of an early metabolic response to androgen ablation therapy much sooner than what is typically feasible with normal clinical follow-up.5 The goal of this study was to investigate metabolic imaging of pyruvate metabolism of PCa as a tool to differentiate androgen sensitivity as well as assess tumor response to a drug that targets the AR.
Materials and Methods
LNCaP (androgen dependent) and CSS90 (androgen independent variant of LNCaP) cancer cell lines were orthotopically implanted into mice (N=3 each) to generate tumors. Engraftment took around 4-8 weeks. An additional 2 LNCaP mice received MDV3100 (enzalutamide) (30mg/kg bw once a day for three days), a second-generation AR antagonist. A GE SPINlab polarizer operating at 5 T and 1.2 K was used to hyperpolarize [1-13C]pyruvate. A dose of 10 uL/g bw of hyperpolarized pyruvate (~125 mM) was injected through a tail vein catheter into mice for imaging. A clinical 3 T GE 750w MRI scanner (GE Healthcare, Waukesha, WI, USA) was used for in vivo magnetic resonance imaging. A 1H/13C volume coil (i.d. 50 mm) was used for both radiofrequency (RF) excitation and signal reception. A fast 3D spiral chemical shift imaging (spCSI)6 sequence with field of view (FOV)= 40×40×40 mm3 (12×12×8) and 5 s repetition time was started at the time of injection. A constant flip angle of 5.625° was used for excitation was to acquire the metabolic data for 80 s. After imaging, the mice were sacrificed, and tumors were resected and sliced with Leica VT1200S. Tumor slices were analyzed by Seahorse XF bioenergetics analyzer to measure oxygen consumption rate (OCR) and extracellular acidification rate (ECAR). The lactate-to-pyruvate ratio was calculated by averaging all 16 time points of each metabolite in the respective tumor ROI.Results and discussion
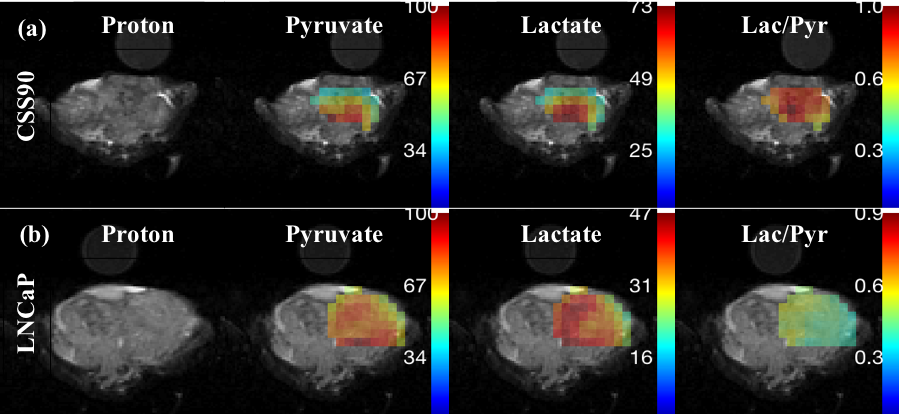
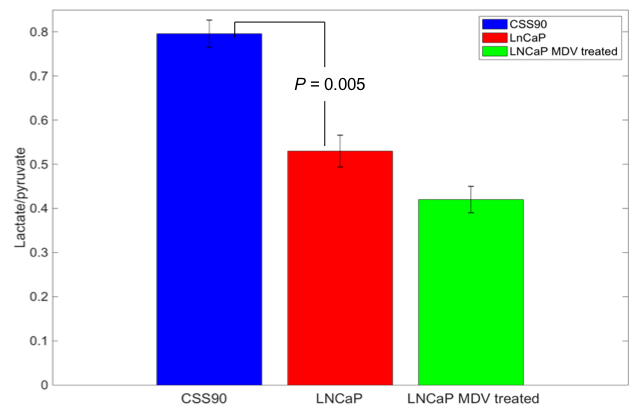
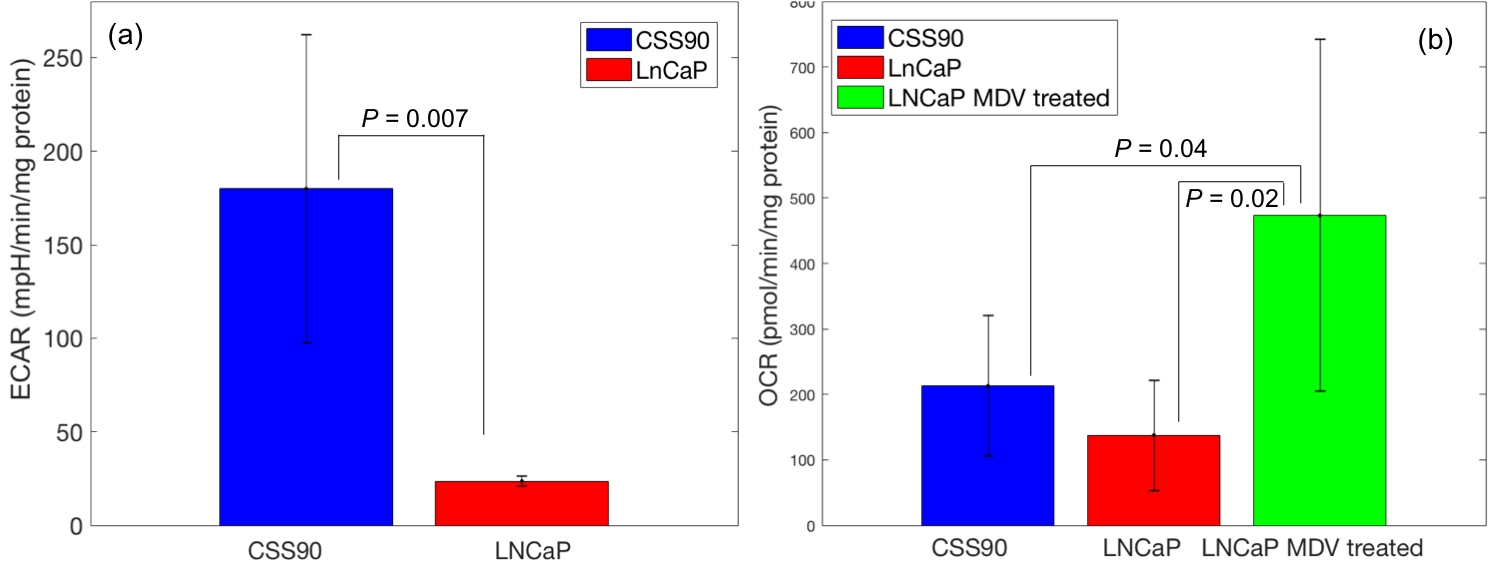
This study compares a different metabolic signature for androgen-dependent and androgen-independent tumor type by utilizing hyperpolarize MRSI. Figure 1 shows pyruvate and lactate maps, and a map of their ratio from representative animals with CSS90 and LNCaP tumors superimposed onto the corresponding 1H MRI. As illustrated in figure 2 the average lactate-to-pyruvate ratio was higher for CSS90 than LNCaP tumors (7.96×10⁻¹ ± 0.54×10⁻¹ (SD) vs. 5.30×10⁻¹ ± 0.63×10⁻¹, p < 0.05). Consistent with the in vivo finding ECAR measurements of the tumor slices showed also higher glycolysis in CSS90 compared to LNCaP tumor (179 ± 82 vs. 23 ± 3, p < 0.05, Fig. 3a). Interestingly, OCR slice data showed higher oxidative metabolism for CSS90 compared to LNCaP (213 ± 107 vs. 138 ± 84, Fig. 3b). The conversion of HP Pyr to bicarbonate is related the oxidative phosphorylation. Unfortunately, we were not able to detect bicarbonate in these tumor models. After MDV treatment, pyruvate to lactate conversion was reduced in LNCaP tumor as shown in figure 2 with an average lactate over pyruvate ratio of 4.20×10⁻¹ ± 0.42×10⁻¹ (SD). Simultaneously, OCR measurements of slices from these tumors showed higher oxidative phosphorylation (473 ± 269, p < 0.05 for comparison with both LNCaP and CSS90, Fig. 3b). These metabolic differences in MDV-treated LNCaP tumors could indicate a positive response to targeted therapy. Our initial results confirm that Hyperpolarized MRSI can be a potential biomarker to differentiate androgen dependent and androgen independent tumor and their response to therapy.Conclusions
This study demonstrated that androgen-dependent and androgen-independent PCa tumors have a different metabolic signature that can be measured in vivo with hyperpolarized 13C-pyruvate imaging. We utilized hyperpolarized MRSI to confirm the difference in metabolism of CSS90 vs. LNCaP tumor and initial results indicated an effect after treatment with MDV. Further research is necessary to elucidate the mechanisms. These initial results have demonstrated that hyperpolarized MRSI is a useful means to characterize the tumor type-specific differences and can potentially access the responses to therapies.Acknowledgements
This work was supported by NIH grants R21 CA213020, R21 CA202694, R01 DK106395, R21 NS096575 and DOD PC150408.References
- Warburg O. On the origin of cancer cells. Science 1956; 123:309–14.
- Ardenkjaer-Larsen JH, Fridlund B, Gram A, et al. Increase in signal-to-noise ratio of > 10,000 times in liquid-state NMR. Proc Natl Acad Sci U S A 2003; 100(18):10158–63.
- Albers MJ, Bok R, Chen AP. Hyperpolarized 13C lactate, pyruvate, and alanine: noninvasive biomarkers for prostate cancer detection and grading. Cancer Res. 2008; 68(20):8607-15.
- Nelson SJ, Kurhanewicz J, Vigneron DB, et al. Metabolic imaging of patients with prostate cancer using hyperpolarized [1-13C]pyruvate. Sci Transl Med 2013; 5(198):198ra108.
- Aggarwal R, Vigneron DB, Kurhanewicz J. Hyperpolarized 1-[13C]-Pyruvate Magnetic Resonance Imaging Detects an Early Metabolic Response to Androgen Ablation Therapy in Prostate Cancer. European Urology. 2017; 72:1027-1029.
- Josan S, Spielman D, Yen YF, Hurd R, Pfefferbaum A, Mayer D. Fast volumetric imaging of ethanol metabolism in rat liver with hyperpolarized [1-(13) C]pyruvate. NMR Biomed. 2012; 25(8):993-9.
Figures