3008
Molecular imaging assessment of changes in tumor microenvironment in response to PEGPH20 treatment.1National Cancer Institute, Bethesda, MD, United States, 2Halozyme, San Diego, CA, United States
Synopsis
PEGylated human hyaluronidase (PEGPH20) enzymatically deplete tumor hyaluronan, and allows re-expansion of intra-tumor vasculature to increase the delivery of therapeutic molecules. The purpose of this study was to monitor physiologic and metabolic changes in pancreatic adenocarcinoma xenograft in response to PEGPH20 treatment by using multi-modal imaging methods including hyperpolarized 13C-MRI with [1-13C] pyruvate, EPRI, DCE-MRI, and photoacoustic imaging. Significantly decreased glycolysis, increased intratumor pO2, improved perfusion, and increased oxyhemoglobin saturation as well as increased blood volume, were observed after PEGPH20 treatment. The results validate the utility of these imaging methods to non-invasively monitor the PEGPH20-induced changes in the tumor microenvironment.
Purpose
In pancreatic ductal adenocarcinoma which is characterized by an intense desmoplastic feature, the extracellular matrix (ECM) can significantly influence the tumor microenvironment (TME) of cancer. Hyaluronan (HA), a major component of ECM, is associated with elevated tumor pressure (tP), vascular collapse, and poor perfusion in the TME conferring hypoxia (1,2). High tP is considered an independent prognostic marker. It is also related to poor perfusion and hypoxia compromising the efficacy of chemotherapy and radiotherapy (3). PEGylated human hyaluronidase (PEGPH20) has been developed to enzymatically deplete tumor HA and re-expand the tumor vasculature resulting in increased delivery of therapeutic molecules into the tumor (4,5). PEGPH20 has been tested in phase 2 clinical trials in combination with Gemcitabine and Nab-Paclitaxel for pancreatic ductal adenocarcinoma (6) and a phase 3 trial is ongoing (NCT02715804). With molecular imaging techniques, it is possible to monitor changes in physiologic and metabolic profiles inside of the tumor. The aim of this study was to investigate the capability of the multi-modal imaging techniques to monitor changes in tumor physiology and metabolism in response to treatment with PEGPH20.Methods
BxPC3 cell line (human pancreatic adenocarcinoma) transduced with hyaluronan synthase 3 (HAS3) to increase HA production, increasing sensitivity to PEGPH20 treatment, and PEGPH20 were given from Halozyme, Inc. with agreement. Athymic nude mice were inoculated with 2 x 10⁶ BxPC3-HAS3 tumor cells adjacent to the right tibial periosteum. For treatment, approximately 600 mm3 tumor bearing mice were injected i.v. with 1 mg/kg of PEGPH20 on day 0 and day 3. Tumor bearing mice in the control group were injected with same amount of API buffer. 10 mg/kg of PEGPH20 was injected only for photoacoustic imaging. Hyperpolarized 13C-MRI studies: [1-13C] pyruvic acid (30 μL), containing 15 mmol/L OX063 and 2.5 mmol/L gadolinium, was hyperpolarized using the Hypersense DNP polarizer (Oxford Instruments). After 30 to 60 minutes, the sample was rapidly dissolved in 4.5 mL of a superheated alkaline buffer. A hyperpolarized [1-13C] pyruvate solution (96 mmol/L) was intravenously injected (12 mL/g body weight). 13C MRI studies were performed on a 3T scanner using a 17 mm home-built 13C solenoid coil placed inside of a saddle coil for 1H. 13C spectra were acquired every 1 second for 240 seconds. EPRI: Parallel coil resonators tuned to 300MHz were used for EPRI. OX063 (1.125 mmol/kg bolus) was injected i.v. to a mouse. The free induction decay (FID) signals were collected following the radiofrequency excitation pulses (65 ns) with a nested looping of the x, y, and z gradients, and each time point in the FID underwent phase modulation, enabling 3D spatial encoding. The repetition time was 8.0 μs. The number of averages was 4,000. After EPRI measurement, anatomic T2-weighted MR images were collected with a 1T scanner. DCE-MRI: DCE-MRI studies were performed on a 1 T scanner. T1-weighted fast low-angle shot (FLASH) images were obtained with TR = 156 ms; TE = 4 ms; flip angle = 45˚; four slices; 0.44 x 0.44 mm resolution; 20-second acquisition time per image; and 98 repetitions. Gd-DTPA solution (4 mL/g of body weight of 50 mmol/L Gd-DTPA) was injected 1 minute after the start of the dynamic FLASH sequence. To determine the local concentrations of Gd-DTPA, T1 maps were calculated from four sets of Rapid Imaging with Refocused Echoes (RARE) images obtained with TR = 300, 600, 1000, and 2000 ms, with the acquisitions being made before running the FLASH sequence. Photoacoustic imaging: Tumors were imaged with the VisualSonics Vevo®LAZR System (FUJIFILM VisualSonics Inc.) using a 21-MHz linear array transducer system (central frequency) integrated with a tunable nanosecond pulsed laser. The tumor area in the sagittal plane of the leg was determined manually from concurrently acquired ultrasound images. For O2 status assessments, photoacoustic images in the tumor area were collected with OxyHemo-Mode (wavelength 750 nm/850 nm) every 3 s for 30 min. Oxygen saturation of hemoglobin (sO2) in the tumor area were calculated using OxyZated™ tool.Results
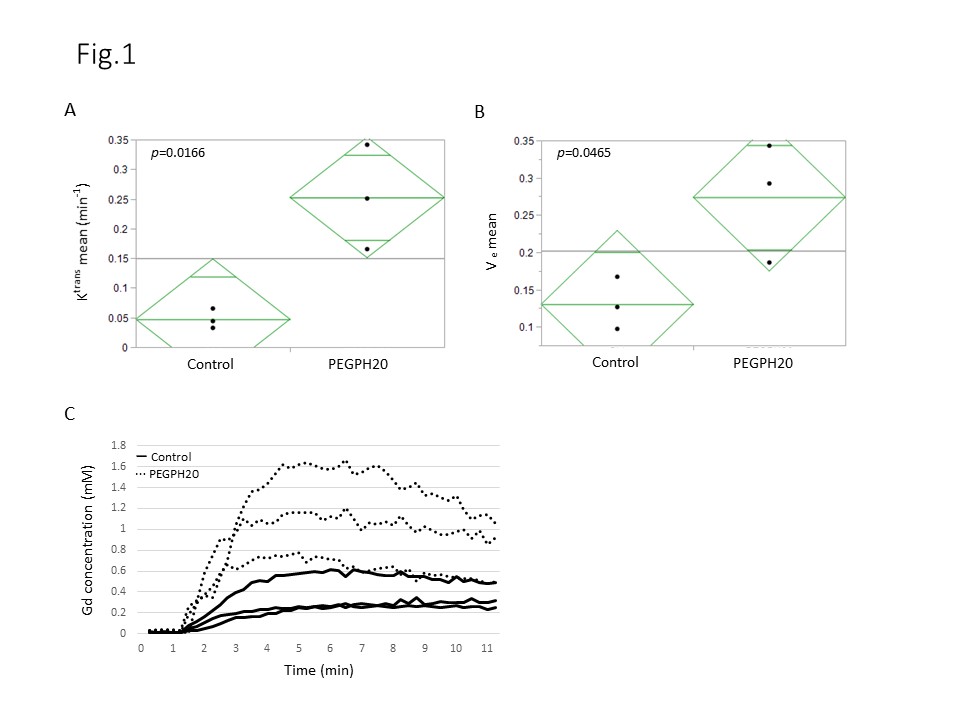
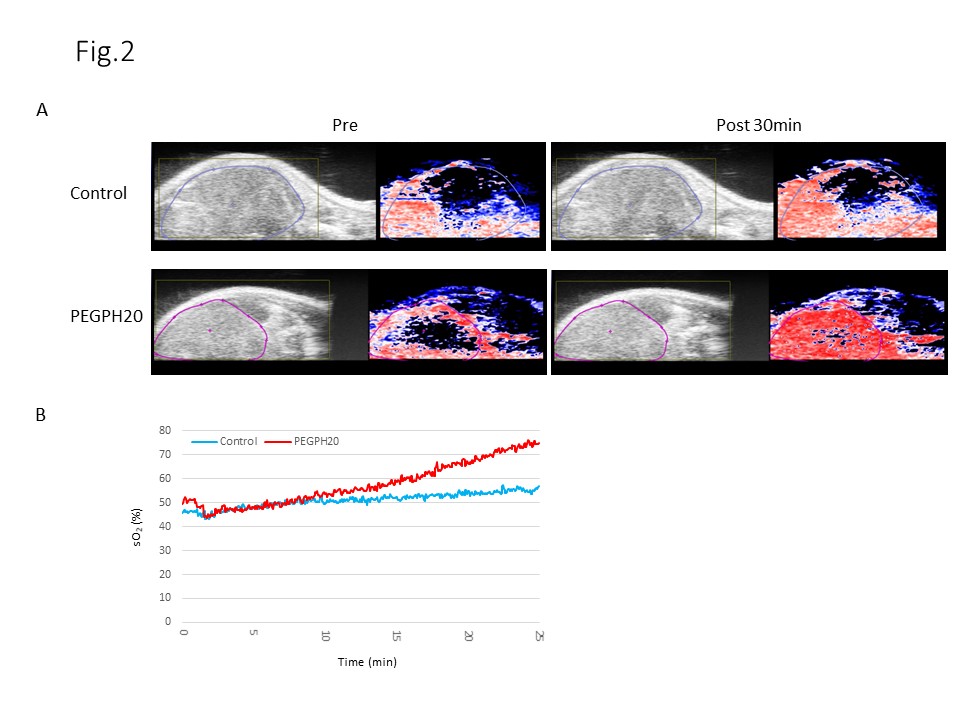
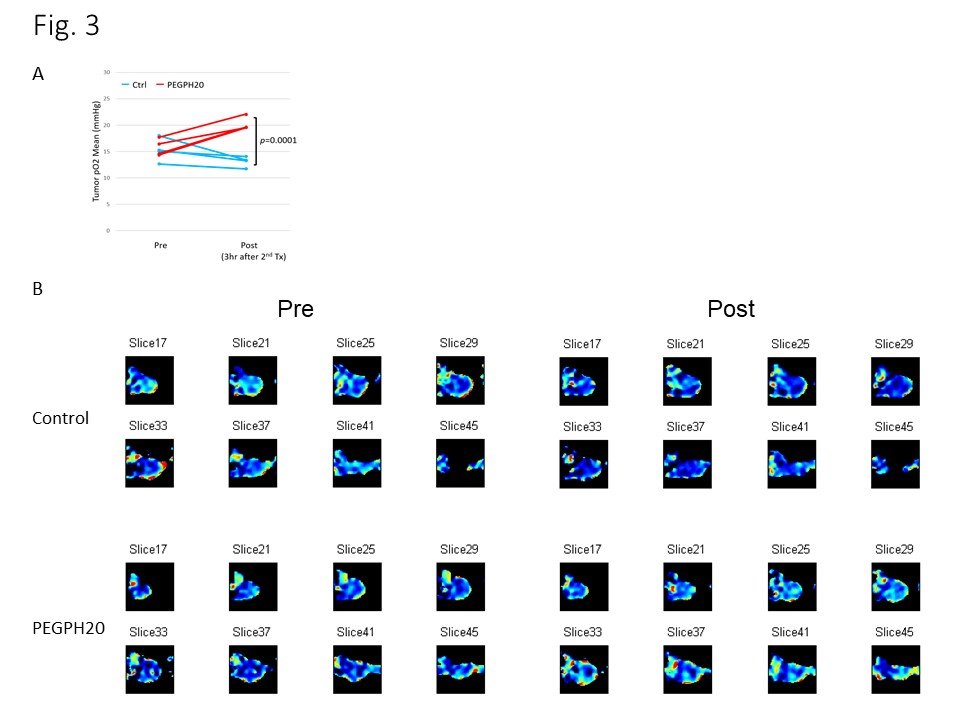
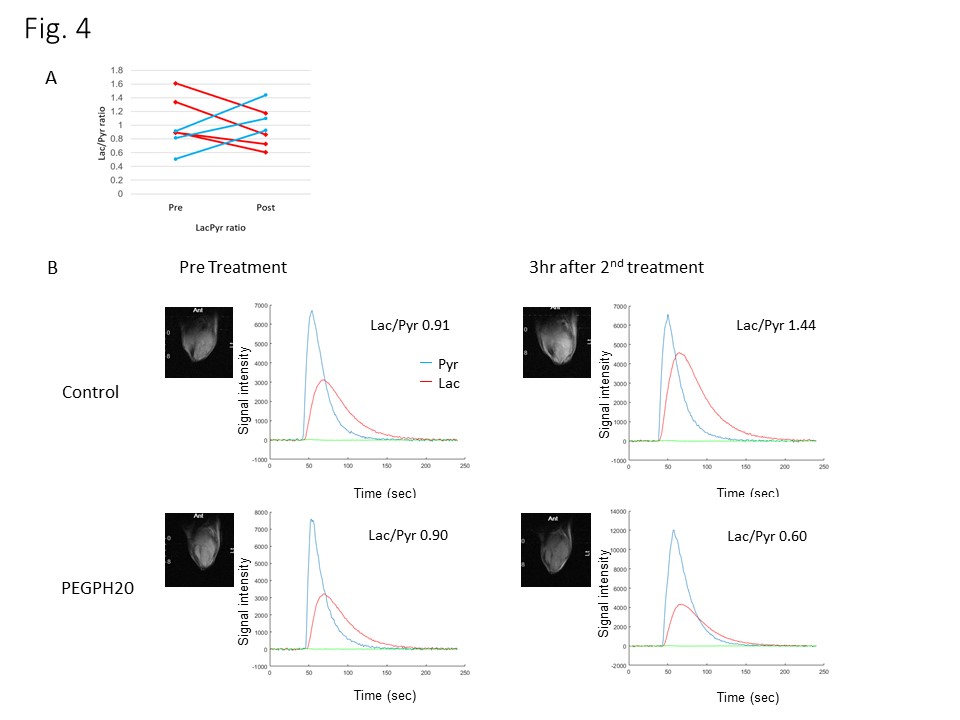
DCE-MRI showed significantly higher permeability of Gd-DTPA in PEGPH20 treated tumors than in control buffer treated tumors 3 hr after the 2nd treatment (Fig. 1). Photoacoustic imaging could dynamically detect increased tumor oxygen saturation (sO2) and total hemoglobin shortly after the first injection of PEGPH20, while sO2 showed no significant change in control tumor (Fig. 2). EPRI showed significantly increased pO2 in PEGPH20 treated tumor, while decreased pO2 was observed in control tumor (Fig. 3). Hyperpolarized 13C-MRI with [1-13C] pyruvate showed decreased lactate–to-pyruvate ratio in PEGPH20 treated tumor, while it increased in control tumor (Fig. 4).Conclusion
Multi-modal imaging showed the re-expansion of intratumor vasculature, resulting in improved oxygenation and decreased glycolytic flux by PEGPH20. These data support the functional mechanism of PEGPH20 and can provide imaging biomarkers to identify the optimal timing and dose of PEGPH20 to decrease tP.Acknowledgements
No acknowledgement found.References
(1) Singha NC, Nekoroski T, Zhao C, et al. Tumor-associated hyaluronan limits efficacy of monoclonal antibody therapy. Mol Cancer Ther 2015;14(2):523-32.
(2) Jacobetz MA, Chan DS, Neesse A, et al. Hyaluronan impairs vascular function and drug delivery in a mouse model of pancreatic cancer. Gut 2013;62(1):112-20.
(3) Jain RK. Barriers to drug delivery in solid tumors. Sci Am 1994;271(1):58-65.
(4) Thompson CB, Shepard HM, O'Connor PM, et al. Enzymatic depletion of tumor hyaluronan induces antitumor responses in preclinical animal models. Mol Cancer Ther 2010;9(11):3052-64.
(5) Li X, Shepard HM, Cowell JA, et al. Parallel Accumulation of Tumor Hyaluronan, Collagen, and Other Drivers of Tumor Progression. Clin Cancer Res. 2018;24(19):4798-4807.
(6) Hingorani SR, Zheng L, Bullock AJ, et al. HALO 202: Randomized Phase II Study of PEGPH20 Plus Nab-Paclitaxel/Gemcitabine Versus Nab-Paclitaxel/Gemcitabine in Patients With Untreated, Metastatic Pancreatic Ductal Adenocarcinoma. J Clin Oncol 2018;36(4):359-66.
Figures