3007
Imaging the metabolic evolution of glioblastoma throughout tumor development, regression and relapse1Cancer Systems Imaging, MD Anderson Cancer Center, Houston, TX, United States, 2The University of Texas MD Anderson Cancer Center UTHealth Graduate School of Biomedical Sciences, Houston, TX, United States, 3Neurosurgery, MD Anderson Cancer Center, Houston, TX, United States
Synopsis
Glioblastoma metabolism was interrogated at several time-points during tumor development, regression following radiotherapy, and eventual recurrence. Pyruvate-to-lactate conversion measured with hyperpolarized magnetic resonance imaging (MRI) was compared with tumor volume measured with conventional MRI to determine which was more sensitive at detecting tumor progression. These results were correlated with ex vivo measurements of global metabolism using nuclear magnetic resonance spectroscopy as well as the expression of relevant proteins such as LDH-A, ALT, HIF-1a, MCT1, and MCT4 using immunohistochemistry. A comprehensive analysis of metabolic trajectories throughout the entirety of tumor evolution will be presented.
Introduction
For aggressive diseases such as glioblastoma, time is of paramount importance to the patient. A tumor which is detected earlier is less advanced and more localized, and reductions in time to determine treatment efficacy allow clinicians to rapidly adapt their therapeutic strategies to tumor progression. Metabolic imaging has the potential to benefit patient care in both of these aspects as changes in cancer metabolism often precede tumor growth1. By enhancing the MRI signal of injectable metabolic substrates by over 10,000-fold, a novel imaging technique, known as hyperpolarized MRI, allows for the real-time imaging of metabolic pathways in vivo2–6. We hypothesize that hyperpolarized MRI can detect significant changes in pyruvate-to-lactate conversion prior to significant changes in tumor volume measured with conventional MRI. This was tested throughout tumor growth as well as during tumor regression following radiation therapy in longitudinal imaging experiments. Additionally, results from current experiments testing whether hyperpolarized MRI can predict relapse prior to tumor recurrence on conventional MRI will be presented. Nuclear magnetic resonance (NMR) spectroscopy was also conducted on ex vivo samples to correlate global, steady-state tumor metabolism to these findings, and immunohistochemistry (IHC) was performed for additional biological verification of metabolic data.Methods
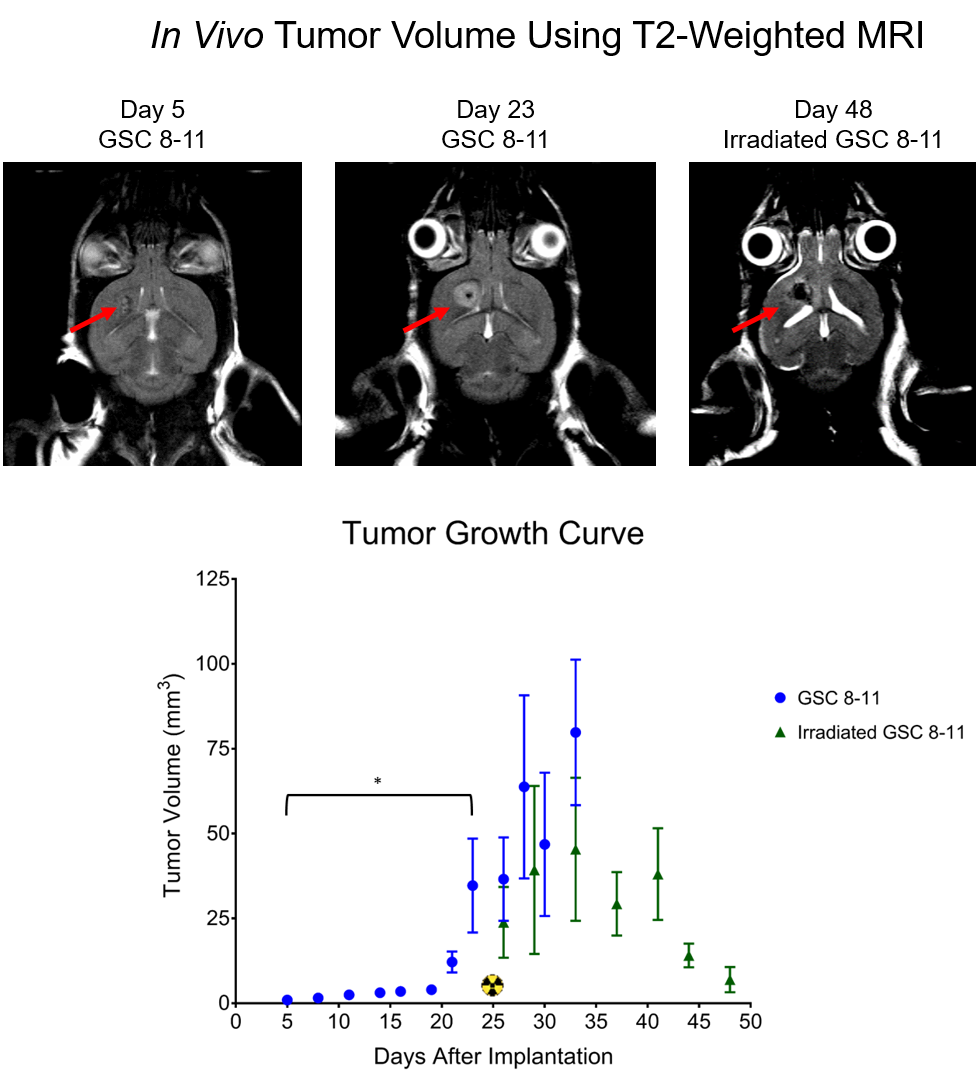
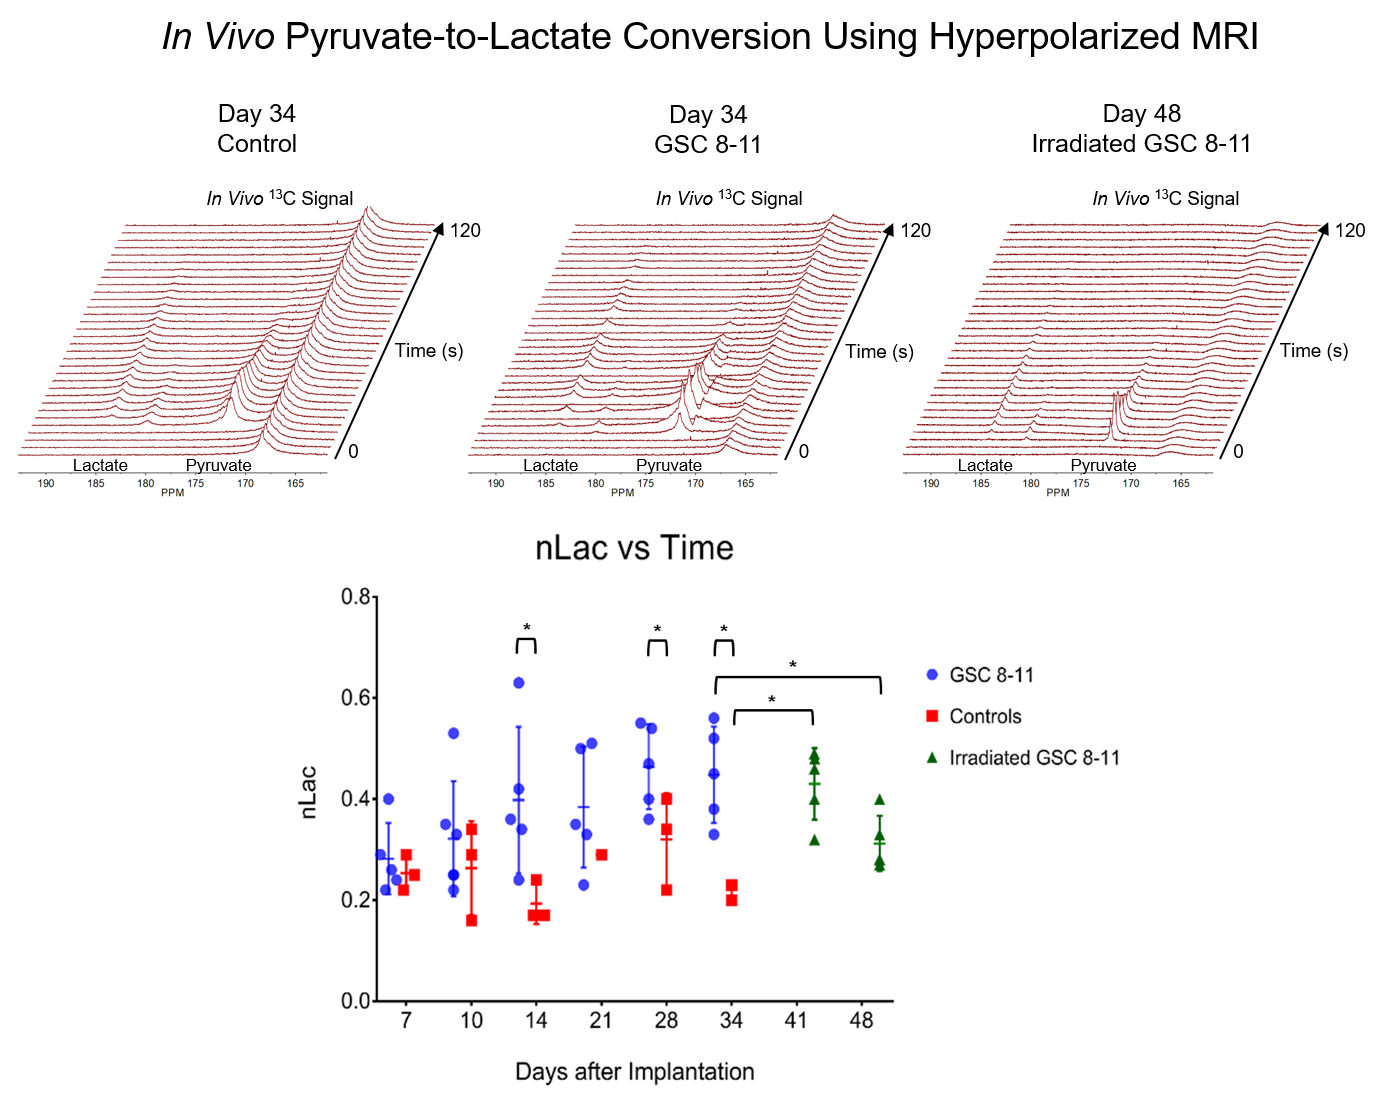
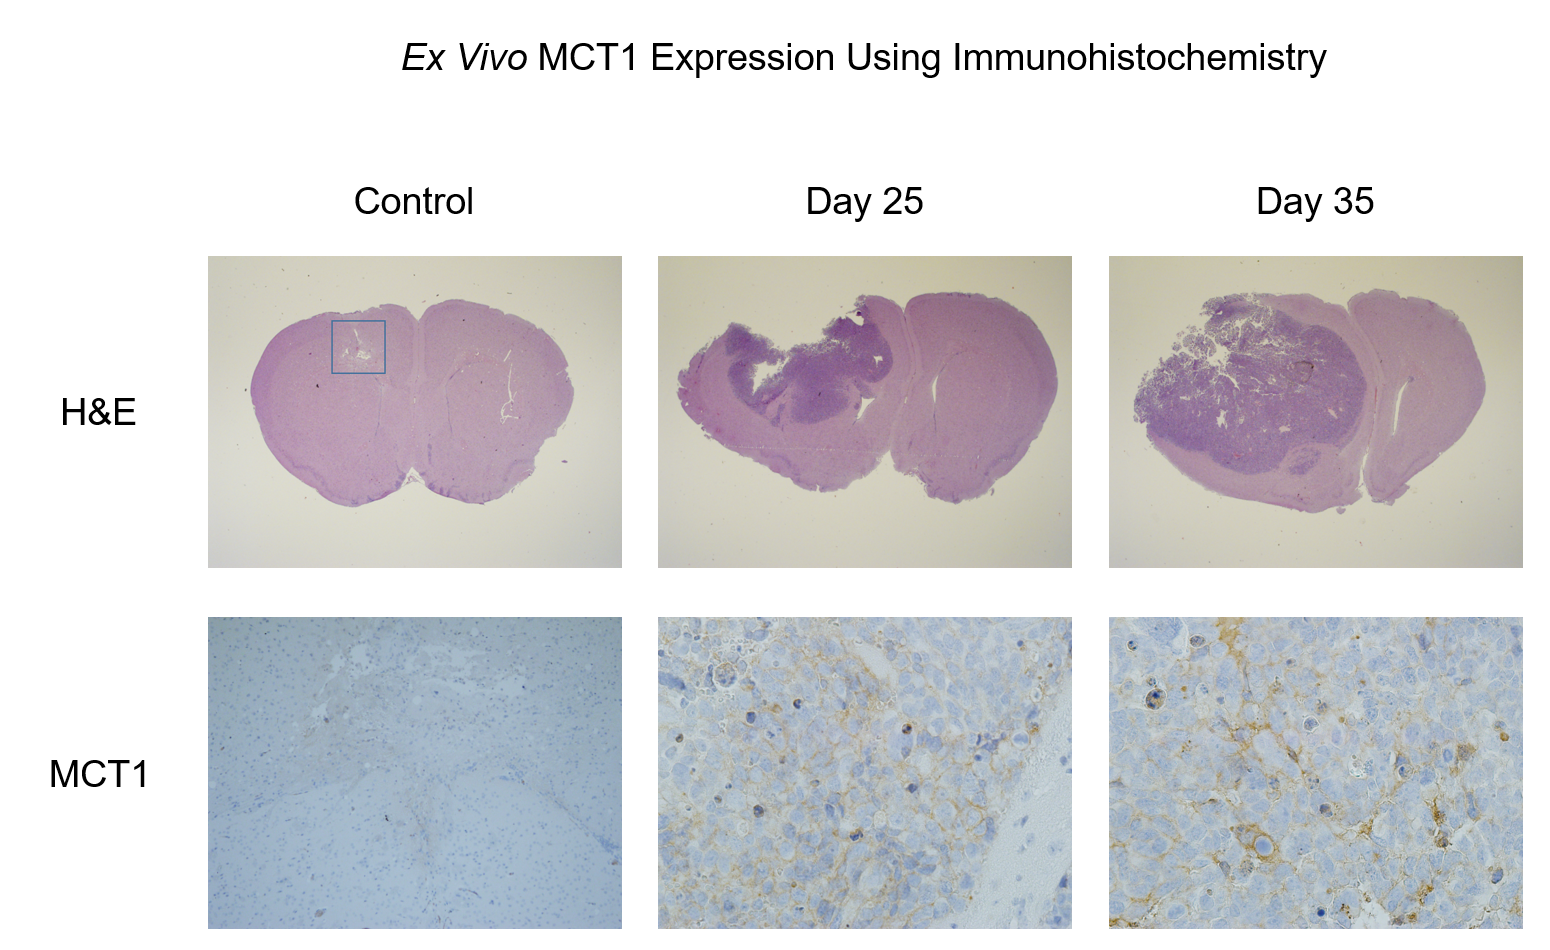
Athymic mice were intracranially injected with either patient-derived glioma sphere-forming cells (GSC) or phosphate-buffered saline, which served as controls5. The median survival of tumor-bearing mice was 34 days. Every 3 days, tumor volume was measured with T2-weighted MRI. Then every 7 days, hyperpolarized MRI experiments were performed to measure the real-time conversion of injected [1-13C] pyruvate into lactate in vivo. This conversion was quantified by the metric, nLac, which is the time-integrated ratio of lactate:lactate+pyruvate signal. In half of the mice, tumors were irradiated to 5 Gy on Days 25 and 27. Again, tumor volume was measured every 3 days, and on Days 41 and 48, hyperpolarized MRI experiments were performed. Following each of the hyperpolarization experiments, tumors were excised and prepared for NMR spectroscopy to study global, steady-state metabolism. Additionally, in order to support the metabolic data, ex vivo samples were prepared for IHC to measure the expression of relevant enzymes such as LDH-A, MCT1, and ALT. Statistical analysis was conducted using one-way ANOVA with multiple comparison corrections, and significance was attributed to adjusted p-values less than 0.05.Results
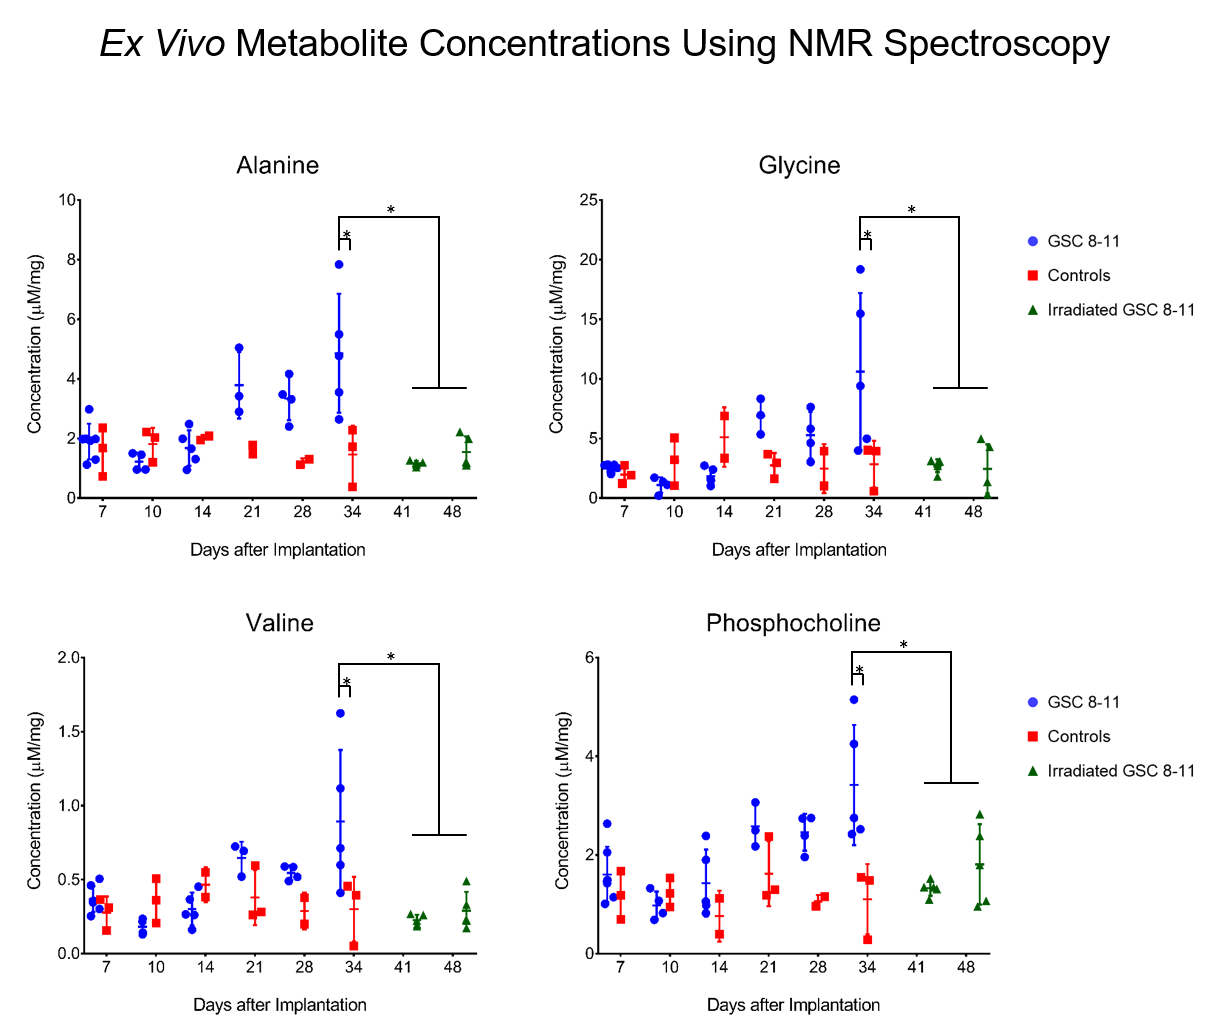
During tumor growth, hyperpolarized MRI experiments revealed significant increases of nLac in tumor-bearing mice compared to healthy controls beginning at Day 14 and continued to increase throughout tumor development. Tumor volume was not significantly larger than baseline volume until Day 23- over a week after an increase in nLac was detected. From the NMR spectroscopy experiments, the amino acids valine, alanine, and glycine as well as phosphocholine were all increased in tumors compared to healthy brain by the end of development. From the IHC experiments, MCT1 expression increased throughout tumor development. In the cohort of mice treated with radiation therapy, tumor volume began to shrink, but was not significantly reduced compared to pre-treatment volume by Day 48. However, nLac in treated tumor-bearing mice was significantly reduced compared to untreated tumor-bearing mice by this time-point. Furthermore, the same ex vivo metabolites (valine, alanine, glycine, and phosphocholine) were all significantly reduced in treated tumor-bearing mice compared to untreated tumor-bearing mice at this time-point.Discussion
During both tumor development and tumor regression, hyperpolarized MRI was able to detect significant changes of pyruvate-to-lactate conversion in vivo prior to significant changes in tumor volume measured with conventional MRI. This correlation of pyruvate-to-lactate conversion to tumor growth and regression could be a consequence of the Warburg effect which states that proliferating cancer cells utilize most of their pyruvate to produce lactate as a quick way to generate ATP and biomass6,7. This is in contrast to most non-malignant cells which shuttle the majority of pyruvate into the TCA cycle for slower, but efficient, ATP production. This is reflected in the steady-state metabolism results from NMR analysis which revealed higher amino acid buildup as well as elevations in the cell membrane precursor, phosphocholine. Elevated expression of MCT1 correlated with increased nLac during tumor development which was recently observed in human prostate cancer patients8.Conclusion
The results from these experiments demonstrate the power of hyperpolarized MRI with regards to early detection and determination of treatment response. The ability to predict relapse with this technique is also being explored which would allow physicians to treat recurrent disease before it fatally spreads throughout the body. Through these hyperpolarization and NMR experiments, it is apparent that metabolic imaging possesses significant clinical value and can provide patients with the time they need to be optimally treated, vastly improving survival. Lastly, because tumor volume, nLac, global metabolomics, and IHC values were measured at each time-point, inter-experimental correlations are being investigated which could reveal further exploitable targets of cancer metabolism for the purposes of imaging and therapy. Thus, this project also serves as a discovery platform for future studies.Acknowledgements
This work was supported by Brain SPORE Developmental Research Award and CPRIT Research Training Award (RP170067).References
1. Salzillo TC, Hu J, Nguyen L, et al. Interrogating Metabolism in Brain Cancer. Magn Reson Imaging Clin N Am. 2016;24(4):687-703.
2. Ardenkjaer-Larsen JH, Fridlund B, Gram A, et al. Increase in signal-to-noise ratio of > 10,000 times in liquid-state NMR. Proc Natl Acad Sci. 2003;100(18):10158-10163.
3. Wilson DM, Keshari KR, Larson PEZ, et al. Multi-compound polarization by DNP allows simultaneous assessment of multiple enzymatic activities in vivo. J Magn Reson. 2010;205(1):141-147.
4. Day SE, Kettunen MI, Cherukuri MK, et al. Detecting response of rat C6 glioma tumors to radiotherapy using hyperpolarized [1-13C]pyruvate and 13C magnetic resonance spectroscopic imaging. Magn Reson Med. 2011;65(2):557-563.
5. Dutta P, Perez MR, Lee J, et al. Combining Hyperpolarized Real-Time Metabolic Imaging and NMR Spectroscopy To Identify Metabolic Biomarkers in Pancreatic Cancer. J. Proteome Res. 2019;18(7):2826–2834.
6. Dutta P, Salzillo TC, Pudakalakatti S, et al. Assessing Therapeutic Efficacy in Real-time by Hyperpolarized Magnetic Resonance Metabolic Imaging. Cells. 2019;8(4):340.
7. Lal S, Lacroix M, Tofilon P, Fuller GN, Sawaya R, Lang FF. An implantable guide-screw system for brain tumor studies in small animals. J Neurosurg. 2000;92(2):326-333.
8. Warburg O. On respiratory impairment in cancer cells. Science. 1956;124(3215):269-270.
9. Vander Heiden MG, Cantley LC, Thompson CB. Understanding the Warburg Effect: The Metabolic Requirements of Cell Proliferation. Science (80- ). 2009;324(5930):1029-1033.
10. Granlund KL, Tee S-S, Vargas HA, et al. Hyperpolarized MRI of Human Prostate Cancer Reveals Increased Lactate with Tumor Grade Driven by Monocarboxylate Transporter 1. Cell Metab. 2019 (In Press)
Figures