3006
Investigating cardiac metabolism between the fasted and fed state using hyperpolarized [1-13C]pyruvate MRI
Shuyu Tang1, Jing Liu1, Robert Bok1, Karen Ordovas1, Jeremy Gordon1, James Slater1, M. Roselle Abraham1, and Peder Larson1
1University of California, San Francisco, San Francisco, CA, United States
1University of California, San Francisco, San Francisco, CA, United States
Synopsis
In this work, we investigated the influence of a fed versus fasted state on human heart metabolism using hyperpolarized [1-13C]pyruvate MRI in order to develop protocols for human studies of heart disease. Good image quality was obtained in all volunteers, and approximately 40-50% increases in the lactate and bicarbonate signals were observed in the fed state. Distinct metabolic patterns are observed between the left and right ventricle and warrant further investigation.
Introduction
Magnetic resonance imaging with hyperpolarized (HP) 13C-labeled compounds via dynamic nuclear polarization (DNP) allows for non-invasive human studies of metabolic processes, and has shown great potential for imaging of heart diseases1. HP 13C-pyruvate MRI provides a way to examine substrate selection, for example the relative contribution of glucose metabolism and fatty acid oxidation to energy production in the heart that is associated with ischemia, heart failure, and cardiomyopathies.2-7 However, cardiac metabolism is also very flexible and can adapt to the available substrates. In this work, we investigated the influence of a fed versus fasted state on human heart metabolism using hyperpolarized [1-13C]pyruvate MRI in order to develop protocols for human studies of heart disease.Methods
Three healthy subjects with no known cardiac disease history were recruited under a UCSF institutional review board approved protocol. MRI scans were performed on a GE 3T scanner following injection of [1-13C]pyruvate pre-polarized in a 5T GE SPINlab polarizer. Subjects were fasting for at least four hours before the study. Two scans with identical injections of hyperpolarized [1-13C]pyruvate were performed on the same subject. After the first scan, each subject drank a bottle of Gatorade containing 30g total carbohydrates and a second scan started 30 minutes thereafter. 13C acquisitions were triggered upon bolus arrival in the right ventricle using an integrated RT-Hawk platform (HeartVista) for real-time frequency and B1 calibration.8 Short-axis cardiac images of 13C-bicarbonate, [1-13C]lactate and [1-13C]pyruvate were acquired using a spectral-spatial excitation and 2D multi-slice cardiac-gated spiral gradient-echo sequence8 with a clamshell transmit coil and an 8-channel paddle receive array.9 Scan parameters were 6mm in-plane resolution for pyruvate, 12mm in-plane resolution for bicarbonate and lactate, 21mm slice thickness, temporal resolution 3 heartbeats (~3.6s), 5 slices per heartbeat, 90 heartbeats, 20° flip angle for pyruvate and 30° flip angle for lactate and bicarbonate. Images were acquired during free-breathing.Results and Discussion
Figure 1 shows representative sum-over-time images between the fasted and fed states. The pyruvate distribution was similar, with the largest signals from within the chambers but also signal was observed in the heart wall. The lactate distribution was also similar between fed and fasted states, with similar amounts of lactate observed in the heart wall and within the chambers. Bicarbonate is mostly below the noise level in the fasted state, where as it is observed in the heart wall in the fed state.Figure 2 shows representative dynamic images of lactate and bicarbonate between fasted and fed states. Lactate first is observed within the right ventricle, then in the left ventricle chamber, after which there is more apparent signal within the heart wall. Bicarbonate appears to be primarily within the heart wall. Interestingly, high lactate and bicarbonate signals are observed at the 7th time-point at the location of the anterior longitudinal sulcus, which could be attributed to the transfer of lactate and bicarbonate in the coronary vasculature.
Figure 3 shows representative dynamic curves of pyruvate, lactate and bicarbonate, measured across ROIs including the chambers and wall of the left and right ventricles. Distinct signal patterns are observed between right ventricle and left ventricle for all metabolites. A small amount of lactate first appears in the right ventricle, which is consistent with the finding in Figure 2. Primary lactate and bicarbonate buildup comes after the pyruvate buildup in the left ventricle, implying that the contraction of left ventricle supplies pyruvate into heart muscles. Both buildup and washout rate of lactate are faster in the left ventricle than in the right ventricle. Comparing the fasted and fed states, the fed states show higher signals for both lactate and bicarbonate. At the fed state, more bicarbonate signals are observed in the left ventricle than in the right ventricle.
Figure 4 summarizes measured metabolite ratios between the fasted and fed states. Both lactate and bicarbonate shows increased signal in the fed state by 40-50%. In the left ventricle, fed-state signal improvement is slightly more in the bicarbonate than in the lactate, whereas it is opposite in the right ventricle. Normalizing lactate and bicarbonate by pyruvate shows a reduced standard deviation relative to the mean, suggesting this can improve the reproducibility.
Conclusion
This work presents the influence of feeding on human hyperpolarized [1-13C]pyruvate cardiac image studies. Good image quality was obtained in all volunteers, and approximately 40-50% increases in the lactate and bicarbonate signals were observed in the fed state. This is expected based on prior animal model studies.10 Distinct metabolite dynamic patterns were observed between the left and right ventricle and warrant further investigation.Acknowledgements
This work is supported by the National Institute of Biomedical Imaging and Bioengineering (P41EB013598, U01EB026412), Myokardia Myoseeds award and UCSF Resource Allocation Program.References
1. Cunningham CH, Lau JY, Chen AP, et al. Hyperpolarized 13C Metabolic MRI of the Human Heart: Initial Experience. Circ Res. 2016;119(11):1177–1182. 2. Schroeder MA, Cochlin LE, Heather LC, et al. In vivo assessment of pyruvate dehydrogenase flux in the heart using hyperpolarized carbon-13 magnetic resonance. Proc Natl Acad Sci U A. 2008 3. Schroeder MA, Clarke K, Neubauer S, et al. Hyperpolarized Magnetic Resonance. Circulation. 2011;124(14):1580–1594. 4. Rider OJ, Tyler DJ. Clinical implications of cardiac hyperpolarized magnetic resonance imaging. J Cardiovasc Magn Reson. 2013;15:93. 5. Schroeder MA, Lau AZ, Chen AP, et al. Hyperpolarized 13C magnetic resonance reveals early- and late-onset changes to in vivo pyruvate metabolism in the failing heart. Eur J Heart Fail. 2013;15(2):130–140. 6. Dodd MS, Ball DR, Schroeder MA, et al. In vivo alterations in cardiac metabolism and function in the spontaneously hypertensive rat heart. Cardiovasc Res. 2012;95(1):69–76. 7. Bastiaansen JAM, Merritt ME, Comment A. Measuring changes in substrate utilization in the myocardium in response to fasting using hyperpolarized [1-13C]butyrate and [1-13C]pyruvate. Sci Rep. 2016;6:25573. 8. Tang S, Milshteyn E, Reed G, et al. A regional bolus tracking and real-time B1 calibration method for hyperpolarized 13C MRI. Magn Reson Med. 2019; 81: 839– 851 9. Tropp J, Lupo JM, Chen A, et al. Multi-channel metabolic imaging, with SENSE reconstruction, of hyperpolarized [1-13C] pyruvate in a live rat at 3.0 tesla on a clinical MR scanner. J Magn Reson 2011;208:171–7. 10. Tougaard RS, Szocska Hansen ES, Laustsen C, et al. Hyperpolarized [1-13C]pyruvate MRI can image the metabolic shift in cardiac metabolism between the fasted and fed state in a porcine model. Magn Reson Med. 2019;81(4):2655–2665.Figures
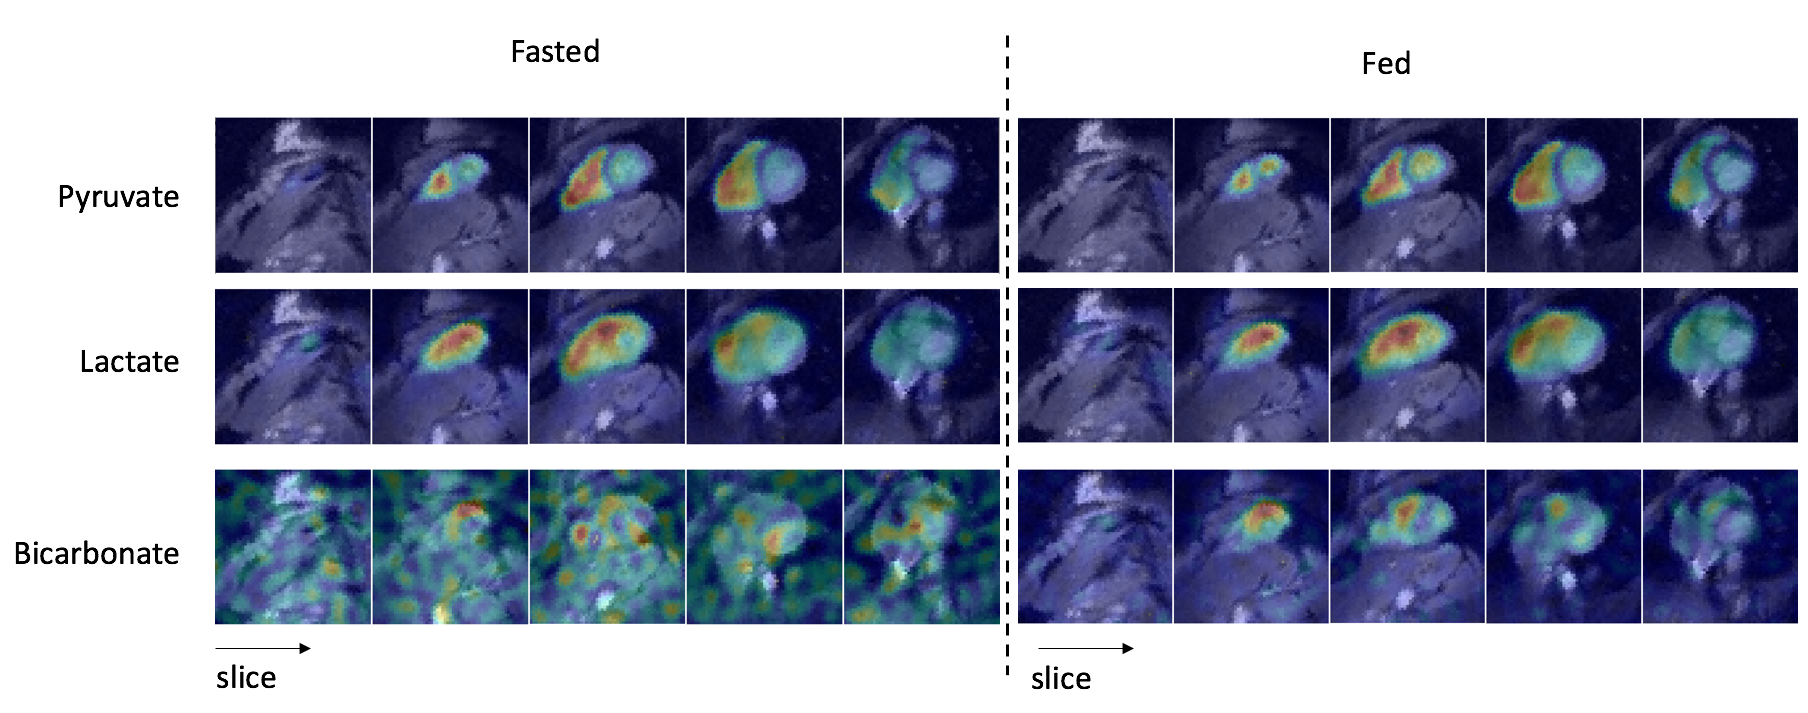
Figure 1. Representative 13C sum-over-time (AUC) images of
pyruvate, lactate and bicarbonate in the fasted and fed states overlaid on 1H
short-axis images. The 13C metabolite images
are scaled to their maximum metabolite AUC across all slices. The 13C-bicarbonate shows obvious increased
signal in the fed state, and the 13C-lactate was also increased in the fed
state.
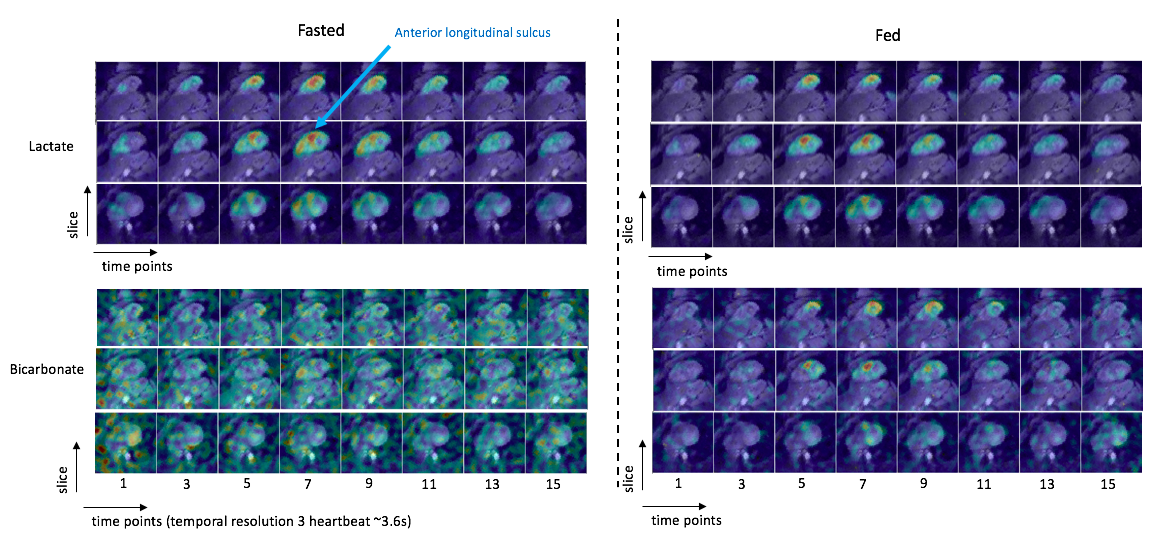
Figure 2. Representative 13C multi-slice dynamic images of
lactate and bicarbonate at the fasted and fed states. The 13C metabolite images
are scaled to their maximum metabolite signal across all slices and time points. Lactate first appears within the heart chambers
and then within the heart wall.
Bicarbonate appears primarily localized to the heart wall.
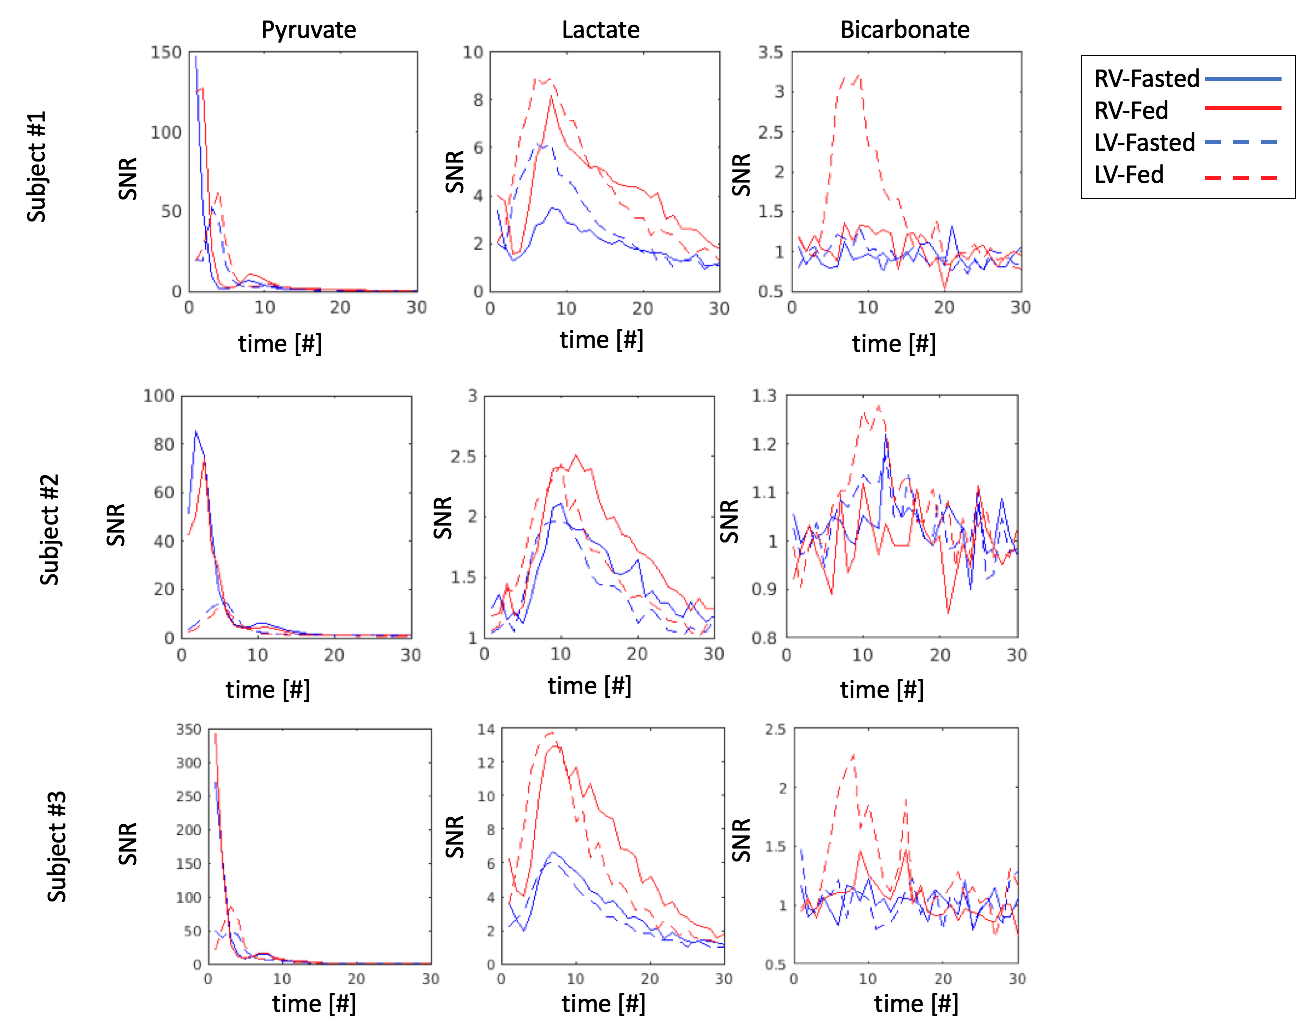
Figure 3. Dynamic curves of pyruvate, lactate and
bicarbonate across three subjects. Signals including the chambers and wall of the
left ventricle (LV) and the right ventricle (RV)
at the fasted and fed states are plotted.
The pyruvate dynamics are relatively consistent between states. The lactate signal is increased in the fed
state, but the dynamic shape appears unchanged.
For the pyruvate, the RV signal appears first, while for lactate, the LV signal appears to increase first despite a small amount of the RV signal appearing at the beginning.
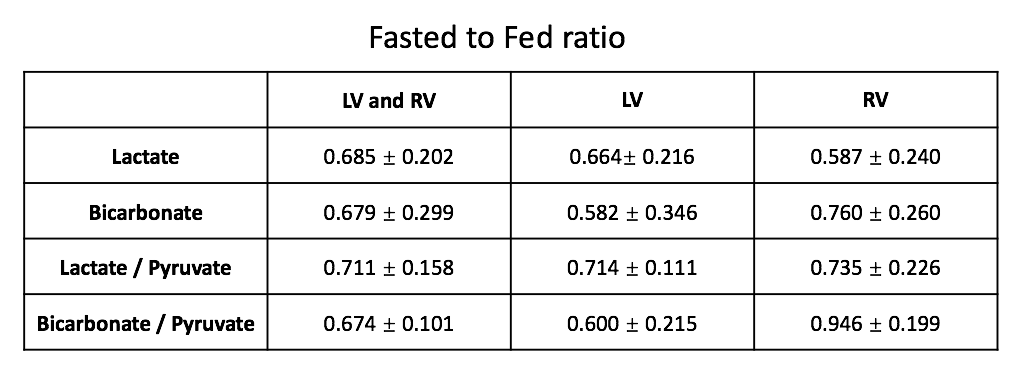
Figure 4. Metabolite ratios between the fasted and fed
states for the left ventricle (LV), right ventricle (RV), as well as both
ventricles. There were consistent
increases in observed metabolites in the fed state, and normalization to
pyruvate made this increase more consistent.