3002
Hyperpolarized [1-13C]pyruvate MR spectroscopic imaging to detect metabolic changes in liver in a high-fat diet rat model of NASH and diabetes1Radiology and Biomedical Imaging, University of California San Francisco, San francisco, CA, United States, 2Peking Union Medical College Hospital, Peking, China, 3Department of Pathology, University of California San Francisco, San francisco, CA, United States, 4Liver center, University of California San Francisco, San Francisco, CA, United States, 5Department of Medicine, Division of Gastroenterology, University of California San Francisco, San francisco, CA, United States, 6Liver center, University of California San Francisco, San francisco, CA, United States, 7Biomedical Magnetic Resonance Laboratory, Washington University School of Medicine, St. Louis, MO, United States, 8Liver center, University of California San Francisco, San Franscisco, CA, United States
Synopsis
The present study was focused on using HP 13C MRSI to detect noninvasively metabolic changes in diabetic liver rats fed with a high-fat diet. Planned treatment is 20 weeks to induce NASH, but we present interim data at 4 weeks of treatment. Liver fat signal fraction was significantly increased. In animals, in which the fat and body weight increased, lactate/pyruvate ratio was significantly decreased. This might be explained by a stimulation of gluconeogenesis by high levels of fatty acids in the liver. Long-term monitoring allows us a better understanding of the metabolic changes in the progression from NAFLD diabetic rats.
Introduction
Non-alcoholic fatty liver disease (NAFLD) is the most common cause of chronic liver dysfunction and a significant public health problem. Non-alcoholic steatohepatitis (NASH) is the progressive and more severe form of NAFLD, characterized histologically by macrovesicular steatosis, ballooning degeneration of hepatocytes and inflammation. Patients with NASH have higher risk of liver fibrosis, cirrhosis, and potentially of hepatocellular carcinoma compared to those with simple steatosis. There is currently no reliable noninvasive test for monitoring the progression of NAFLD into NASH. Cellular metabolite abnormalities have been detected using hyperpolarized 13C MRSI in animal models of fatty liver induced by a high-fat diet1. Moreover, high conversion of [1-13C]Pyruvate to [1-13C]Lactate has also been reported in obese and diabetic rats, which is associated with elevated gluconeogenesis2.Because patients with NAFLD frequently also have diabetes, we wished to investigate metabolic changes that occur when the two diseases are combined: namely, would diabetic rats develop similar changes in [1-13C]pyruvate metabolism to those previously observed in non-diabetic rats, as they progress to fatty liver and NASH? If this were true, this would support the use of HP 13C pyruvate MRI to monitor noninvasively the progress of fatty liver disease in patients.
Methods
NAFLD was induced in six adult male Zucker diabetic fatty rats (14 weeks old) by using a western diet with high fat/high cholesterol content and low choline (ENVIGO 160785)3. Planned treatment was 20 weeks to induce NASH, but we present interim data at 4 weeks of treatment.MRI scanning was performed on a 3T Bruker system with separated 1H and 13C transmit-receive volume quadrature volume coils. Rat livers were imaged at baseline and after 4 weeks on the high-fat diet. Liver fat was quantified using FLASH pulse sequence with fat and water in-phase and out-of-phase (TE= 2.2, 3.3, 4.4 and 5.5ms. TR 200ms, flip 15o and 5 slices of 2mm). For each 13C HP MRI experiment, 2.3mL 80mM [1-13C]Pyruvate was injected intravenously over 12s and the images were acquired beginning 20s after the start of the injection.
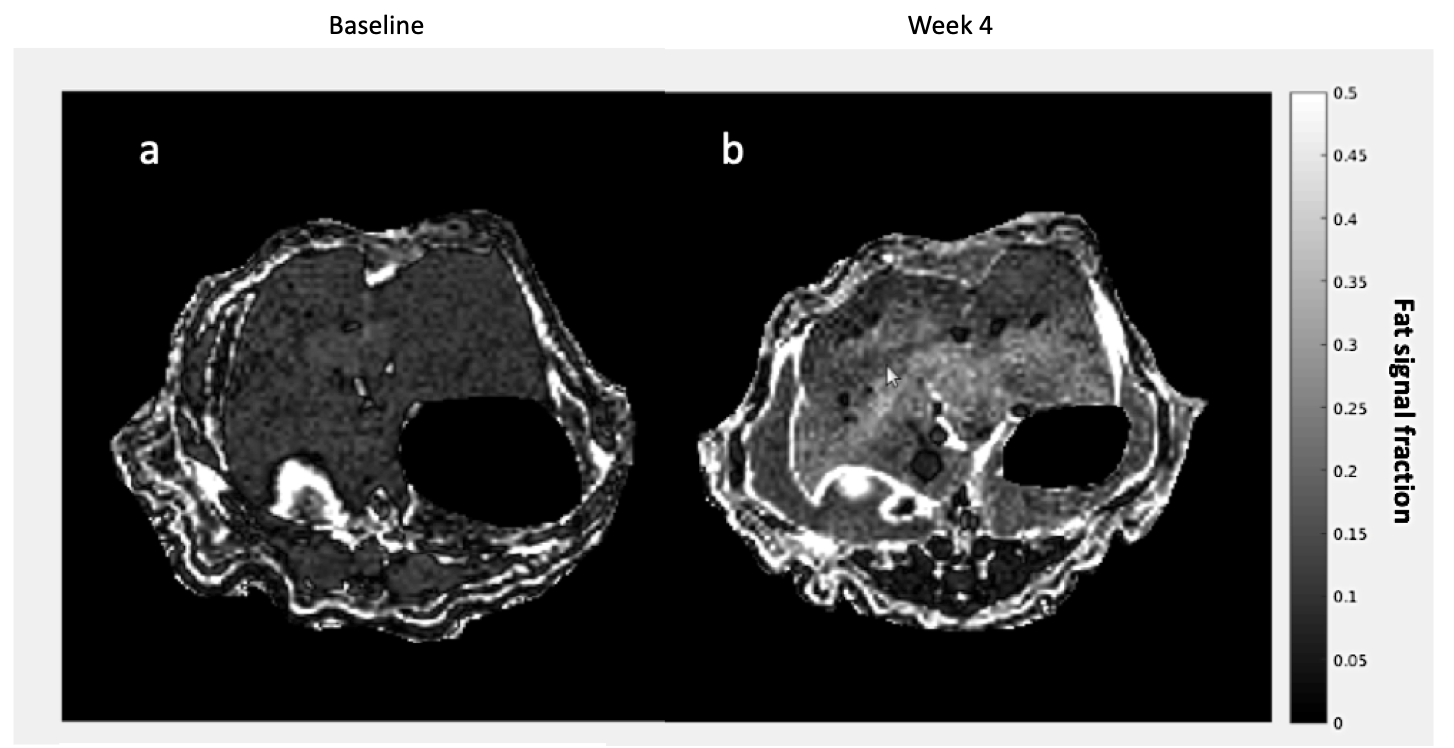
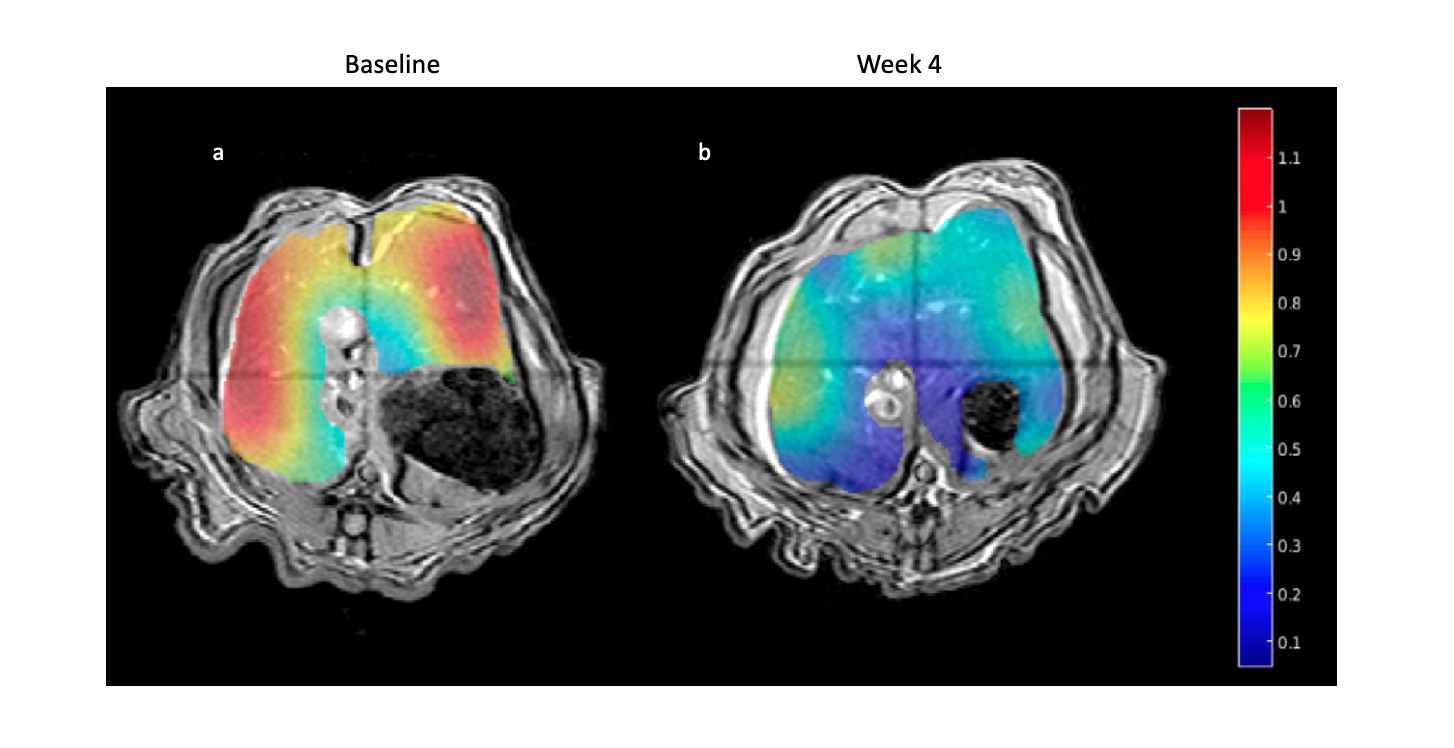
13C chemical shift images were acquired with center-out view ordering with slice thickness of 8mm, FOV 80mm x 80mm, matrix 8 x 8, flip 5°. 15 dynamic points were acquired over 45s. For the fat signal fraction (FSF), ROI were manually drawn on five axial slices in the liver (4105 ± 1703 pixels), and the values were computed as: signal fraction = (in phase image - out of phase images)/(2*in phase image)4. 13C metabolite maps were generated using SIVIC package5 and calculated by integrating the spectral peaks of lactate and pyruvate overtime on the whole slice. The area under the curve for each metabolite, within a manually prescribed liver ROI, was used to calculate the lactate/pyruvate ratio.
Results
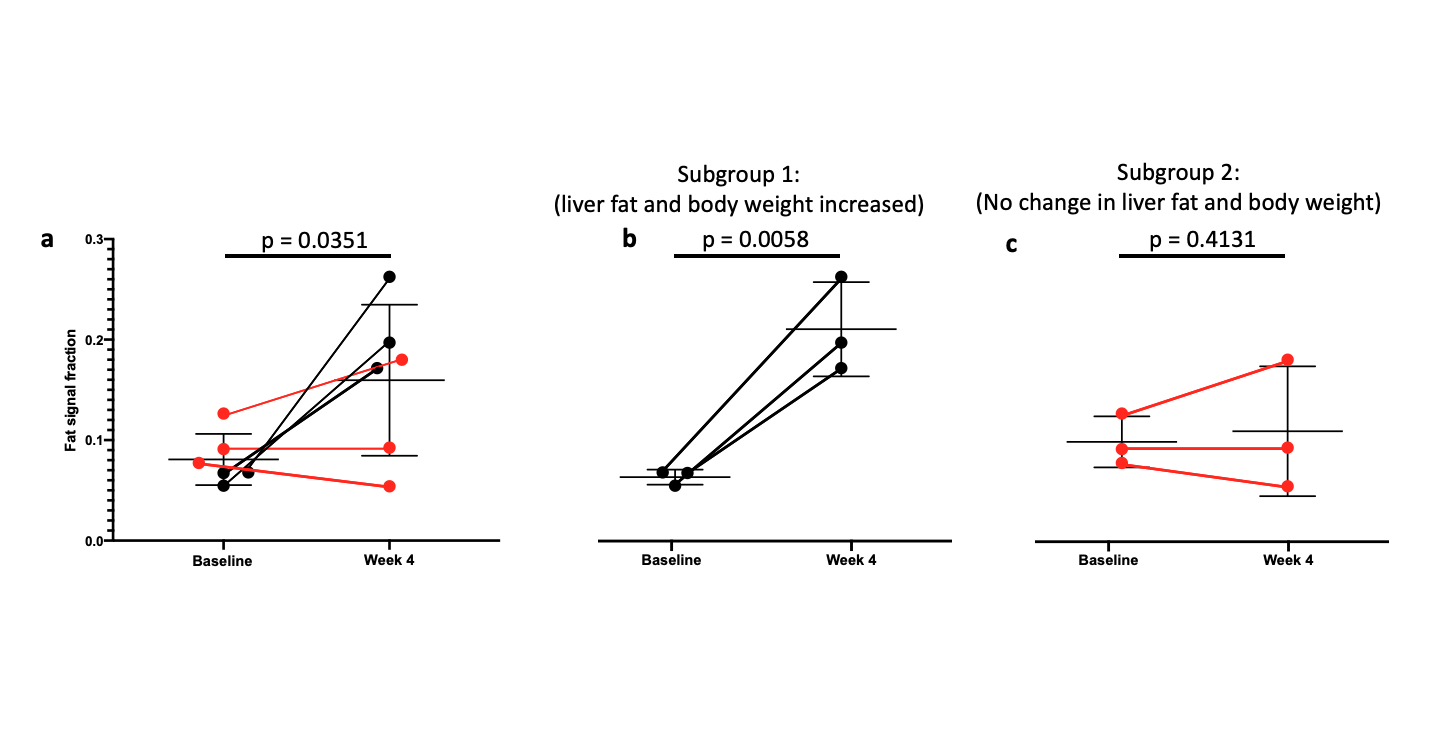
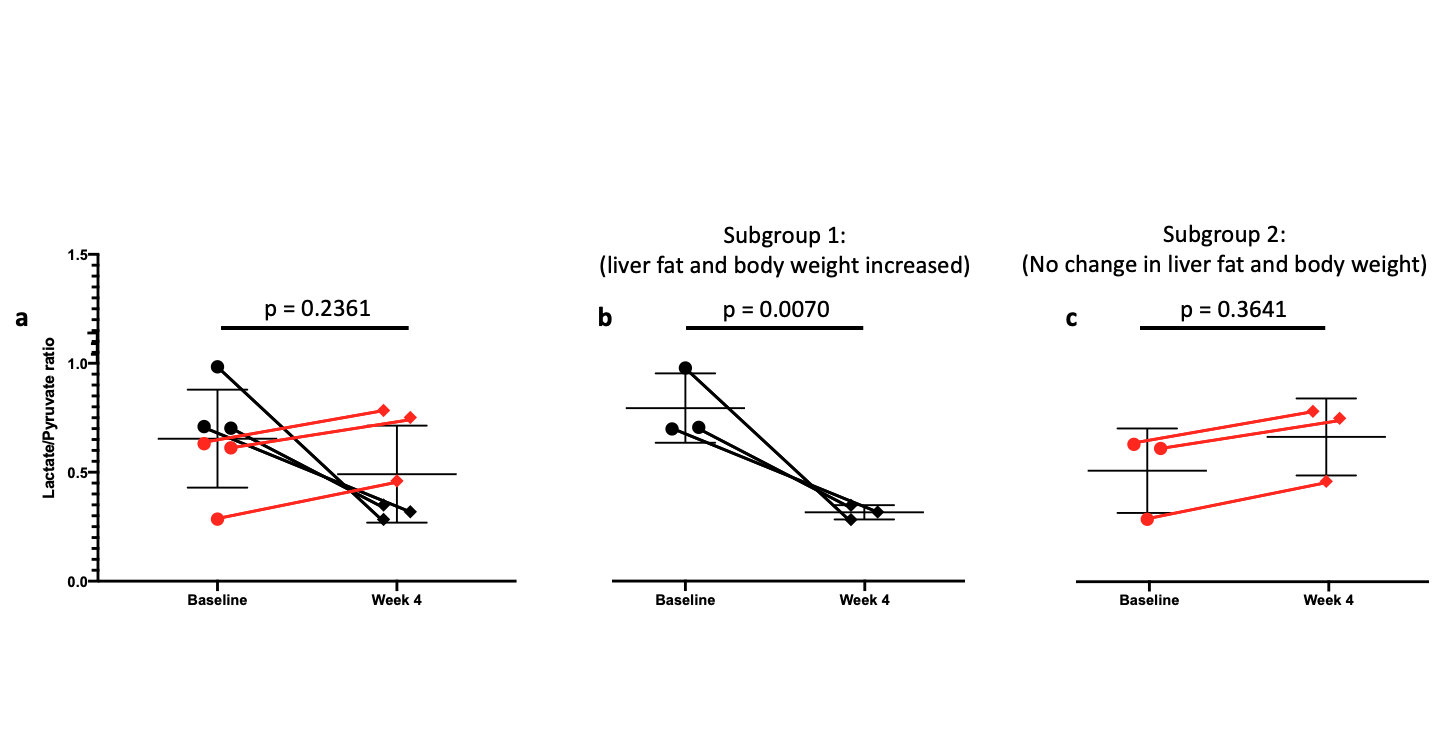
As expected, there was a statistically significant increase in the liver FSF after 4 weeks on the high-fat diet (Baseline: 0.081 ± 0.010 vs. Week 4: 0.159 ± 0.030, p = 0.035) (Figure 1a,b, Figure 2 a). Interestingly, not all rats exhibited the same increase in liver fat. One subgroup of 3 rats developed at least a doubling of liver fat, with the other subgroup of 3 rats had less than 10% increase in liver fat (Figure 2 b,c). The first subgroup had weight gain (10.8 ± 3.3%) compared to the baseline, while the second subgroup exhibited a weight loss (-4.04 ± 2.54%). The blood glucose in the first subgroup was also higher relative to the second (493.70 ± 27.38 vs. 410 ± 70.02mg/dL).From HP 13C MRSI, we observed the conversion of pyruvate to lactate in rat livers before and after the diet (Figure 3 a,b). Considering the entire set of 6 animals, the change in lactate/pyruvate ratio was not statistically significant after 4 weeks on diet (Baseline: 0.654 ± 0.091 vs. Week 4: 0.491 ± 0.090, p = 0.236) (Figure 4a). However, in the first subgroup whose liver fat and body weight increased, the lactate/pyruvate ratio showed a significant decrease (p = 0.007). The second subgroup of rats, whose liver fat and body weight did not change, also did not exhibit a significant change in lactate/pyruvate ratio (p = 0.360)(Figure 4 b,c).
Discussion
In this study, we showed that conversion of pyruvate to lactate can be altered after feeding diabetic fatty rats with a high-fat diet. We observed divergent behavior in two subgroups: the subgroup in which liver fat increased had a decrease in lactate/pyruvate ratio, whereas the subgroup where liver fat did not change had no change in lactate/pyruvate ratio. This decreased lactate/pyruvate ratio might be explained by a stimulation of gluconeogenesis by high levels of fatty acids in the liver (i.e. diverting three-carbon intermediates to glucose), or potentially by consumption of NAD(P)H reducing equivalents by oxidative stress due to lipotoxicity. Further long-term monitoring will allow us to confirm these results and have a better understanding of the metabolic changes in the progression from NAFLD toward NASH in diabetic rats. HP 13C MRI data will be correlated with the histopathology of liver at different time points.Conclusion
Alterations in lactate/pyruvate ratio are associated with fat accumulation in the livers of diabetic rats fed a high-fat diet for 4 weeks.Acknowledgements
This work has been supported by grants from NIDDK R01DK115987 and NIBIB P41EB013598.References
1. Moon CM, Oh CH, Ahn KY, et al. Metabolic biomarkers for non-alcoholic fatty liver disease induced by high-fat diet: In vivo magnetic resonance spectroscopy of hyperpolarized [1-(13)C] pyruvate. Biochem Biophys Res Commun 2017; 482(1): 112-9.
2. Morze CV, Allu PKR, Chang GY, et al. Non-invasive detection of divergent metabolic signals in insulin deficiency vs. insulin resistance in vivo. Sci Rep 2018; 8(1): 2088.
3. Wang X, Zheng Z, Caviglia JM, et al. Hepatocyte TAZ/WWTR1 Promotes Inflammation and Fibrosis in Nonalcoholic Steatohepatitis. Cell Metab 2016; 24(6): 848-62.
4. Reeder SB, Sirlin CB. Quantification of liver fat with magnetic resonance imaging. Magn Reson Imaging Clin N Am 2010; 18(3): 337-57, ix.
5. Crane JC, Olson MP, Nelson SJ. SIVIC: Open-Source, Standards-Based Software for DICOM MR Spectroscopy Workflows. Int J Biomed Imaging 2013; 2013: 169526.
Figures