2999
A new approach involving combination of 1H MRS and [2,2,2′-2H3]acetate administration to assess cerebral neurotransmission in vivo1Department of Radiology, University of Pennsylvania, Philadelphia, PA, United States, 2Department of Neurology, University of Pennsylvania, Philadelphia, PA, United States, 3Sidra Medicine, Doha, Qatar, 4LARC, Qatar University, Doha, Qatar
Synopsis
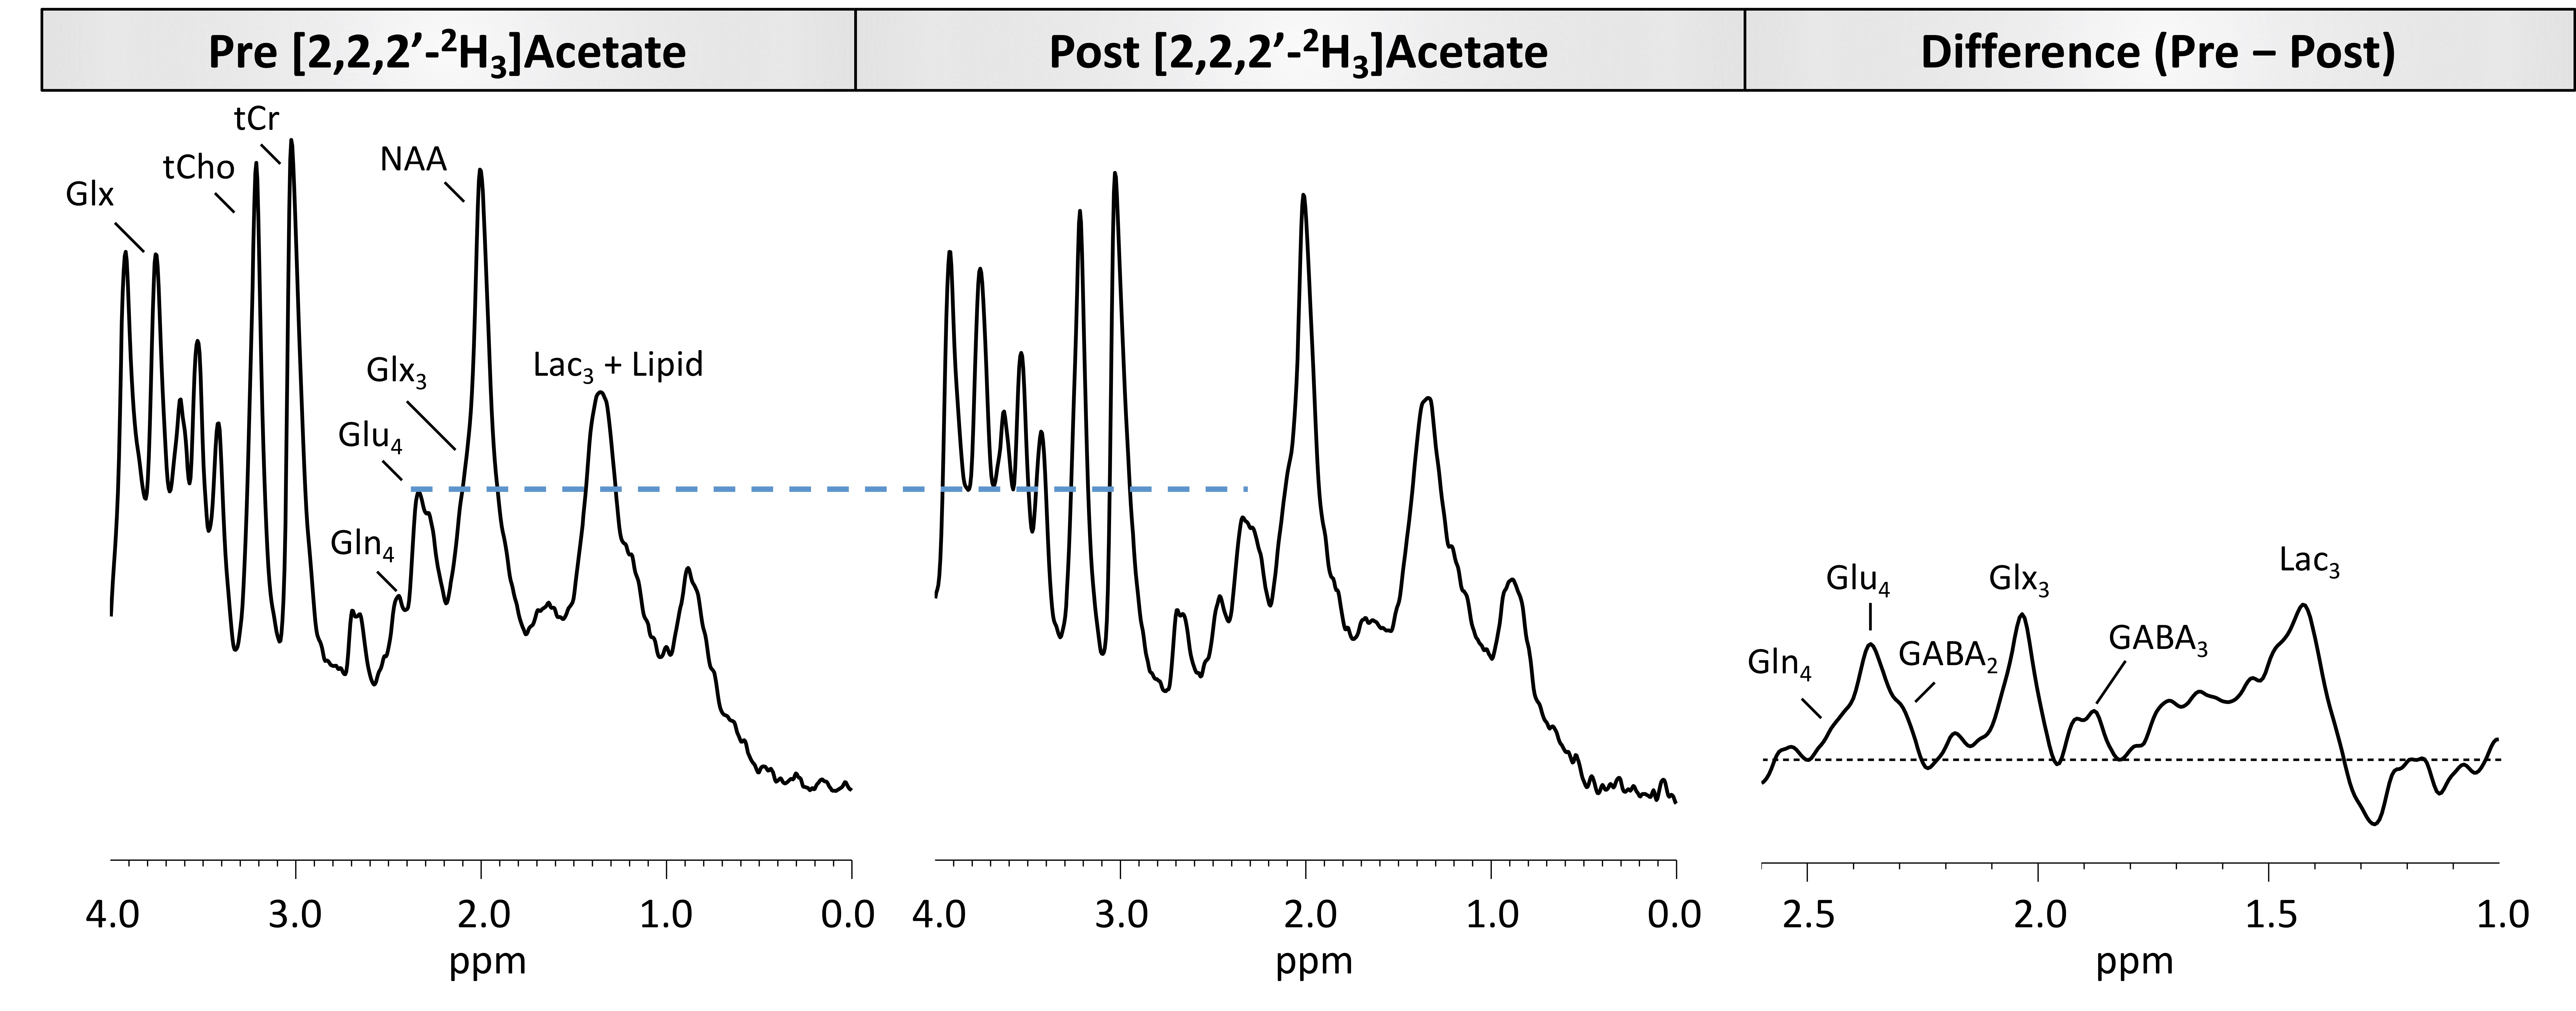
1H MR spectroscopy is currently the only technique that allows the non-invasive detection and quantification of a wide range of neurochemicals. In this study, we performed 1H MRS in conjunction with the administration of [2,2,2′-2H3]acetate to measure turnover kinetics of glutamate, glutamine and GABA in rat brain. As 2H is invisible on 1H MRS, the turnover of metabolites will lead to a corresponding drop in their 1H MR signal visualized by subtraction of the post-[2,2,2′-2H3]acetate administration from the Pre-administration 1H MR spectra. The fractional enrichment data can be fitted to evaluate the rates of cerebral glutamatergic and GABAergic neurotransmitter cycling.
Introduction
Over the last 3 decades, 13C magnetic resonance spectroscopy (MRS) in conjunction with administration of 13C-labeled substrates has provided great insights into cerebral energetics and neurotransmitter cycling1,2. Recently, 2H MRS also referred to as deuterium MRS (DMRS), has been remarkably used to assess tissue metabolic kinetics following administration of deuterated subtrates3,4. Here we present a novel strategy, which combines the administration of [2,2,2′-2H3]acetate and 1H MRS to assess cerebral neurotransmission. Acetate is selectively taken up by glial cells in the brain, followed by the formation of acetyl-CoA which enters the TCA cycle to form α-ketoglutarate and glutamate (Figure 1)5,6. The glutamate is rapidly converted into glutamine by glutamine synthetase (GS). Glutamine is transferred to neurons to replenish the neuronal glutamate pool by conversion of neuronal glutamine into glutamate by the action of phosphate-activated glutaminase (PAG). The administration of [2,2,2′-2H3]acetate into the bloodstream leads to the transfer of 1H MR invisible 2H into downstream metabolites of the TCA cycle and neurotransmission. The detection of exchanged label turnover quantitative measurement (ELOQUENT) by 1H MRS (eMRS) has given rise to a novel approach for measuring cellular energetics in vivo. The ability to quantify the metabolites and high spectral resolution offered by 1H MRS enables the monitoring of kinetics of label transfer into crucial metabolites, i.e. glutamate (Glu), glutamine (Gln), g-aminobutyric acid (GABA), and lactate (Lac). In the current report, 1H MRS studies performed in the brains of normal rats following the administration of [2,2,2′-2H3]acetate highlight eMRS as a promising approach to determine cerebral neurotransmission in vivo.Methods
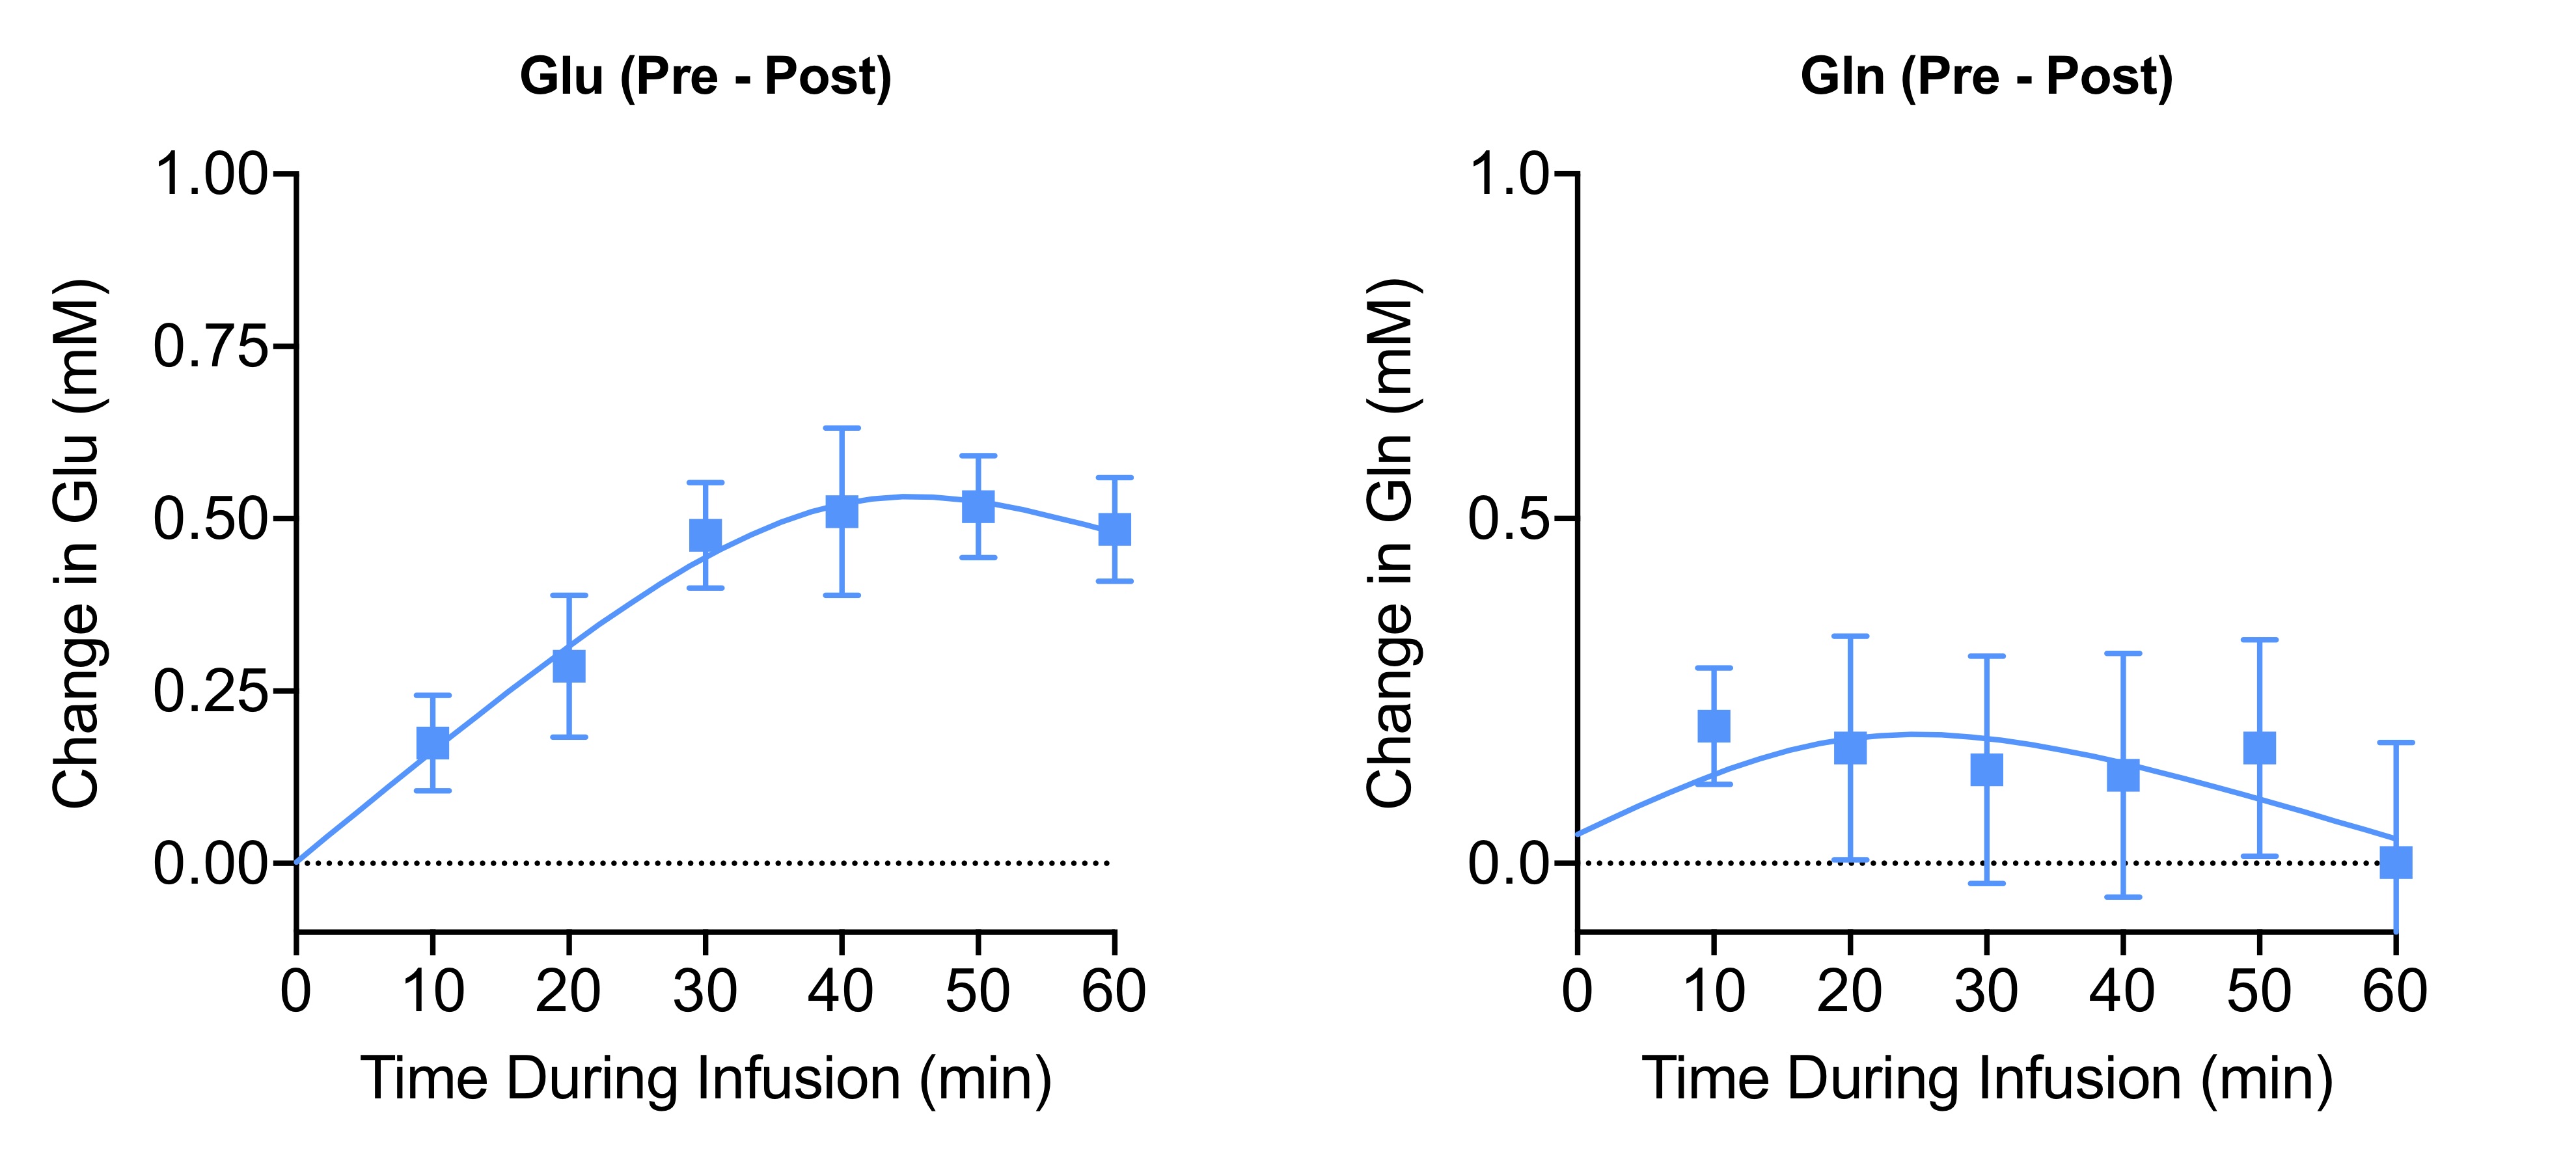
MR experiments on six 3-4-month-old male CDF rats (220-250 g) were performed on a 9.4T Bruker scanner using a 35-mm diameter volume coil. Body temperature and respiration rates and monitored and maintained at 37 °C and 40-60 BPM, respectively. 1H MRS spectra were acquired from a voxel localized in the mid-brain using PRESS (TR/ TE = 2500/16 ms, spectral width = 4 kHz, 90° pulse bandwidth = 5400 Hz, 180° pulse bandwidth = 2400 Hz, number of points = 4006, VAPOR water suppression, averages = 128, scan time = 5.5 min). In addition to the water suppressed spectrum, another spectrum with 4 averages was acquired without water suppression to obtain the water reference signal for normalization. Following the pre-injection 1H MRS scan, the rats were intravenously injected with [2,2,2′-2H3]acetate for 10 min via infusion pump using an infusion protocol as described previously. During and post-[2,2,2′-2H3]acetate administration, a series of 1H MR spectra were gathered until 60 minutes.Metabolites were quantified using LCModel software7. Once metabolite concentration at each time point was estimated, calculation of metabolite fractional enrichment (FE) was performed by subtracting post-infusion levels from pre-infusion levels. All FE enrichment plots report mean values with the standard error of the mean. Fitted curves for FE plots were generated to provide a visual aid of labeling using the following exponential plateau equation, Y=YM-(YM-Y0)exp(-kx), where Y0 is the starting population, YM is the maximum population, and k is the rate constant.
Results and Discussion
Subtraction of the 90-minute post-infusion 1H MRS spectrum from the pre-infusion spectrum revealed a marked increase in the Glu-H4 resonance (Figure 2). In addition to Glu-H4, other resonances including Glx3, Glu-H4, Gln-H4, GABA-H2, and Lac-H3 were observed, all of which were well above background levels. To estimate the FE for metabolites, post-infusion concentration measurements taken by LCModel at every time point were subtracted from pre-infusion measurements and divided by pre-infusion values. eMRS enabled individual quantification of 2H labeling of Glu (Figure 3A) and Gln (Figure 3B), with 0.50 ± 0.12 mM increase in 2H labeled Glu-4 (glutamate labeled with 2H at carbon 4), and 0.21 ± 0.12 mM increase in Gln-4 (glutamine labeled with 2H at carbon 4) observed 40min post [2,2,2′-2H3]acetate infusion. These labeling patterns are similar in regards to fractional enrichment of metabolites with published 13C MRS literature8,9. The estimation of the metabolic fluxes by fitting the FE data obtained via eMRS experiments is currently ongoing, we anticipate these results would compare well with the values already reported in the literature10,11. The findings reporting rates of glutamatergic, GABAergic and glial TCA cycles in addition to glutamatergic and GABAergic neurotransmitter cycling rates in a healthy rat brain will be presented at the meeting. This approach is expected to enable a wide range of studies probing metabolic derangements in vivo across medical disciplines.Acknowledgements
This project was supported by the National Institute of Biomedical Imaging and Bioengineering of the National Institute of Health under award number P41EB015893.
References
1. Shulman, R. G., & Rothman, D. L. 13C NMR of intermediary metabolism: implications for systemic physiology. Ann. Rev. Phys. 63, 15-48 (2001)
2. Henry, P. G., et al. In vivo 13C NMR spectroscopy and metabolic modeling in the brain: a practical perspective. Magn. Reson. Imaging, 24, 527-539 (2006)
3. Lu, M., Zhu, X. H., Zhang, Y., Mateescu, G. & Chen, W. Quantitative assessment of brain glucose metabolic rates using in vivo deuterium magnetic resonance spectroscopy. J. Cereb. Blood Flow Metab. 37, 3518-3530 (2017)
4. De Feyter, H. M. et al. Deuterium metabolic imaging (DMI) for MRI-based 3D mapping of metabolism in vivo. Sci. Adv. 4, eaat7314 (2018)
5. Waniewski RA and Martin DL Preferential utilization of acetate by astrocytes is attributable to transport. J Neurosci 18:5225–5233 (1998)
6. Badar-Goffer RS, Bachelard HS, Morris PG Cerebral metabolism of acetate and glucose studied by 13C-n.m.r. spectroscopy. A technique for investigating metabolic compartmentation in the brain. Biochem J 266:133–139 (1990)
7. Provencher, S. W. Automatic quantitation of localized in vivo 1H spectra with LCModel. NMR Biomed. 14, 260-264 (2001)
8. de Graaf, R. A., Mason, G. F., Patel, A. B., Behar, K. L. & Rothman, D. L. In vivo 1H-[13C]-NMR spectroscopy of cerebral metabolism. NMR Biomed. 16, 339-357 (2003)
9. van Eijsden, P., Behar, K. L., Mason, G. F., Braun, K. P., & De Graaf, R. A. In vivo neurochemical profiling of rat brain by 1H‐[13C] NMR spectroscopy: cerebral energetics and glutamatergic/GABAergic neurotransmission. J. Neurochem. 112, 24-33 (2010)
10. Tiwari, V., Ambadipudi, S., & Patel, A. B. Glutamatergic and GABAergic TCA cycle and neurotransmitter cycling fluxes in different regions of mouse brain. J. Cereb. Blood Flow Metab. 33, 1523-1531 (2013)
11. Duarte, J. M., & Gruetter, R. Glutamatergic and GABAergic energy metabolism measured in the rat brain by 13C NMR spectroscopy at 14.1 T. J. Neurochem. 126, 579-590 (2013)
Figures