2997
Determination of the oxygen partial pressure in hind limb ischemia by 19F MRI1Molecular Cardiology, University Clinic Duesseldorf, Düsseldorf, Germany, 2Pharmacology and Clinical Pharmacology, University Clinic Duesseldorf, Düsseldorf, Germany
Synopsis
Tissue hypoxia induces a variety of detrimental processes. Therefore, the determination of oxygen partial pressure can be helpful to assess the current oxygen supply of an organ. 19F MRI showed to be useful for the quantification of tissue pO2 by exploiting the paramagnetic effect of O2 on the longitudinal relaxation rate R1 of perfluorocarbon nanoemulsions. Thus, allowing the calculation of pO2 through experimental R1 data. In the present study, we applied this approach for monitoring the gradual recovery of tissue oxygenation in a murine model of hind limb ischemia. We observed tissue oxygenation recovery within 2 weeks post-occlusion.
Introduction
Oxygen plays an indispensable role in the physiology of the body. The diffusion of oxygen from blood into tissue is essential for survival.1 In this context, tissue oxygen partial pressure (pO2) gives crucial information about the physiological state of an organ. In different pathological conditions, such as cancer, diabetes, or coronary heart disease impaired oxygenation leads to tissue hypoxia inducing a variety of detrimental processes.1 Here, the determination of tissue pO2 can be helpful to assess the current supply of an organ and to verify pharmacological treatment to improve its oxygenation.2 Up to now, the direct and non-invasive measurement of the tissue pO2 is challenging. 19F MRI showed to be useful for the quantification of tissue pO2 by exploiting the high oxygen affinity of perfluorocarbon nanoemulsions (PFCs). Since molecular oxygen O2 is paramagnetic, it linearly increases the longitudinal relaxation rate R1 of the fluorine nuclei in PFCs,3 therefore, allowing the calculation of pO2 through experimental R1 data. In the present study, we aimed to apply this approach for monitoring the gradual recovery of tissue oxygenation in a murine model of hind limb ischemia (HLI).Methods
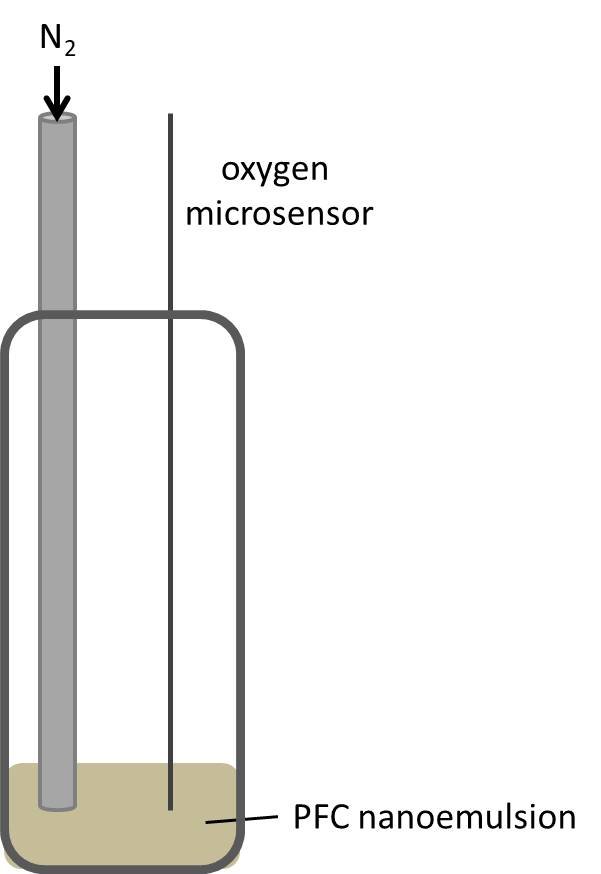
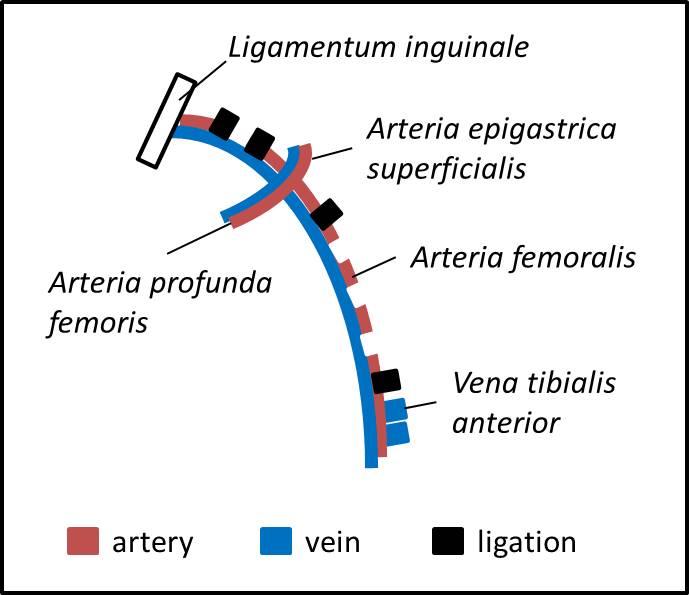
All MR experiments were performed in a vertical NMR spectrometer (Bruker) at 9.4 T using an actively shielded 40 mm gradient set in combination with a 25-mm 1H/19F resonator tunable to both 1H (linear) and 19F (quadrature). First, calibration curves were generated for our setting at different temperatures. The setup for those calibration experiments is shown in figure 1. During the experiments, the pO2 was continuously measured in situ with an oxygen microsensor (Presens). By purging the sample with N2, the pO2 value was declined stepwise. 19F RARE VTR was performed at a fixed echo time with varying repetition times, to determine the longitudinal 19F relaxation rate R1. The same sequence was used to determine the 19F R1 of the PFCs injected into the legs of the HLI mice (see below). Comparing the in vivo results with the calibration curves, pO2 values can be assigned for the measured R1 values. For in vivo experiments, a model of unilateral HLI was used, since this murine model shows fast recovery of perfusion with development of a sufficient collateral vessel system.4,5 HLI was performed in the left leg according to Driesen et al.6. In brief, ligation was performed through a double knot of a thread at four different locations around the artery as shown in figure 2. Subsequently, the artery was cut between the 1st and 2nd as well as the 3rd and 4th ligation and excised between those ligation sites. After suturing of the operation sites, PFCs were injected into calf muscles directly beneath the knee of both the left leg affected by HLI and the right leg as control.Results and Discussion
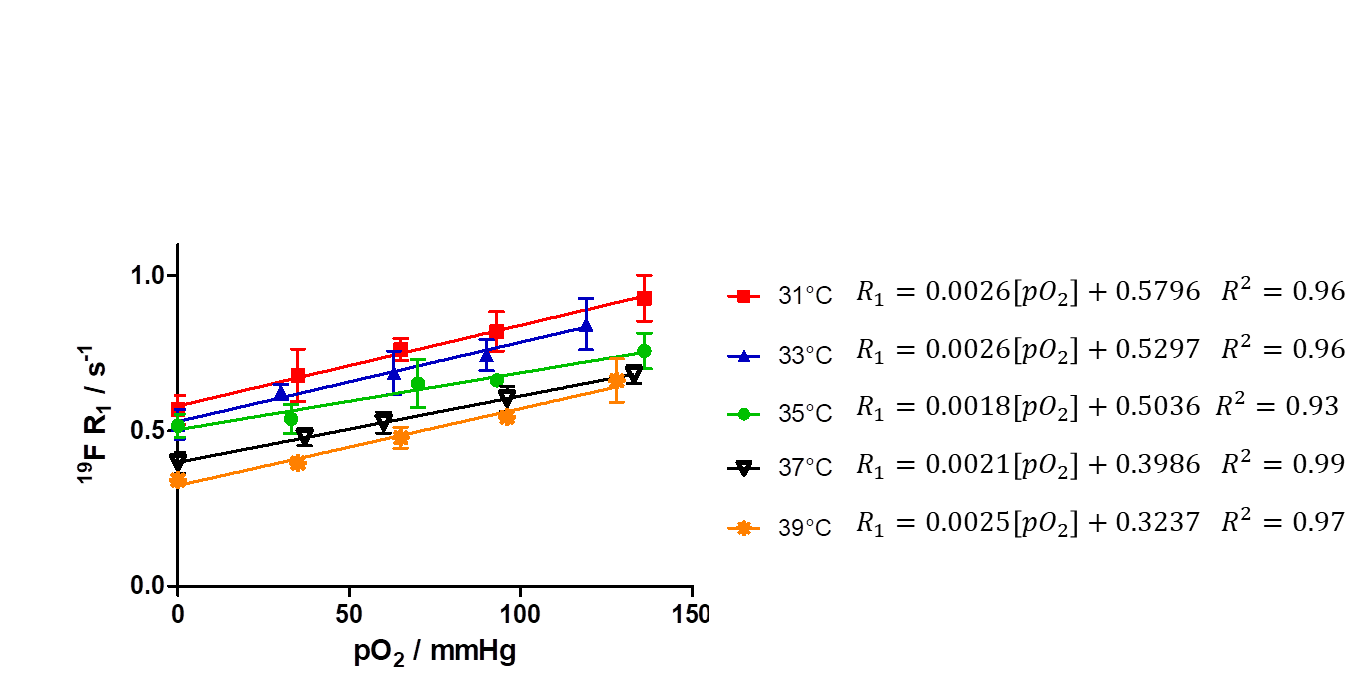
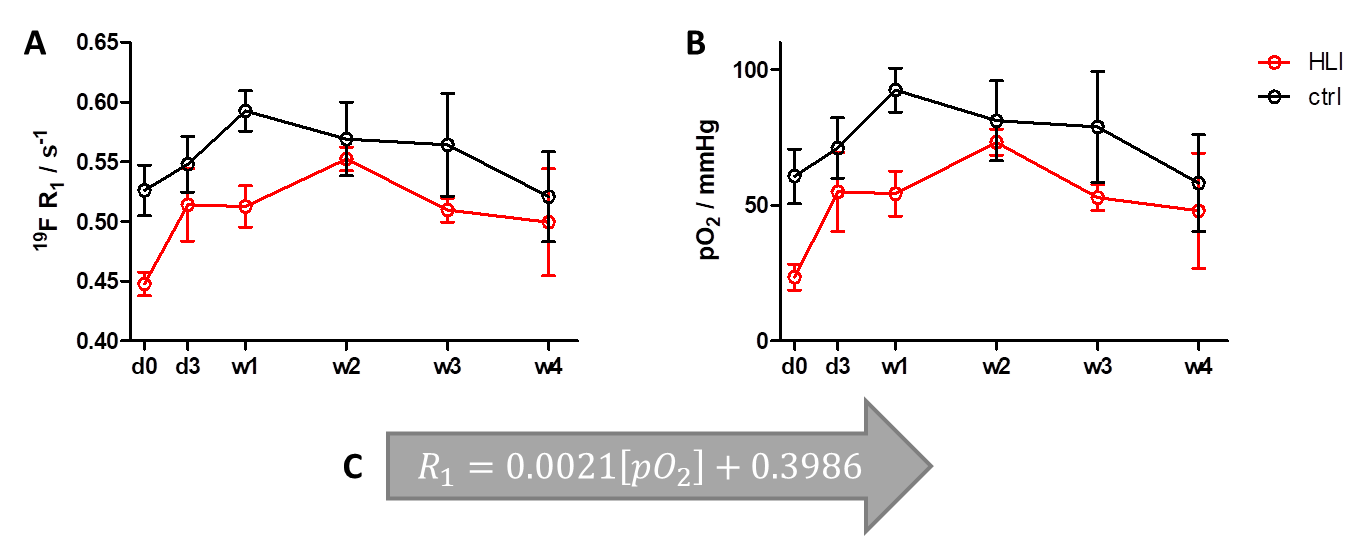
In a first step, we acquired in vitro calibration curves for our vertical setting at 9.4T using a 20-mm NMR tube and declining the pO2 value stepwise through purging the PFC sample with N2 – a process which was continuously controlled by an oxygen microsensor (figure 1). Figure 3 shows the obtained relations between 19F R1 and pO2 in dependence of the temperature. As can be seen, we found an excellent correlation between those parameters at each temperature with 19F relaxation rates becoming shorter with increasing temperature – a similar temperature dependence as shown by Kadayakkara et al.7. As expected, the calibration curves also show clearly the linear incline of R1 with increasing pO2. As compared to the correlations recently reported by Khalil et al.,8 who purged the samples before the MR scans for a given time period with a mixture of O2+N2, we obtained an even superior correlation due to the tightly controlled experimental conditions. Next, we applied the correlation curves obtained in vitro to the in vivo monitoring of tissue pO2 after HLI. To this end, the 19F R1 of the injected PFCs in HLI mice was surveyed over 4 weeks (see figure 4A). The difference between the ischemic leg and the control leg is clearly distinguishable during the first week. As expected, the lower pO2 in the ischemic muscle tissue led to a substantial decline of the 19F relaxation rate. From the second week on, the significant difference between the two groups diminished. Using the linear regression of the calibration curve at 37 °C (figure 4C), pO2 values were calculated: R1=0.0021[pO2]+0.3986; R2=0.99Figure 4B shows the increase of pO2 over time, leading to the conclusion that tissue oxygenation recovers already after 2 weeks post-occlusion which nicely matched with the observed re-gain of perfusion by MR angiography (data not shown).
Conclusion
Our results show a significant decline in R1 of PFCs in HLI mice, comparing the ischemic hind leg with the control leg. Due to lower tissue oxygenation in the ischemic hind leg, the PFCs are less exposed to the paramagnetic effect of molecular oxygen, hence, leading to lower 19F relaxation rates. Within 2 weeks post-occlusion, we could observe tissue oxygenation recovery in HLI mice. Thus, calculation of tissue pO2 through 19F R1 measurements represents a suitable method for the monitoring of pO2 in vivo.Acknowledgements
The authors would like to thank Prof. Jürgen Schrader and Prof. Jens Fischer for their continuous support and encouragement. The work shown herein was supported financially by the Deutsche Forschungsgemeinschaft (DFG) and subprojects of the Sonderforschungsbereich (SFB).References
1. Carreau A, Hafny-Rahbi BE, Matejuk A, Grillon C, Kieda C. Why is the partial oxygen pressure of human tissues a crucial parameter? Small molecules and hypoxia. J Cell Mol Med. 2011;15(6):1239-1253.
2. Schneckmann R. PhD thesis: Bedeutung der Hyaluronsäure-Synthase 3 für die Angiogenese und Arteriogenese. 2018. Heinrich-Heine University Duesseldorf.
3. Parhami P, Fung BM. Fluorine-19 relaxation study of perfluoro chemicals as oxygen carriers. J Phys Chem. 1983;87(11):1928-1931.
4. Sherman JA, Hall A, Malenka DJ, De Muinck ED, Simons M. Humoral and Cellular Factors Responsible for Coronary Collateral Formation. Am J Cardiol. 2006;98(9):1194-1197.
5. Schaper W. Collateral circulation. Basic Res Cardiol. 2009;104(1):5-21.
6. Driesen T, Schuler D, Schmetter R, et al. A systematic approach to assess locoregional differences in angiogenesis. Histochem Cell Biol. 2016;145(2):213-225.
7. Kadayakkara DK, Damodaran K, Hitchens TK, Bulte JWM, Ahrens ET. 19F Spin-lattice Relaxation of Perfluoropolyethers: Dependence on Temperature and Magnetic Field Strength (7.0-14.1T). J Magn Reson San Diego Calif 1997. 2014;0:18-22.
8. Khalil AA, Mueller S, Foddis M, et al. Longitudinal 19F magnetic resonance imaging of brain oxygenation in a mouse model of vascular cognitive impairment using a cryogenic radiofrequency coil. Magn Reson Mater Phys Biol Med. 2019;32(1):105-114.
Figures