2996
19F MRS Detection of Tau Aggregates Using Lansoprazole in an Ex Vivo Rat Model of Alzheimer’s Disease1Biology, Lakehead University, Thunder Bay, ON, Canada, 2Chemistry and Materials Science, Lakehead University, Thunder Bay, ON, Canada, 3Thunder Bay Regional Health Research Institute, Thunder Bay, ON, Canada, 4Chemistry, Lakehead University, Thunder Bay, ON, Canada, 5Northern Ontario School of Medicine, Thunder Bay, ON, Canada
Synopsis
Neurofibrillary tangles (NFTs) composed of hyperphosphorylated tau protein are pathological characteristics of Alzheimer’s Disease (AD). Thus, the use of biosensors that bind to NFTs are beneficial for in vivo detection of tauopathy. This study evaluates the use of Lansoprazole (LSZ) as an indicator of NFTs in AD brains. 19F MRS of AD and control brains with LSZ was acquired using a 3.0T clinical MRI scanner. We demonstrate that the 19F signal from LSZ interacts with NFTs in a rat model of AD. This shows potential in using LSZ to distinguish between AD and healthy brains with a clinical 3.0T scanner.
Introduction
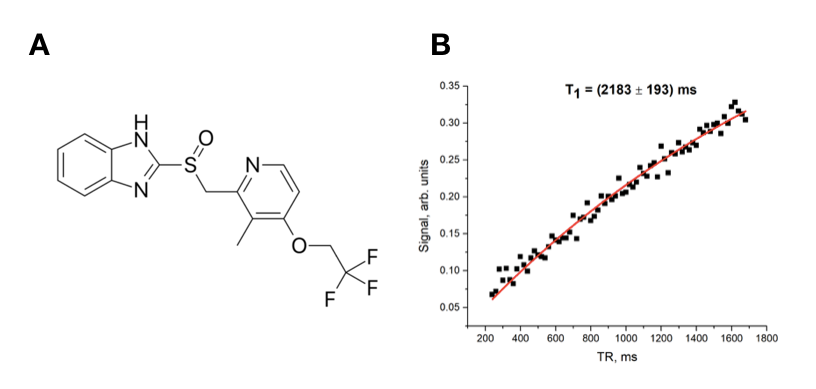
Neurofibrillary tangles (NFTs) composed of hyperphosphorylated tau protein are pathological characteristics of Alzheimer’s Disease (AD). The number of NFT deposits are correlated with the severity of cognitive dysfunction during the progression of AD1. Thus, the use of biosensors that selectively bind to NFTs within the brain can prove to be beneficial in the diagnosis of AD and in determination of its severity. Currently, research on in vivo imaging of tau pathology in AD has been focused on PET radiotracers2,3,4. However, PET has low spatial resolution, uses ionizing radiation and is a costly procedure5. Herein we focus on Lansoprazole (LSZ) (Fig.1A), a molecule known to pass the blood-brain barrier and exhibit a high affinity to tau fibrils2,3,4, as an MRI biosensor to detect tauopathy with 19F magnetic resonance spectroscopy (MRS) in a rat model of AD.Methods
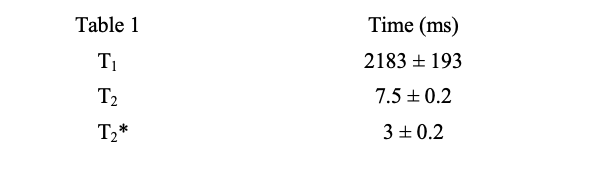
Two control brains and one AD brain were obtained from two 17-month healthy rats and one 28-month Tg355F-AD rat, respectively. LSZ (>98%) was ordered from Sigma Aldrich. All MRS experiments were conducted using a clinical Philips Achieva 3T MRI scanner equipped with a custom-built quadrature coil tuned to the resonance frequency of fluorine-19 (120.15 MHz). T1 and T2* relaxation times of 18mM LSZ solution in ethyl acetate were measured while using single-voxel spectroscopy with the following parameters: TE/TR=0.14/750.0 ms, BW=32 kHz, sample number=2048, NSA=4. T1 measurement was conducted by dynamic SV MRS with varying TR in a range between 200 and 1700 ms with a step of 20 ms. T2* was obtained by fitting the FID to the exponential decay. To obtain the T2 relaxation parameter, the spectrum was acquired using the spin-echo technique. T2 was obtained by fitting the spin-echo FID to the exponential decay. To determine if LSZ can be used for MRI detection of NFTs, 18mM LSZ solution was added to two control (0.15g and 0.17g) and one AD (0.20g) homogenized whole brain hemispheres and centrifuged at 6,000 rpm for six minutes. Samples were then washed twice with ethanol to remove unbound LSZ. 19F MRS spectra of AD and control brain with LSZ were acquired using an SV MRS with the following parameters: TE/TR=0.14/1894 ms, flip angle=70°, NSA=144, BW= 32kHz, sampling number= 2048. All obtained spectra were analyzed using a home-built MatLab script in MATLAB R2016b (The Mathworks, Inc, Natick, MA).Results and Discussion
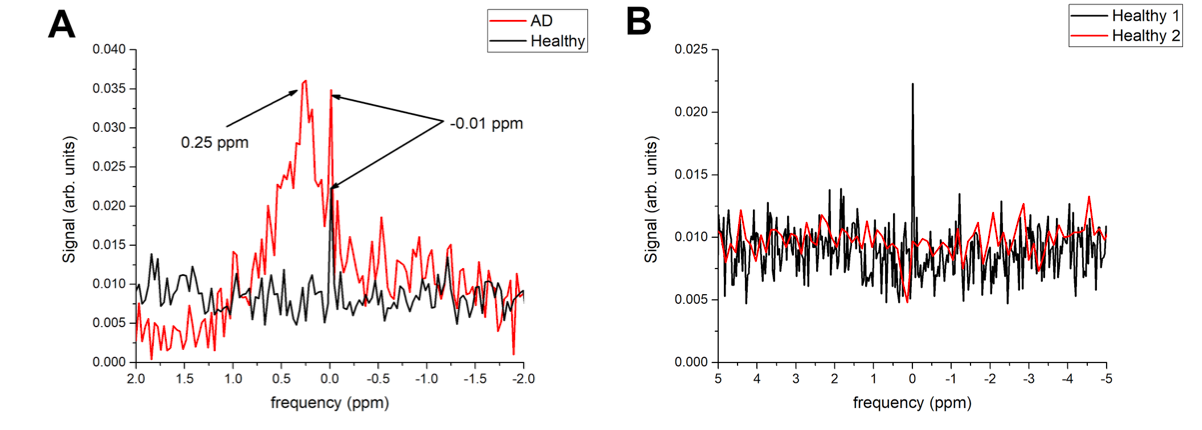
The relaxation times of LSZ are shown in Table 1. The fitting curve of the LSZ signal magnetization recovery is shown in Fig. 1B. The spin-lattice relaxation time was equal to 2183±193 ms. The obtained MRS spectra of one healthy and AD studied brains are shown in Fig. 2A and the comparison of two healthy brains in Fig. 2B. The single resonance from the control brain was chosen as 0 ppm. As seen in Fig. 2A, the AD brain spectrum has a broad peak at +0.25 ppm (peak width ~0.5 ppm) which overlaps with a narrow resonance at 0 ppm. The comparison between two control brains (Fig.2B) showed the second control brain to have no LSZ absorption. Although the resonance of the LSZ dissolved in ethyl acetate appeared around -0.35 ppm, this single resonance observed on both the AD spectrum and control spectrum (Fig.2A) potentially comes from the remnants of LSZ in ethyl acetate – ethanol solution on vial walls. Nevertheless, the broad resonance at +0.25 ppm was observed only for the AD brain, which supports the hypothesis that LSZ can be used for AD MRI diagnostics through NFT detection. LSZ has several advantages over the previously studied fluorinated MRI biosensors for AD. Firstly, it binds to NFT which forms earlier than amyloid-beta plaques, and therefore allows early detection of AD compared to biosensors studied in previous studies6,7,8. Secondly, LSZ is a commercially available product and is approved for medical use. Finally, based on our results, we can hypothesize that the LSZ signal mostly comes from pathology sites contrary to biosensors studied in previous investigations6,7,8. Further studies will involve scanning larger quantities of healthy and control brains to show statistical differences between the LSZ absorption by healthy and AD brains.Conclusion
We demonstrate that the 19F signal from LSZ interacts with NFTs in a rat model of AD. These findings show the potential in using LSZ to distinguish between AD and healthy brains with a clinical 3T scanner.Acknowledgements
This study was in part funded by the Natural Science and Engineering Research Council (NSERC) of Canada Discovery grant. S.K.Y. was supported by an NSERC Undergraduate Student Research Award (USRA). F.T.H. was supported by the BrightFocus Foundation and the Canadian Institutes for Health Research. V.G. was supported by the Ontario Trillium Scholarship. We thank Lakehead University (LU) and the Thunder Bay Regional Health Research Institute (TBRHRI) for access to their facilities.References
1. Brion JP. Neurofibrillary tangles and Alzheimer's disease. Eur Neurol. 1998;40(3):130-140.
2. Okamura N, Suemoto T, Furomoto S, et al. Quinoline and Benzimidazole Derivatives: Candidate Probes for In Vivo Imaging of Tau Pathology in Alzheimer’s Disease. J. Neurosci. 2005;25(47):10857-10862.
3. Rojo LE, Alzate-Morales J, Saavedra IN, et al. Selective Interaction of Lansoprazole and Astemizole with Tau Polymers: Potential New Clinical Use in Diagnosis of Alzheimer’s Disease. J. Alzheimer's Dis. 2010;19(2):573-589.
4. Fawaz MV, Brooks AF, Rodnick Me, et al. High Affinity Radiopharmaceuticals Based Upon Lansoprazole for PET Imaging of Aggregated Tau in Alzheimer’s Disease and Progressive Supranuclear Palsy: Synthesis, Preclinical Evaluation, and Lead Selection. ACS Chem. Neurosci. 2014;5(8):718-730.
5. Catana C, Guimaraes AR, Rosen BR. PET and MRI: The Odd Couple or a Match Made in Heaven? J. Nucl. Med. 2013;54(5):815-824.
6. Yanagisawa D, Amatsubo T, Morikawa S, et al. In Vivo Detection of Amyloid β Deposition using 19F Magnetic Resonance Imaging with a 19F-Containing Curcumin Derivative in a Mouse Model of Alzheimer’s Disease. Neuroscience. 2011;184:120-127.
7. Higuchi M, Iwata N, Matsuba Y, et al. 19F and 1H MRI detection of amyloid b plaques in vivo. Nat. Neurosci. 2005;8(4):527-533.
8. Shepelytskyi Y, Campbell M, Hane F, et al. Proc. Intl. Soc. Mag. Reson. Med. 27 (2019), 4369.
Figures