2995
In vivo assessment of fluoxetine human brain concentrations using fluorine MR Spectroscopy at 3T1Hoglund Brain Imaging Center, University of Kansas Medical Center, Kansas City, KS, United States, 2Department of Radiology, University of Kansas Medical Center, Kansas City, KS, United States, 3Division of Clinical Pharmacology, Toxicology & Therapeutic Innovation, Department of Pediatrics, Children’s Mercy, Kansas City, MO, United States, 4Department of Neurology, University of Kansas Medical Center, Kansas City, KS, United States, 5School of Medicine, University of Missouri-Kansas City, Kansas City, MO, United States, 6Department of Molecular & Integrative Physiology, University of Kansas Medical Center, Kansas City, KS, United States
Synopsis
Fluoxetine is one of the most commonly used medications to treat mental disorders, however, 30-50% of patients fail to respond to the treatment. Thus, direct noninvasive measurements of Fluoxetine concentration in the brain may give insights into individual variations in their clinical responses. This study aimed to quantify fluoxetine concentrations in the human brain using 19F MRS at 3T. 19F MRS measurements were performed on 20 subjects with stable doses of fluoxetine over a month. The fluoxetine concentration was 30±28.2 μM and significantly correlated with their daily doses; r=0.78, p<0.0001, which promises the utility of 19F MRS for personalized medicine.
INTRODUCTION
Antidepressants, such as fluoxetine, have been widely used to treat mental disorders. The effective fluoxetine dose varies among individuals, and 30‒50% of the patients fails to respond to the medication. 1,2 The individual variety of clinical responses has been associated with plasma or serum level of fluoxetine, but their associations are unclear. 3-6 Alternatively, an in vivo assessment of fluoxetine concentration in the action site: brain may give insights into the variety of clinical responses. Fluorine MR Spectroscopy (19F MRS) has been used to measure fluoxetine concentration in the brain. However, its broad applications are limited by the low signal-to-noise ratio (SNR) of the 19F signals. 7 Most previous measurements on fluoxetine were performed at 1.5T. 8-15 To our knowledge, only 6 subjects’ fluoxetine brain concentrations have been reported at 3T. 16,17 Therefore, this study aimed to quantify fluoxetine concentration in the human brain using 19F MRS at 3T.METHODS
19F MRS:This study included 20 subjects (19 males, age: 41 ± 11 years) who were taking fluoxetine for more than 1 month with daily doses:10‒120 mg. 19F MRS measurements were performed on a Skyra 3T scanner (Siemens, Erlangen, Germany) using a dual-tuned (1H and 19F) quadrature volume head coil. A 5 ml cylindrical vial of trifluoroethanol (TFE) was attached to the head coil and was used as an external reference to determine the transmitter frequency and to correct frequency drifts during the measurements. 18 The calibration of the transmitter power and shimming were performed using 1H measurements and their values were applied to 19F measurements. A non-localized RF pulse with 500 µs was used to excite the 19F signals. To maximize the SNR, the flip angle was adjusted to be the Ernst angle: 70◦ for a repetition time (TR) of 200 ms and the previously reported in vivo T1 relaxation time of fluoxetine at 1.5T (~200 ms). 10,12 Other sequence parameters were: bandwidth = 12000 Hz, number of data points = 2048, and number of averages = 10000. The scan time for 19F measurements was around 33 minutes.
Post processing:
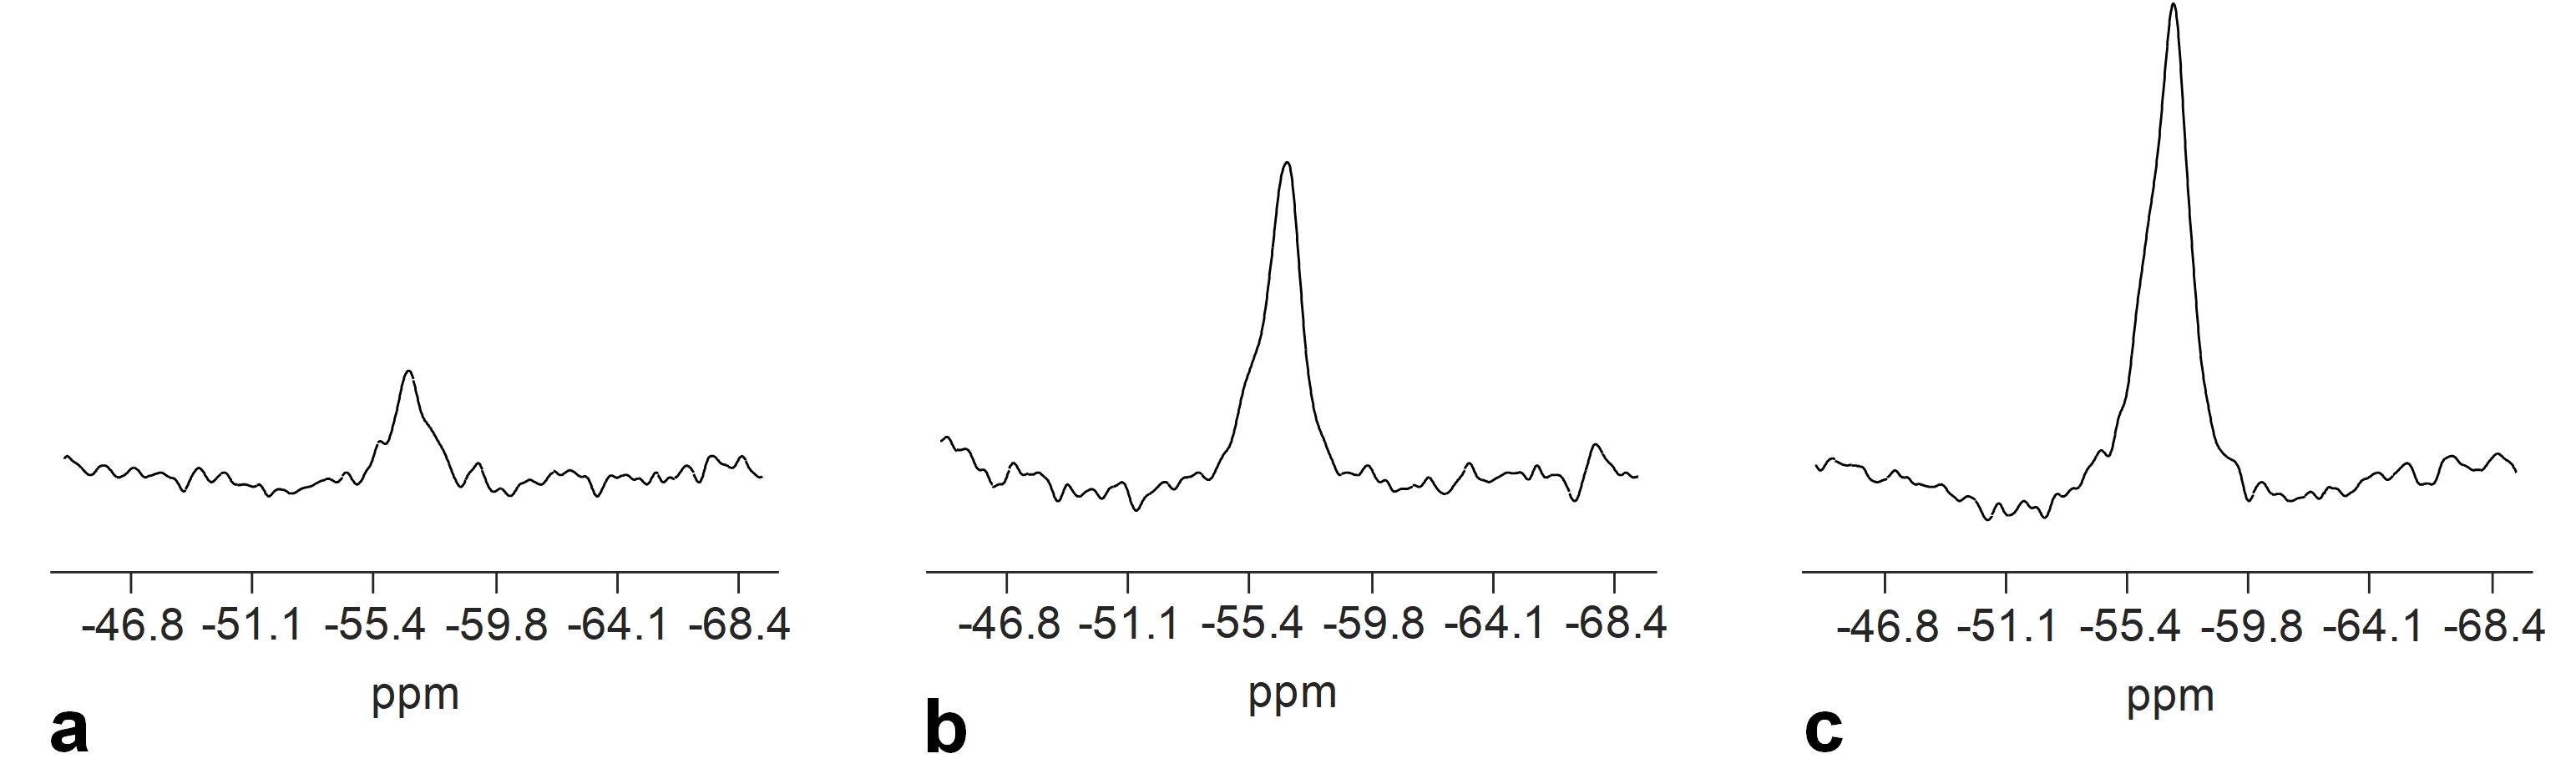
Each free induction decay (FID) signal were multiplied by a linear phase term to correct frequency drifts 18 prior to being summed up across all the averages. The FID signal were zero-padded to 8192 points, apodized with a Gaussian filter with 80 Hz line-broadening, and Fourier transformed to produce the spectrum (Fig. 1).
Quantification:
A 1 L phantom with a similar size and shape as human head was used as an external concentration reference. The phantom contained 76 µm fluoxetine and 0.68 M NaCl to produce a similar electrical loading as human head. The fluoxetine brain concentration (Cbrain) was calculated through the equation 10, 12, 16, 19:
Cbrain = Cref x (Vref/Vbrain) x (Abrain/Aref) x (Lbrain/Lref) x CorrT1 [1]
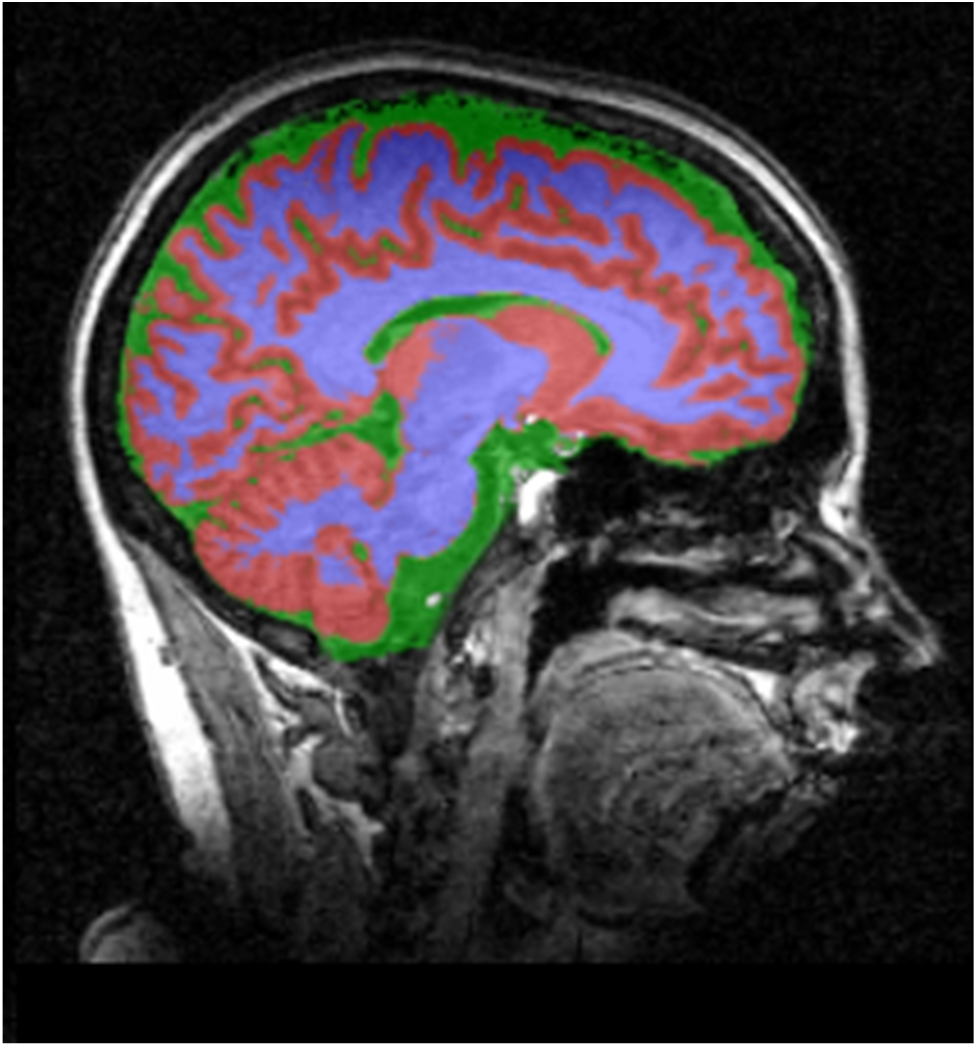
where Cbrain contained both fluoxetine and its major metabolite: norfluoxetine due to their similar chemical shifts. 9 Cref is the fluoxetine concentration of the phantom. Vref and Vbrain are the volumes of the phantom and brain, respectively. Aref and Abrain are the integrals of 19F signals in the phantom and brain, respectively. Lref and Lrain are the loading factors for the phantom and brain, respectively. CorrT1 is the factor to correct the T1 saturation effect on the 19F signals. The effect of T2* relaxation was assumed to be negligible. 16,19 The Vbrain was measured through the segmentation of T1-weighted images using SPM (http://www.fil.ion.ucl.ac.uk/spm/) (Fig. 2).
Statistics:
The correlation between fluoxetine brain concentration and the daily dose was evaluated using Spearman’s rank correlation coefficient with a significance level at p < 0.05.
RESULTS
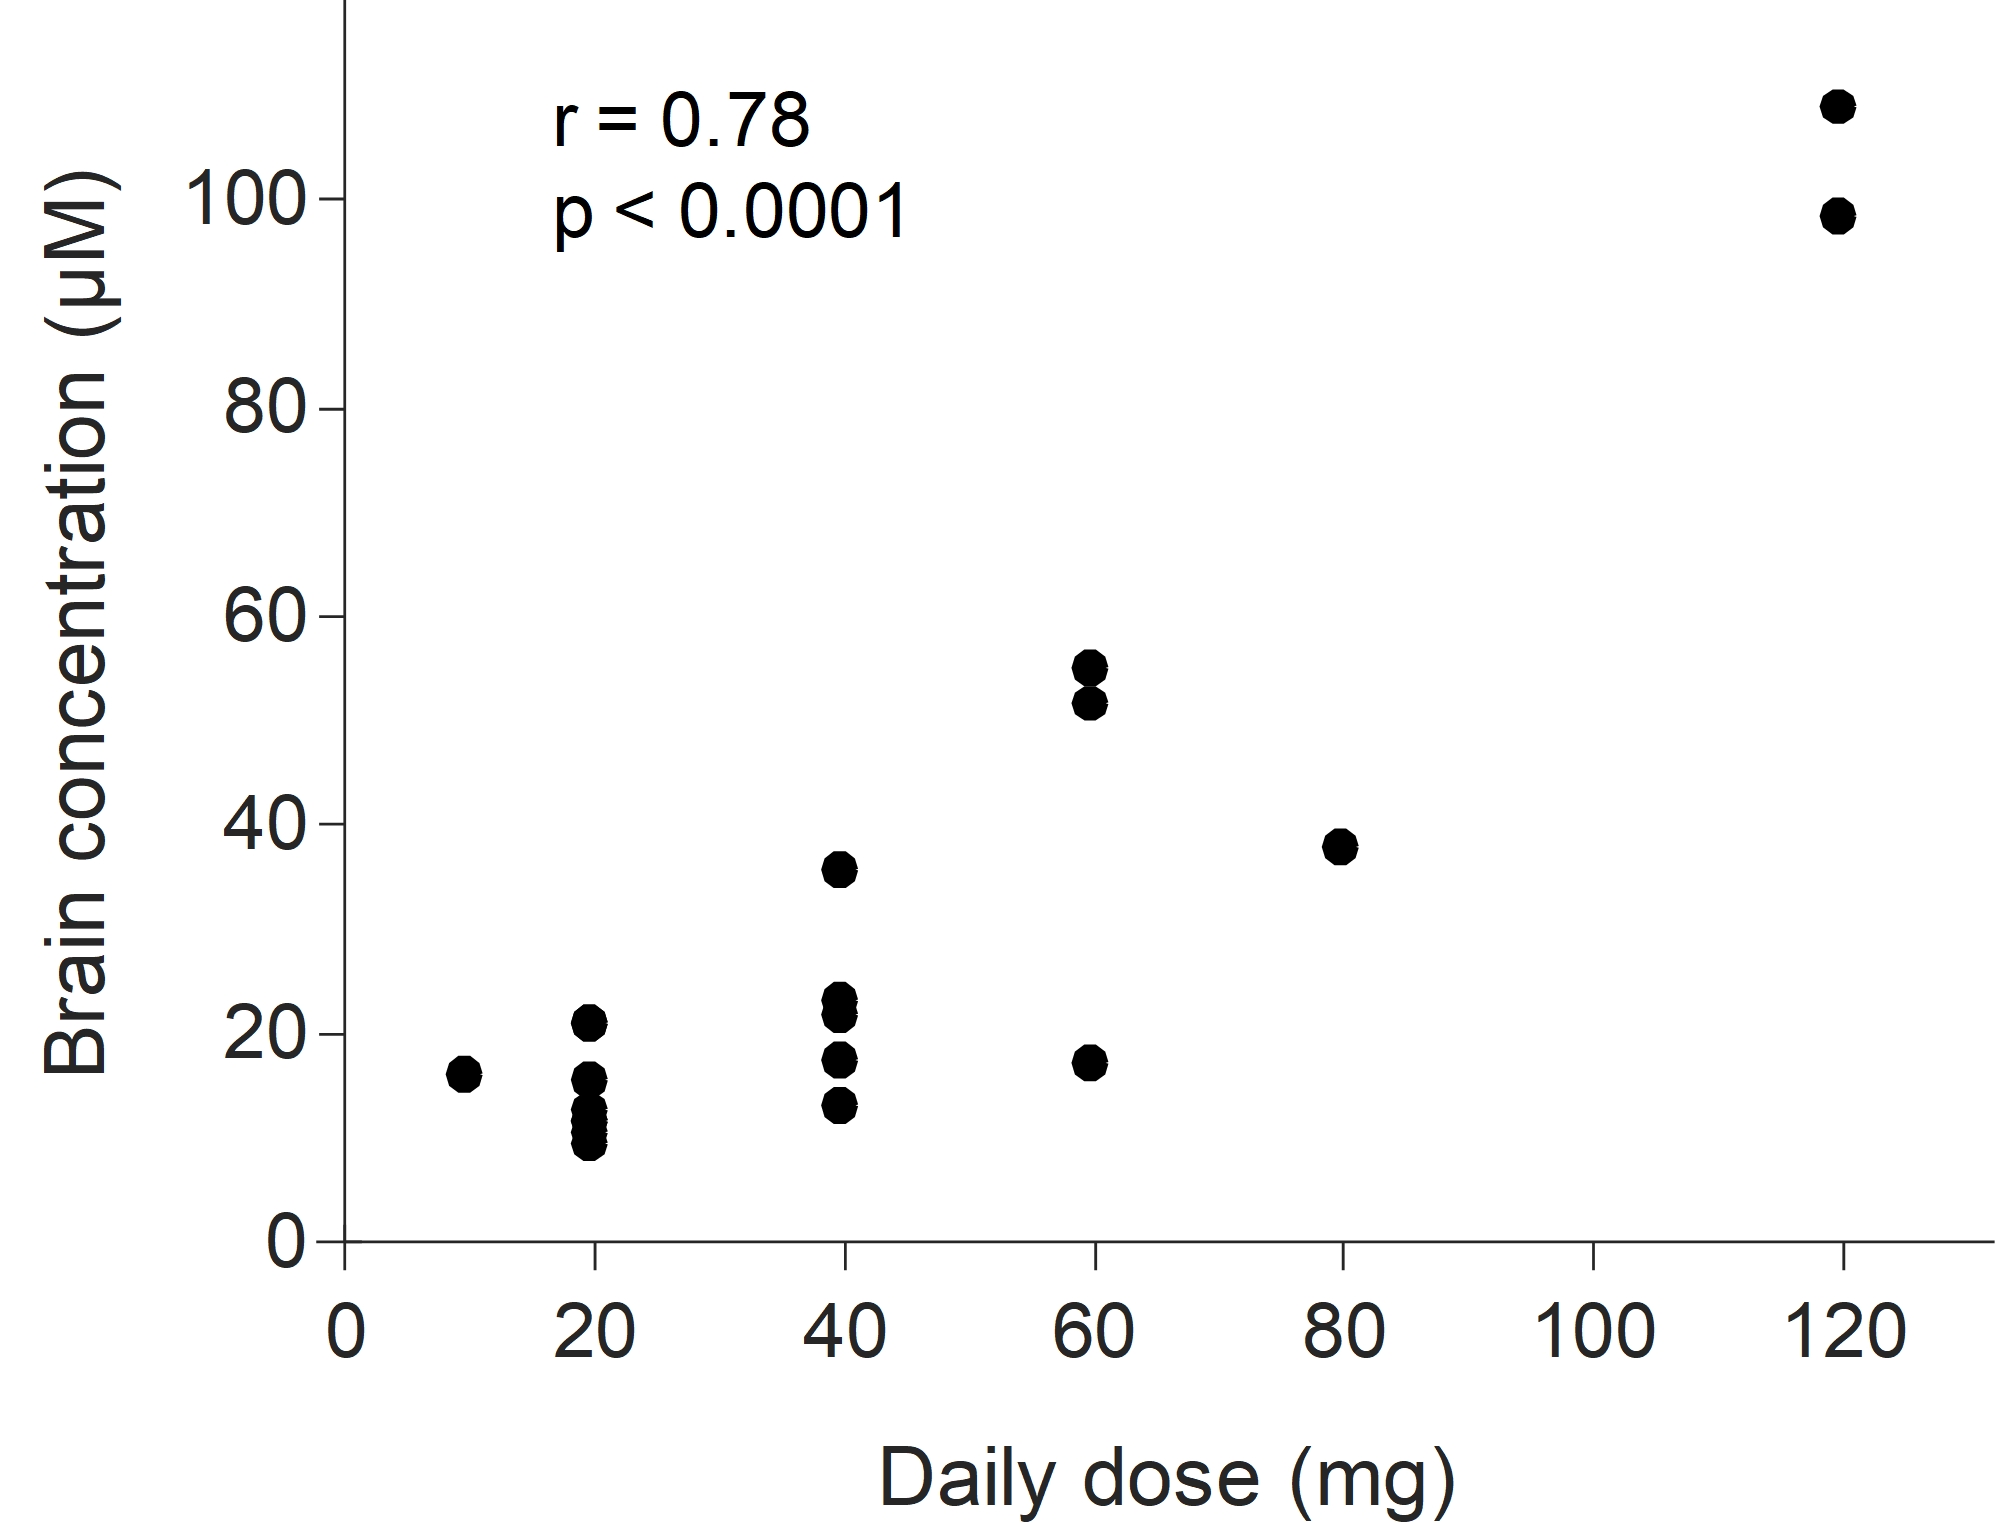
The measured brain volume for this cohort of the subjects was 1135 ± 94 ml, excluding the volume of cerebrospinal fluid. By applying those values to Eq. [1], the Cbrain of all the subjects was 30 ± 28.2 µM (N = 20) and ranged from 9.1 µM to 108.3 µM (Fig. 3). The value of Cbrain was significantly correlated with the daily dose; r = 0.78, p < 0.0001 (Fig. 3).DISCUSSION
For the typical daily doses of fluoxetine: 20‒40 mg, our reported fluoxetine brain concentration was 16.8 ± 7.8 µM (N = 13) and agrees with the previously reported brain concentrations at 1.5T: 12.6 ± 7 µM (N = 11) 10 and 3T: 15.3 ± 7 µM (N = 3). 16 Similar to other studies, 8,10 our study observed a significant correlation between fluoxetine brain concentration and the daily dose. However, for the identical dose, the fluoxetine brain concentrations showed a large degree of variation among individuals (Fig. 3). These results suggest that fluoxetine brain concentration depends on not only fluoxetine dosage, but also the variability in fluoxetine metabolism. Fluoxetine metabolism has been associated with CYP2D6, CYP2C9, and CYP2C19 polymorphisms. 20 Future work is to investigate the dose-response relationship by incorporating the information from individual genotypes, fluoxetine brain and plasma concentrations.CONCLUSION
This study reported fluoxetine brain concentrations in a cohort of 20 subjects at 3T, demonstrating the potential increased sensitivity of 19F MRS to quantify drug concentrations in the brain using high-field systems.Acknowledgements
This work is partly supported by the National Institutes of Health (S10RR29577, UL1TR000001, P20GM103418, 5T32HD06903809) and the Hoglund Family Foundation.References
[1]. Flament et al., Int Clin Psychopharmacol. 1999 Sep;14(5):259-75.
[2]. Berney et al., Dialogues Clin Neurosci. 2005;7(3):249-62.
[3]. Amsterdam et al., Am J Psychiatry. 1997 Jul;154(7):963-9.
[4]. Blázquez et al., J Clin Psychopharmacol. 2014 Jun;34(3):318-26.
[5]. Beasley et al., Psychopharmacol Bull. 1990;26(1):18-24.
[6]. Norman et al., Int Clin Psychopharmacol. 1993 Spring;8(1):25-9.
[7]. Komoroski, AJNR Am J Neuroradiol. 1993 Sep-Oct;14(5):1038-42.
[8]. Renshaw et al., Am J Psychiatry (149), 1592-4, 1992.
[9]. Karson et al., Psychiatry Res. (45), 95-104, 1992.
[10]. Karson et al., J Neuropsychiatry Clin Neurosci. 1993 Summer;5(3):322-9.
[11]. Komoroski et al., Biol Psychiatry. 1991 Apr 1;29(7):711-4.
[12]. Komoroski et al., MRM (31), 204-11, 1994.
[13]. Strauss et al., Biol Psychiatry. 2001 May 1;49(9):798-802.
[14]. Henry et al., Am J Psychiatry (157), 1506-8, 2000.
[15]. Henry et al., Neuropsychopharmacology (30), 1076-83, 2005.
[16]. Bolo et al., Neuropsychopharmacology (23), 428-38, 2000.
[17]. Bolo et al., MAGMA. 2004 May;16(6):268-76.
[18]. Lee et al., ISMRM 2018; 3884.
[19]. Strauss et al., Am J Psychiatry (154), 516-22, 1997.
[20]. Hicks et al., Clin Pharmacol Ther. 2015 Aug; 98(2): 127–134.
Figures