2994
Life monitoring of cellular metabolism and mitochondrial respiration in 3D cell culture system using NMR Spectroscopy
Damian Hertig1,2,3, Sally Maddah1,2, Roman Memedovski1,2, Andrea Debora Felser2, Aitor Moreno4, Matteo Pennestri4, Jean-Marc Nuoffer2,5, and Peter Vermathen1
1Departments of Clinical Research and Radiology, University of Bern, Bern, Switzerland, 2Institute of Clinical Chemistry, University Hospital Bern, Bern, Switzerland, 3Graduate School for Cellular and Biomedical Sciences, University of Bern, Bern, Switzerland, 4Bruker Biospin AG, Fällanden, Switzerland, 5Department of Pediatric Endocrinology, University Hospital Bern, Bern, Switzerland
1Departments of Clinical Research and Radiology, University of Bern, Bern, Switzerland, 2Institute of Clinical Chemistry, University Hospital Bern, Bern, Switzerland, 3Graduate School for Cellular and Biomedical Sciences, University of Bern, Bern, Switzerland, 4Bruker Biospin AG, Fällanden, Switzerland, 5Department of Pediatric Endocrinology, University Hospital Bern, Bern, Switzerland
Synopsis
In this study we show the feasibility of simultaneous
measure of oxygen consumption and metabolic data in living 3D cell culture in
standard 5mm NMR tube. Using high cell density of 20 million fibroblasts we
demonstrate high viability and reproducibility of the measurements over 12
hours. We describe the effect of the flow rate on the metabolic activity.
Importantly, we show the required sensitivity to detect substrate degradation
rates of major mitochondrial fuel pathways and ability to measure rapid O2 and
lactate changes as surrogate marker of oxidative phosphorylation and anaerobic
glycolysis.
Background
Mitochondria are the cell’s powerhouse and important signaling organelles. Dysfunctions either originate from primary genetic defects or are induced by signaling pathways, toxins or drugs. Thus, different mitopathogenic mechanisms have been described across all medical disciplines, highlighting the interdependence of bioenergetic function with a multitude of metabolic and signaling pathways. To our knowledge, there is no method enabling simultaneous analysis of both, mitochondrial function and metabolomic changes in living cells. Recently Bruker released a flow tube (InsightCell™), which allows for investigations of living cells with no need for special equipment using a standard 5mm NMR tube. Previously we have demonstrated the feasibility of real-time metabolic monitoring in 3D culture in a bioreactor1. Additionally it is well known that the oxygen tension can be determined via T1 relaxation time measurements of 19F compounds2,3.In this study we evaluate the effect of different perfusion rate on metabolic profiles. We aim at simultaneous detection of substrate conversion using 1H NMR and mitochondrial respiration using 19F NMR relaxation time measurements of perfluorocarbons in a human fibroblast 3D cell culture system. A standard glycolytic stress test is finally used to test the feasibility to simultaneously cellular metabolism and mitochondrial respiration.
Methods
NMR experiments were performed on a 500MHz Bruker Avance II spectrometer. HPLC pumping system (Agilent) was used for constant perfusion (0.025 – 0.3ml/min) of substrate via the perfusion apparatus InsightCell™. For experiments with chemical inhibitors, serum free culture medium was used. In order to maintain the pH and supply of sufficient oxygen, a gas mix of 45% O2, 50% N2 and 5% CO2 was applied to the bioreactor using a self-constructed gas blending system regulated by DigiFlow™ digital flowmeters (Draeger Medical). Online metabolic profiling by 1H NMR was performed using 1D project spectra of 32 transients (≈4min) per spectrum (TE=80ms), allowing kinetic tracking of 30 intra- and extracellular metabolites under standard cell culture condition (Figure 1)4. 19F T1-relaxation time measurements of perfluorotributylamine (PFTBA) were performed for oxygen quantification. Measurements were performed using a pseudo 2D inversion recovery 180°-τ-90° pulse sequence (t1pir) using 8 incremented delay times (0.005 s, 0.646 s, 1.317 s, 2.030 s, 2.804 s, 3.676 s, 4.732 s, 6.277 s) with 4 scans per time increment (total of 5min). Cell viability was controlled by trypan blue staining and cellular LDH release.Results & Discussion
We implemented a perfused bioreactor system within the NMR spectrometer shown in figure 2 (shown before at ISMRM 2019), evaluated embedding methods for high cell density in collagen based matrix (20 million cells), viability (>90%), stability (up to 12h) and reproducibility of metabolic and oxymetric responses.Online metabolic profiling: The level of glycolytic metabolites, glutamine as well as the level of free fatty acids were monitored during 6 hours of perfusion of 20 million fibroblasts. Six times repeated seven-minute interruption of the perfusion rate resulted in reproducible findings with significant decrease of glucose and pyruvate level and simultaneous increase of lactate levels (Figure 3B). In contrast, glutamine and free fatty acid levels did not show obvious fast periodic adaptations to short term flow changes. However also glutamine and free fatty acid levels were perfusion rate depending as shown in figure 3C. While glycolytic metabolites show immediate changes, glutamine and fatty acid compounds showed significant changes after changing the flow rate for ~90 minutes (Figure 3C).
Oxygen detection using 19F of non-emulsified PFTBA: Emulsifiers for PFTBA have been used in other bioreactor setups for convenient incorporation into the system for T1 time determination5. We avoid the use of emulgators due to interference signals in the proton spectrum and possible physiological effects on embedded cells. However, initial tests demonstrated strong T1 adaption delays of PFTBA upon O2 changes, which appeared to depend on the size of the organic PFTBA phase. Therefore, to achieve high contact area between both liquid phases without chemical emulsifiers, we dipped a 0.27mm cotton thread for 1 hour into PFTBA to cover its surface with PFTBA. Embedding this PFTBA coated thread into the 3D cell culture scaffold proved to be a sensitive oxygen sensor responding to changes in T1 within minutes (Figure 4).
Glycolytic stress test: In order to probe the bioreactor system sensitivity upon challenges, a glycolytic stress test was performed (Figure 5). Addition of the respiratory chain inhibitors oligomycine & rotenone lead to an increase of the determined oxygen level up to the oxygen amount of inserted medium. Simultaneous upregulation of the lactate production indicates glycolytic capacity. Subsequent addition of 2-deoxy-glucose inhibited lactate production completely. Detection of glycolytic rate and maximum glycolytic capacity provides important information on cell status and phenotype. It allows quantitative analysis of energy production of glycolysis and oxidative phosphorylation.
Conclusion
In this study we show the feasibility to simultaneously measure respirometric and metabolic data using standard 5mm NMR tube. We describe the effect of the flow rate on the metabolic activity. Importantly we show the required sensitivity to detect substrate degradation rates of major mitochondrial fuel pathways and ability to measure rapid O2 and lactate changes as surrogate marker of oxidative phosphorylation and anaerobic glycolysis.Acknowledgements
References
- Hertig D, Felser AD, Diserens G, Kurth S, Nuoffer JM, Vermathen P. Real-time Metabolic Investigations of Living Cells by NMR -First Experiences ISMRM 2019, Montreal, Canada
- Grucker D. Oxymetry by magnetic resonance: applications to animal biology and medicine. Progress in Nuclear Magnetic Resonance Spectroscopy 2000; 36 (3):241-270.
- Dunn JF. Measuring oxygenation in vivo with MRS/MRI--from gas exchange to the cell. Antioxid Redox Signal 2007; 9 (8):1157-1168.
- Aguilar JA, Nilsson M, Bodenhausen G, Morris GA. Spin echo NMR spectra without J modulation. Chemical Communications 2012; 48 (6):811-813.
- Taylor J, Deutsch C, 19F Nuclear magnetic resonance: measurements of O2 and pH in biological systems, Biophysical Journal 1988; 53(2): 227-223.
Figures
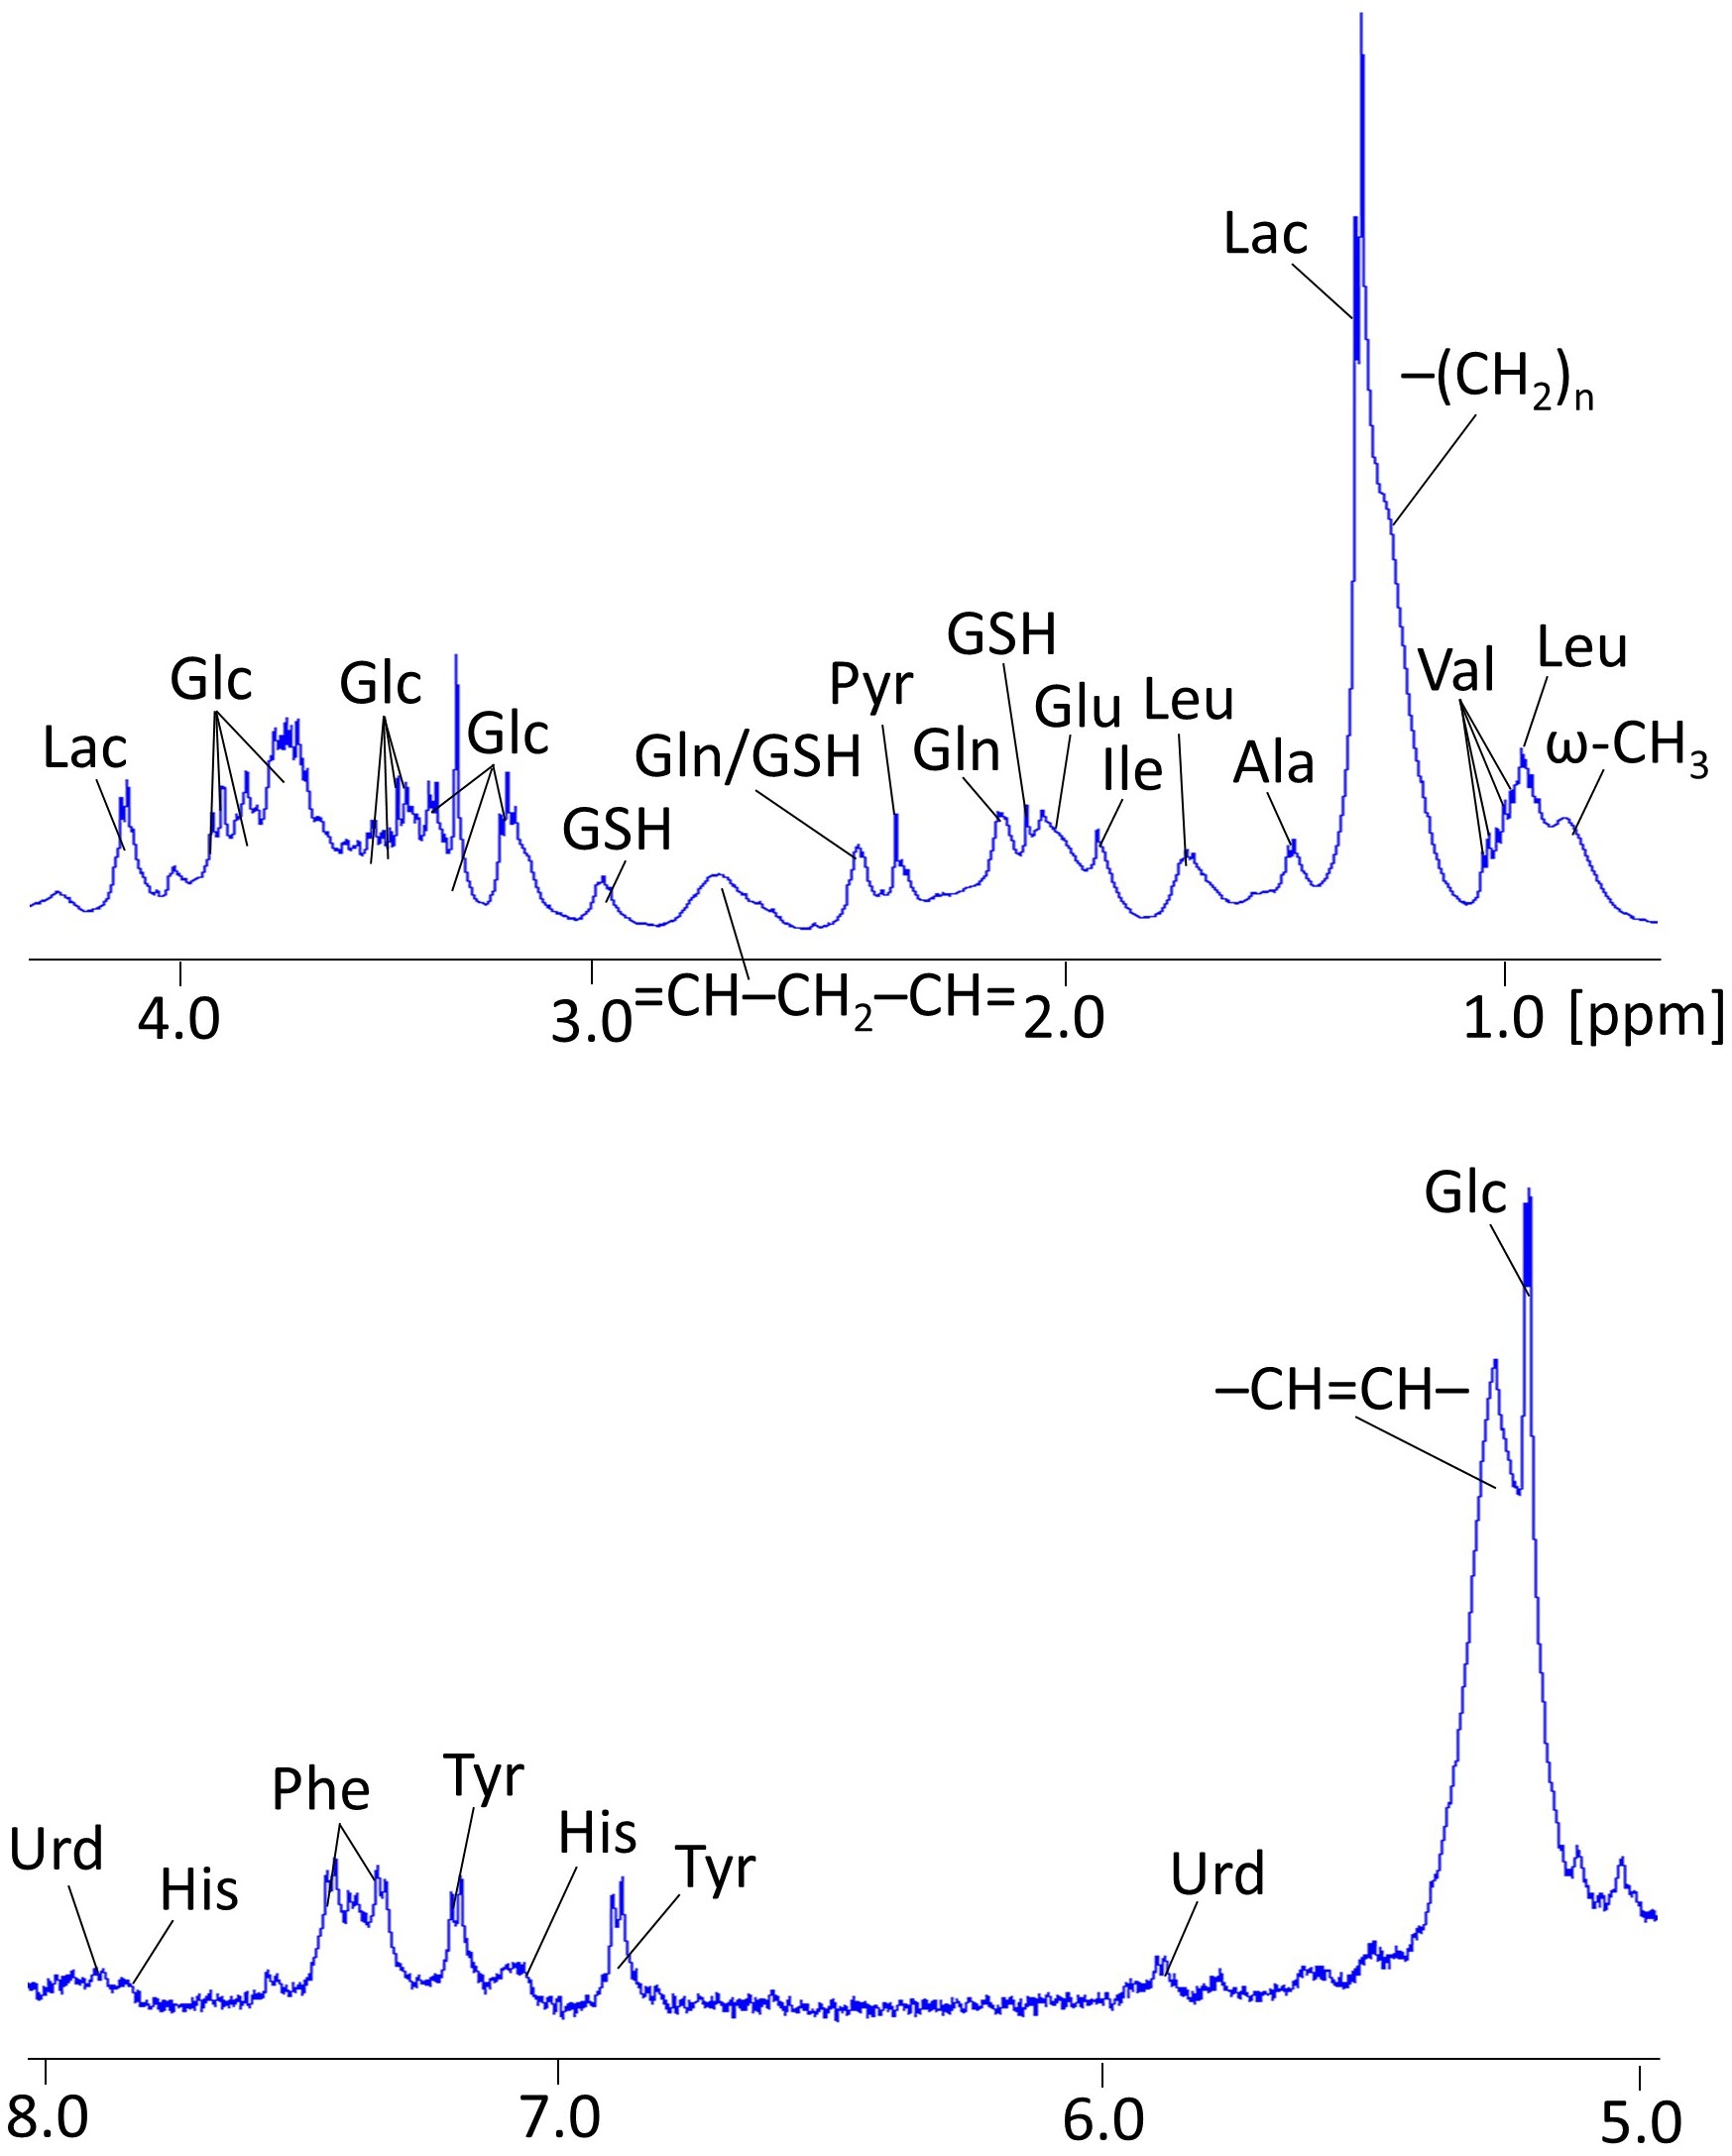
Figure 1: Assigned regions of a representative 500 MHz 1H
NMR spectrum of 20 million fibroblasts measured during perfusion of
insightCell™ at 0.2ml/min for 32 acquisitions (≈4min).
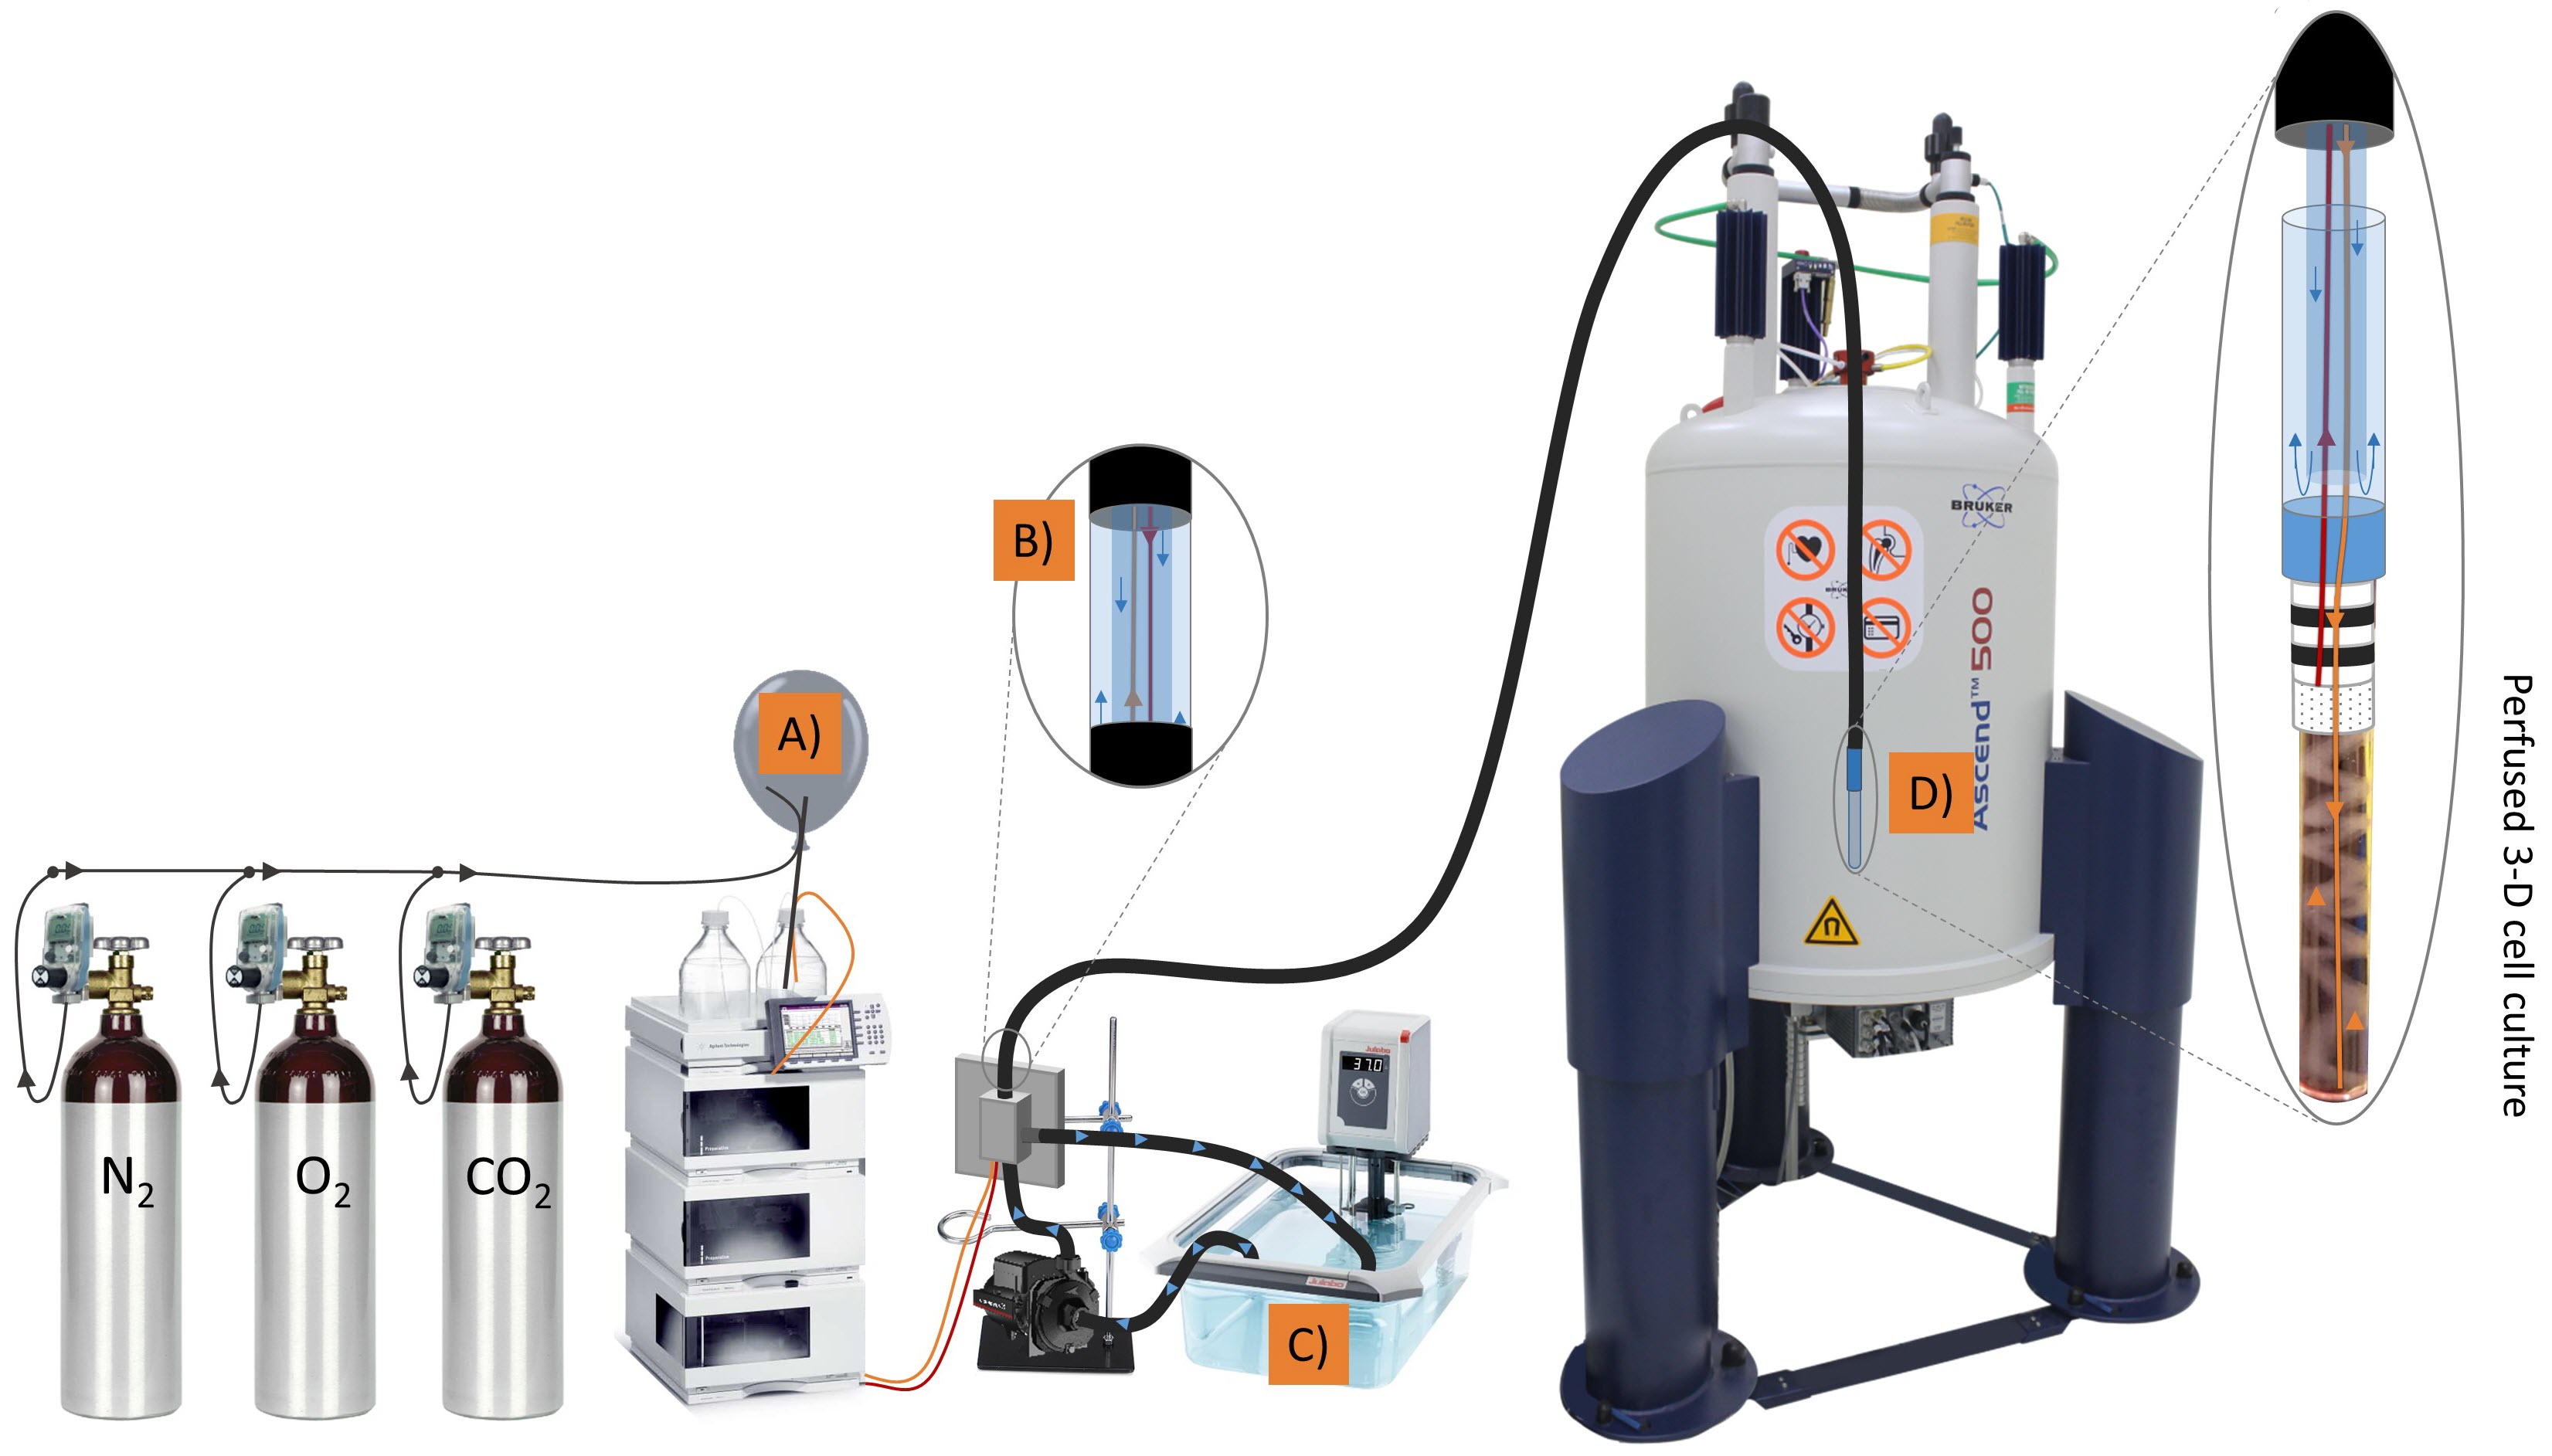
Figure 2: Setup of the bioreactor inside the NMR spectrometer.
A) In order to maintain the dissolved gas mixture in the substrate, a balloon with
corresponding atmosphere composition was connected to the closed system. B) HPLC
pumping system (Agilent) was connected to HPLC tubes of the insightCell™ tool.
C) Water at 37.5°C was pumped through the external water circuit using
subaqueous pump with a capacity of 1-5 L/min. D) The substrate is delivered via
an inlet at the bottom of the 5mm NMR glass tube.
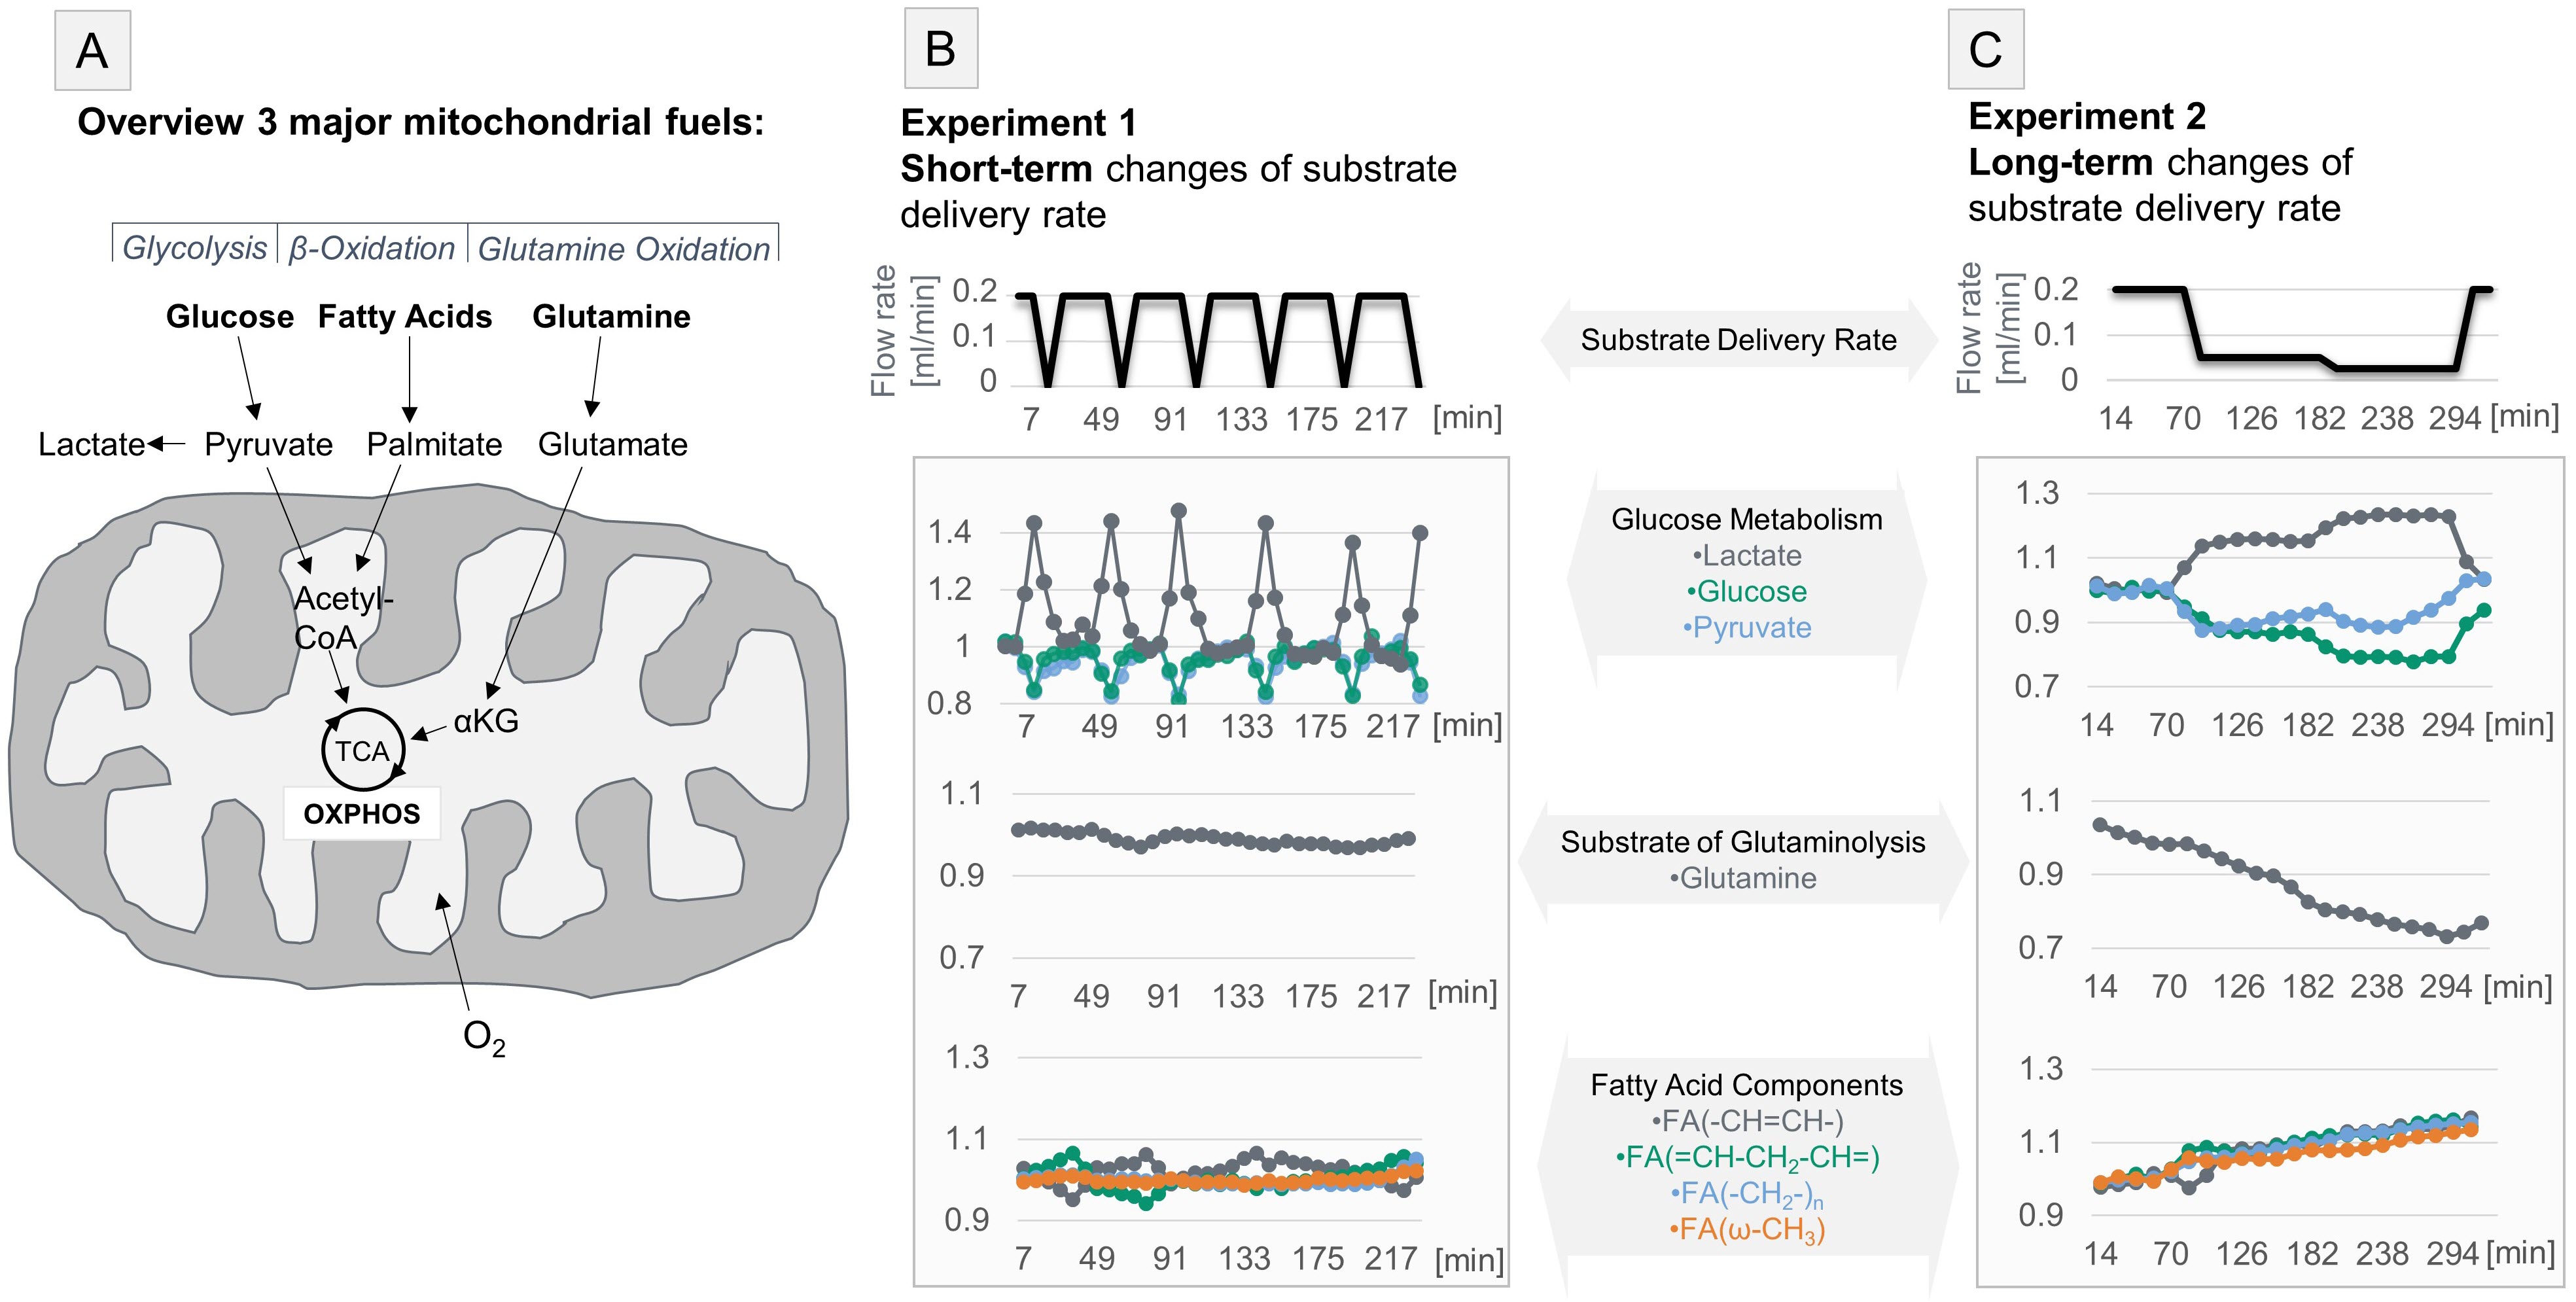
Figure 3: Schematic diagram of the three most relevant metabolic pathways to
maintain cell homeostasis are shown in A. During short-term, 7-minute (B), and
long-term 90-minute (C) periods, the perfusion rate was altered and
time-resolved metabolic levels were recorded. Y-Axis represents relative
metabolite content normalized to their initial values. Illustrated Experiments represent
results from n=2 replicas (each) performed using a cell density of 20 million
fibroblasts.
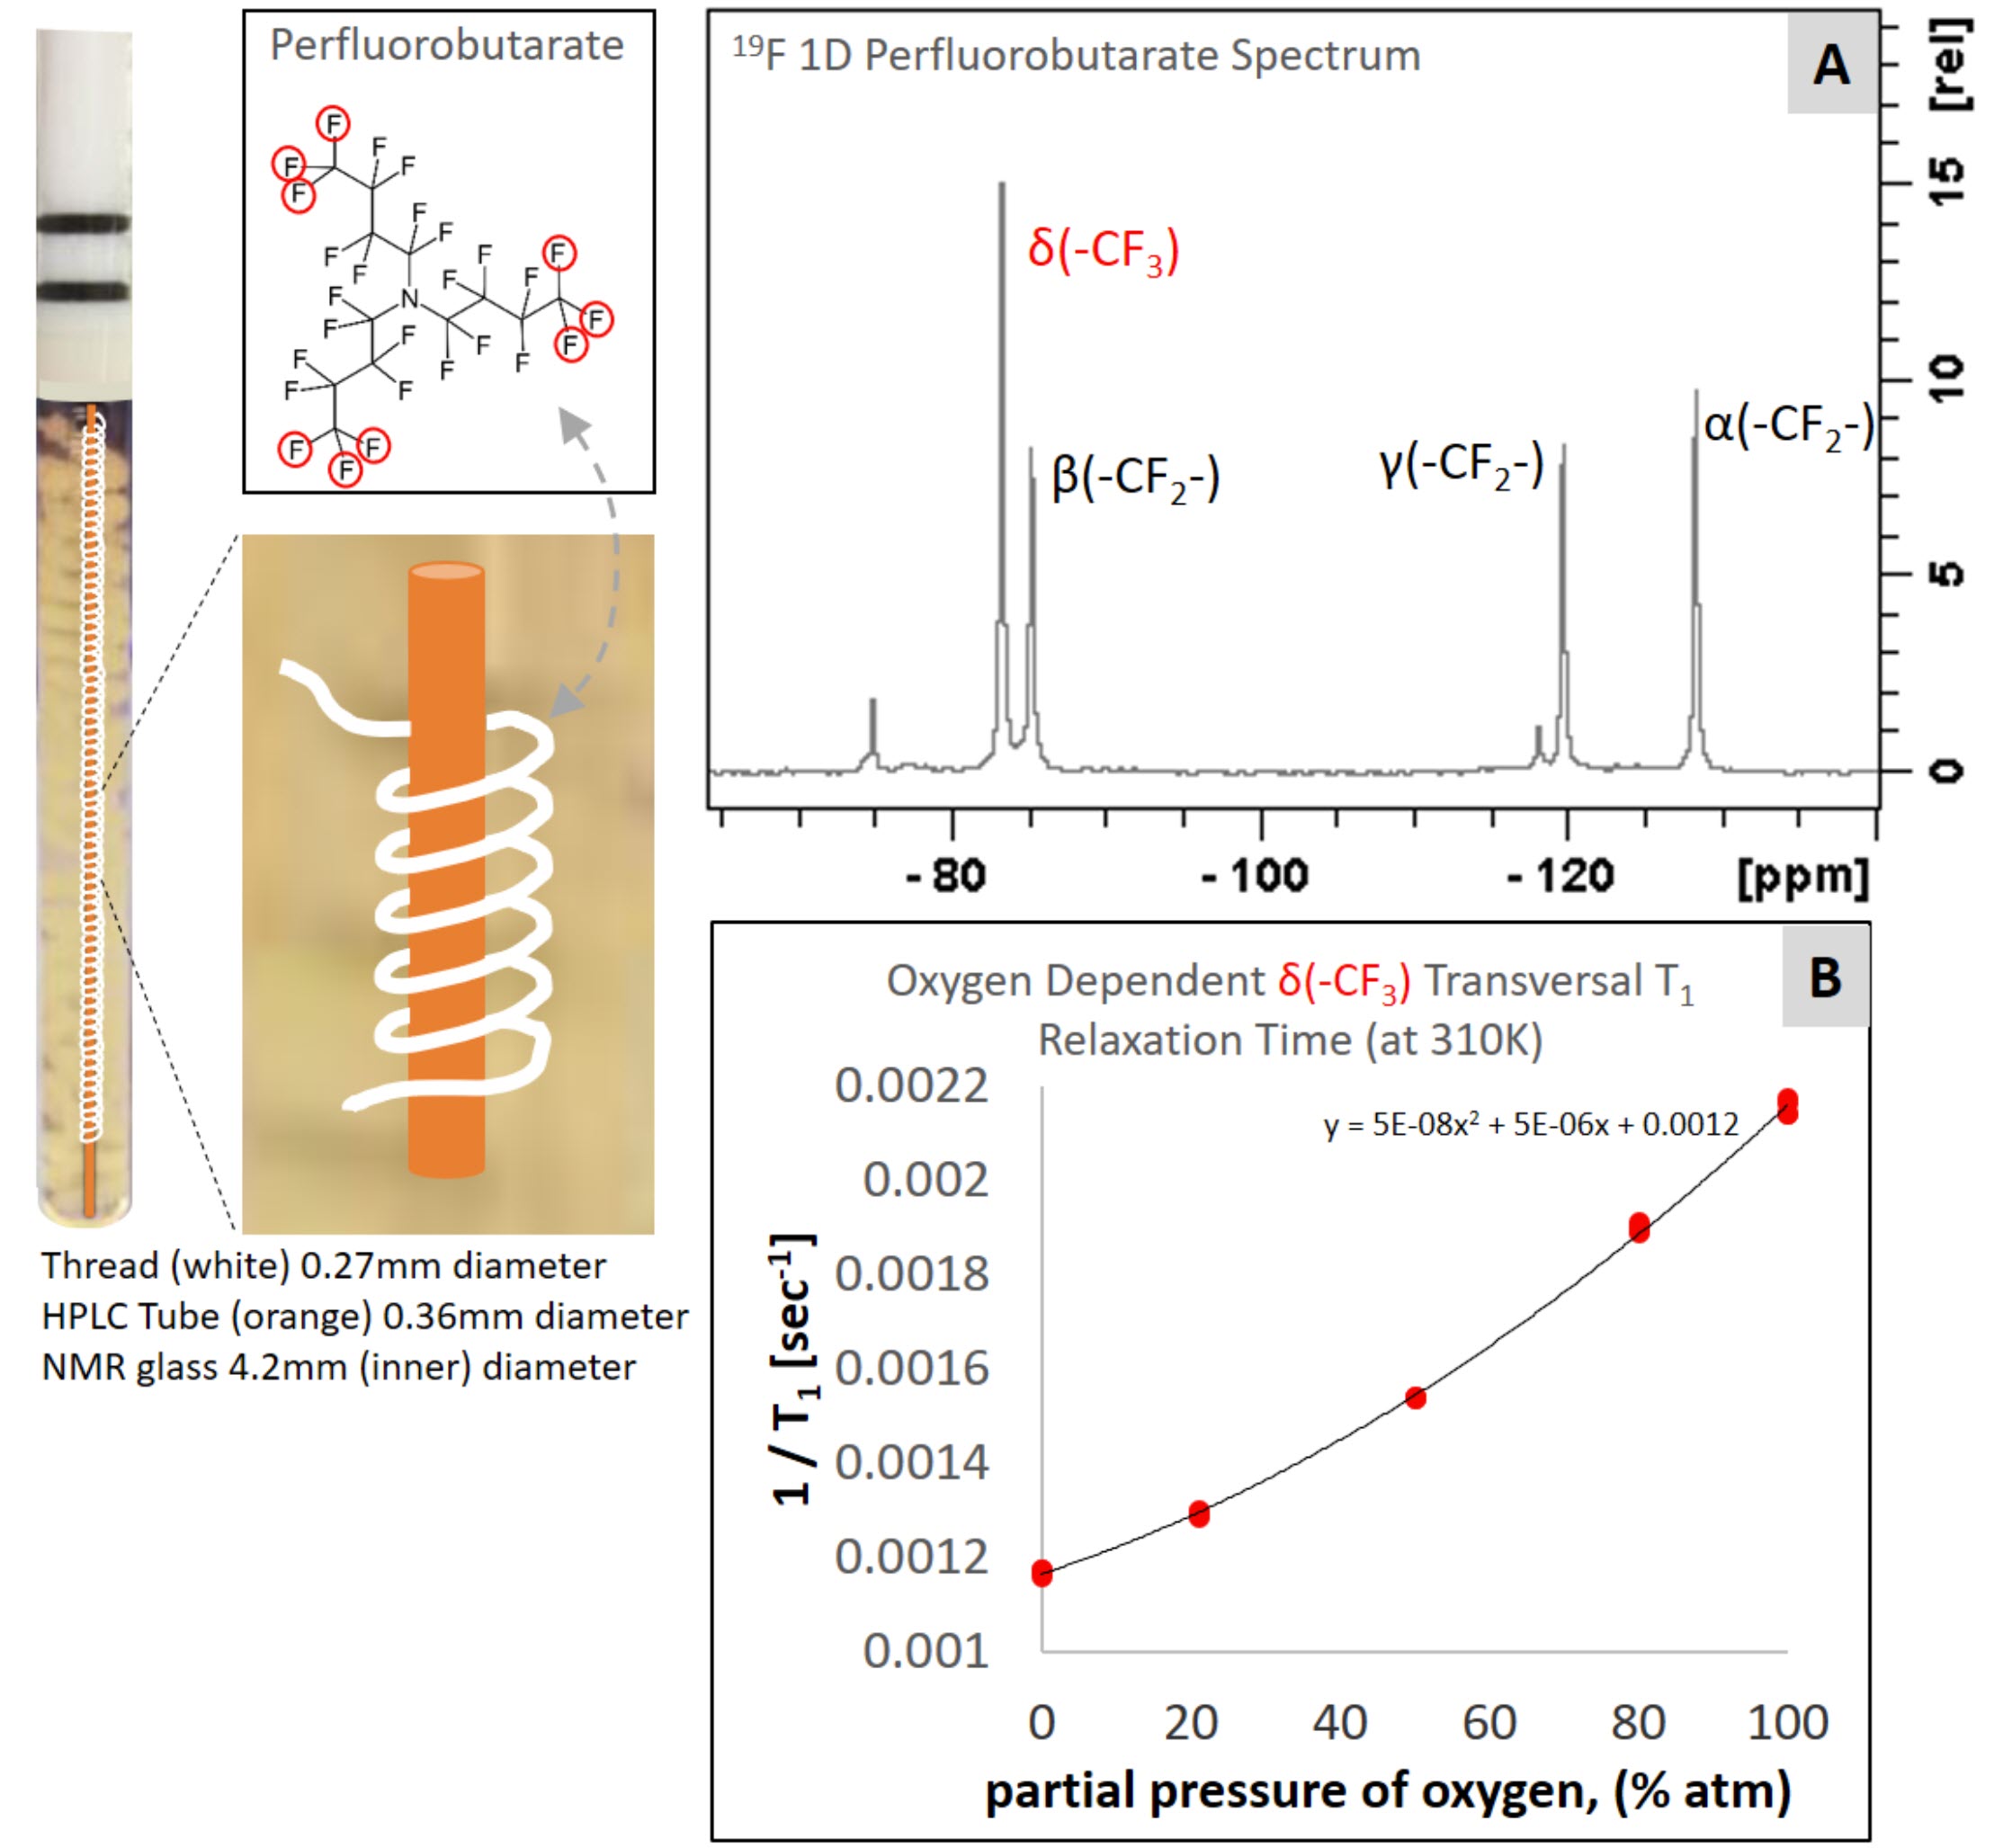
Figure 4: Assigned 19F-NMR spectrum of PFTBA
containing cotton thread is shown in A. Dependence of T1 relaxation
time and partial pressure of dissolved oxygen was calibrated at the operating
temperature of 37°C, shown in a standard curve (B).
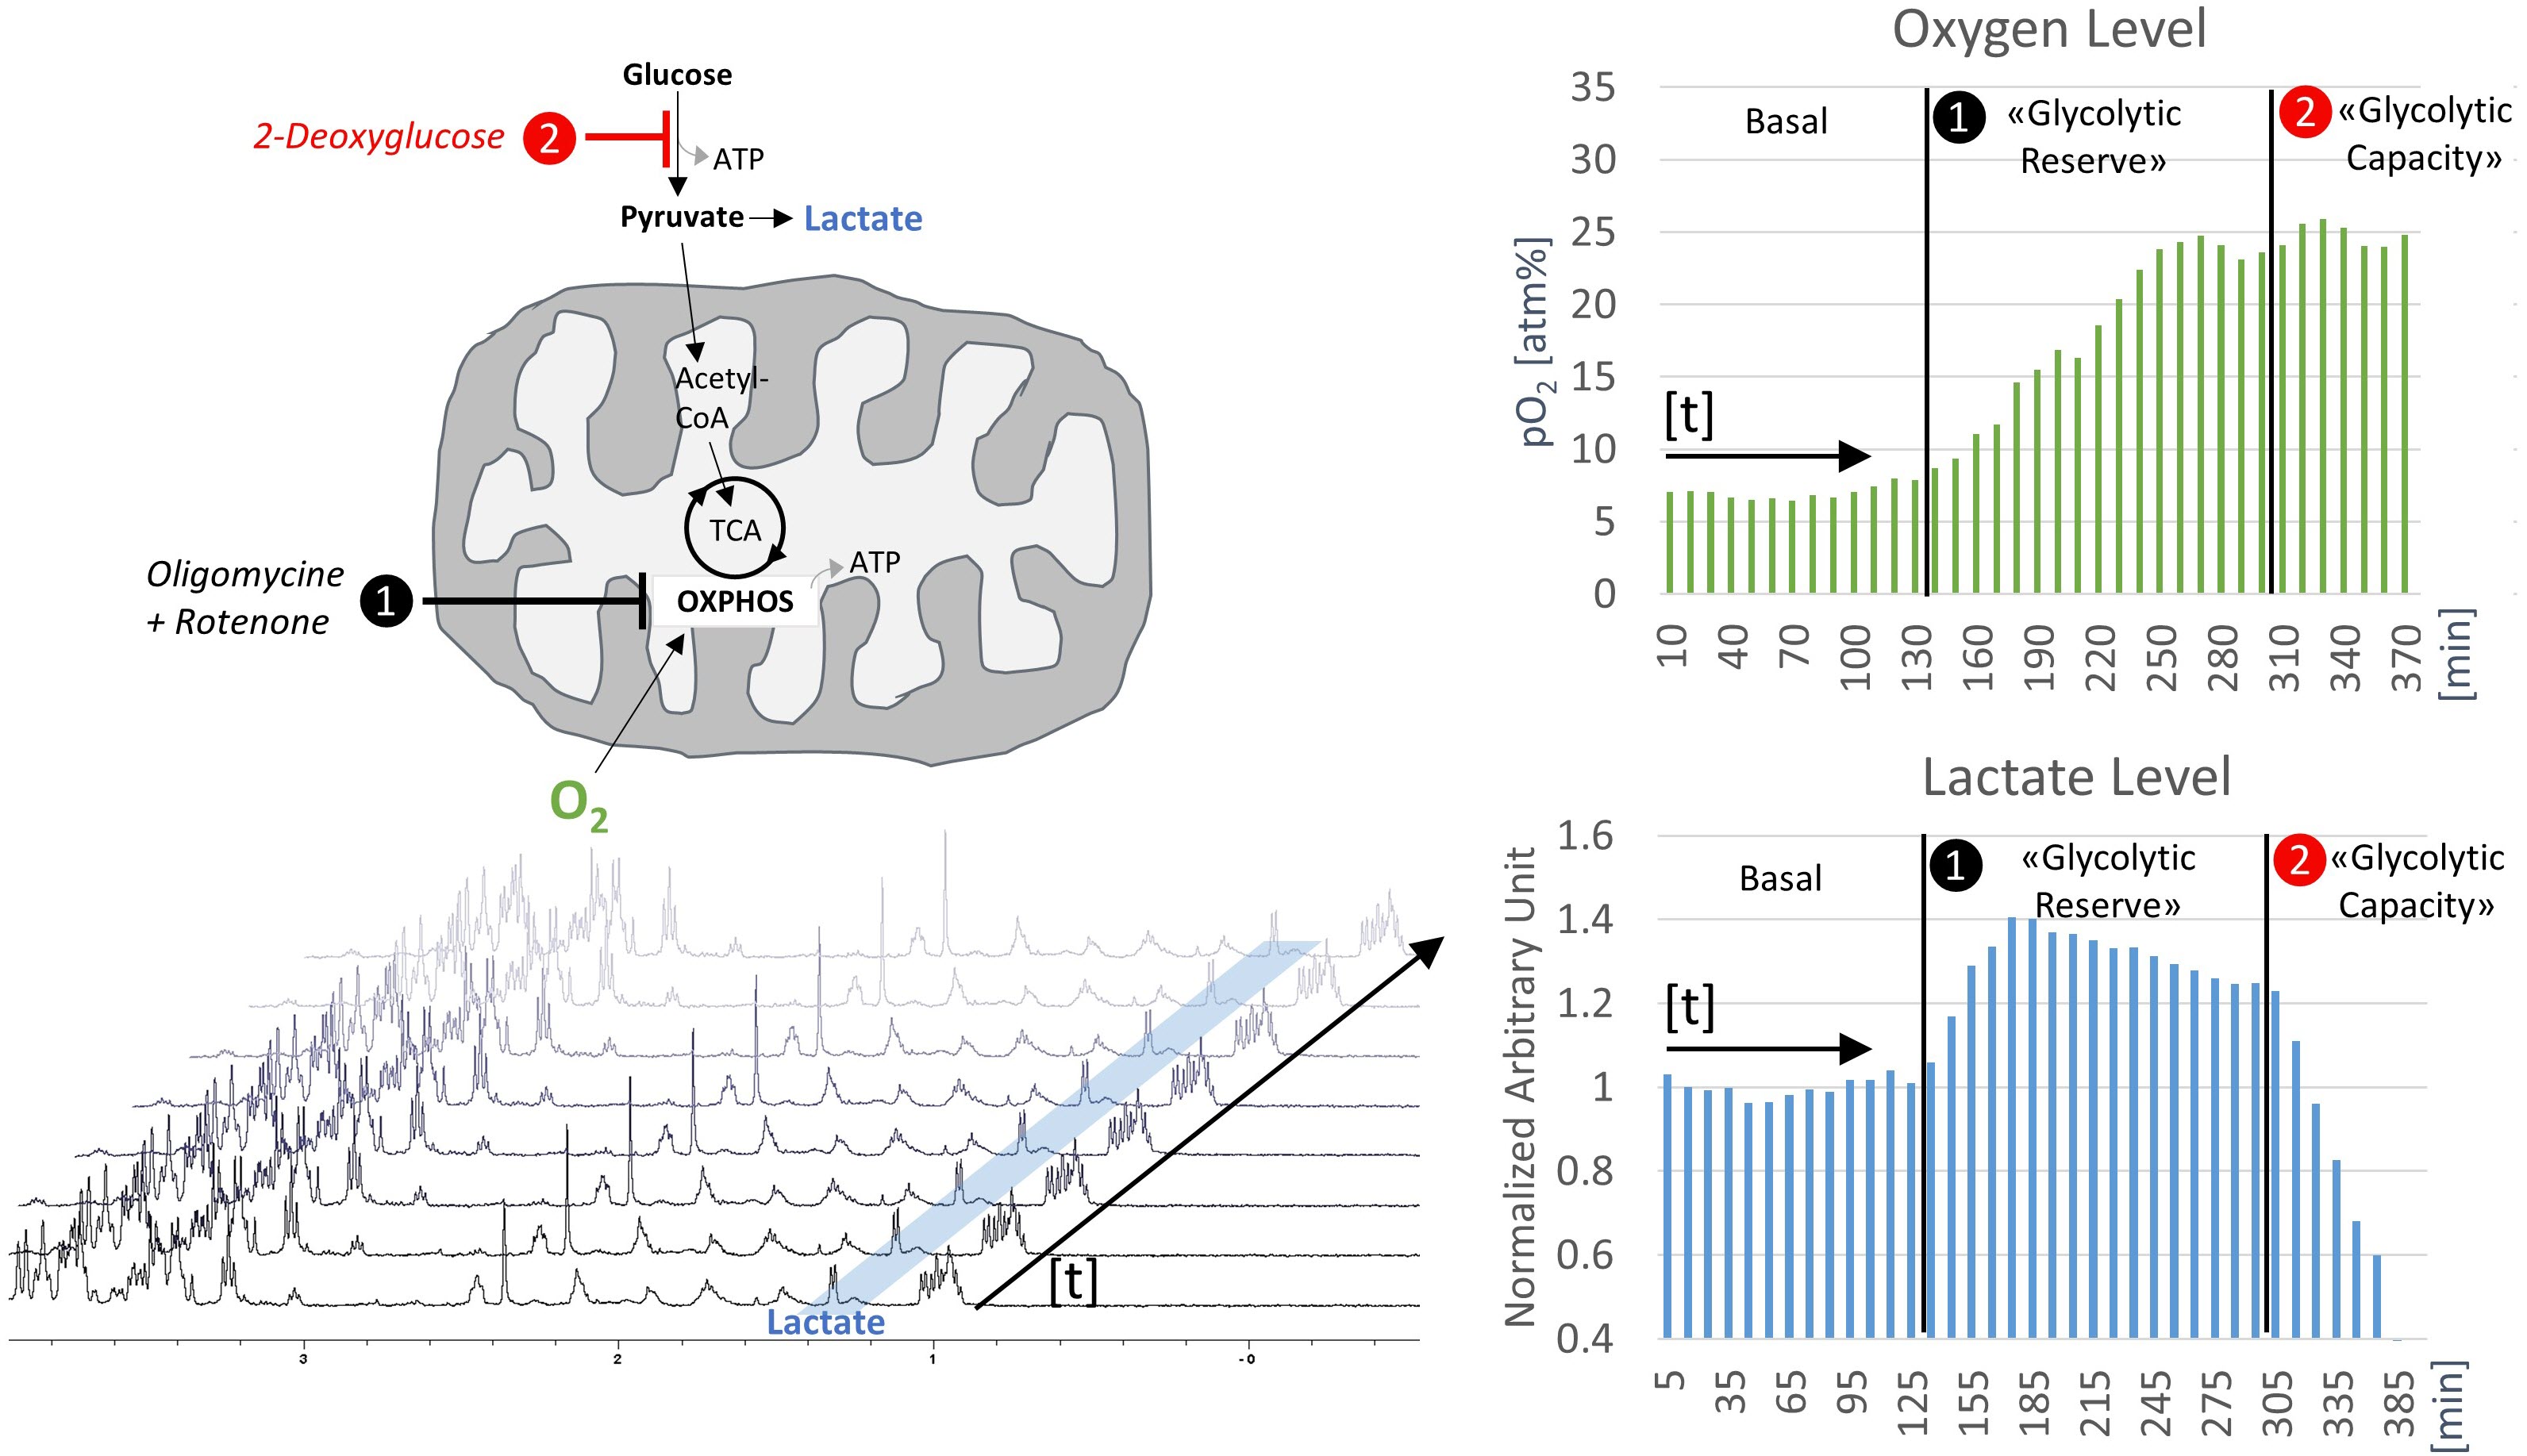
Figure 5: Glycolytic stress test was performed to probe
the bioreactor system sensitivity upon challenges. Basal oxygen consumption was
measured by 19F NMR of the δ(-CF3) resonance of PFTBA and anaerobic
glycolytic activity by 1H NMR. Addition of the respiratory chain
inhibitors led to increase of measured oxygen level to the oxygen amount of
inserted medium. Simultaneous upregulation of the lactate production indicated
glycolytic capacity. Subsequent addition of 2-deoxy-glucose inhibited lactate
production completely.