2993
tcaCALC: MATLAB Software for Quantitative Analysis of 13C Metabolic Isotopic Tracer Experiments
Jeffry R. Alger1,2,3, Gaurav Sharma1, A. Dean Sherry1,4, and Craig R. Malloy1,5
1Advanced Imaging Research Center, University of Texas, Southwestern Medical Center, Dallas, TX, United States, 2Neurology, University of California, Los Angeles, Los Angeles, CA, United States, 3NeuroSpectroScopics LLC, Sherman Oaks, CA, United States, 4Department of Chemistry, Universiy of Texas at Dallas, Richardson, TX, United States, 5Department of Internal Medicine, University of Texas-Southwestern Medical Center, Dallas, TX, United States
1Advanced Imaging Research Center, University of Texas, Southwestern Medical Center, Dallas, TX, United States, 2Neurology, University of California, Los Angeles, Los Angeles, CA, United States, 3NeuroSpectroScopics LLC, Sherman Oaks, CA, United States, 4Department of Chemistry, Universiy of Texas at Dallas, Richardson, TX, United States, 5Department of Internal Medicine, University of Texas-Southwestern Medical Center, Dallas, TX, United States
Synopsis
tcaCALC has been developed as a MATLAB tool that facilitates the quantitative analysis of metabolic tracing experiments that use 13C enriched tracers. The most recent version of tcaCALC facilitates analysis by incorporating spectral fitting of J-coupled 13C NMR multiplets and modeling complex metabolic situations in which specific metabolic fluxes may be active or inactive. The MATLAB source code and a compiled version are available for sharing to interested research teams.
Introduction
tcaCALC is a MATLAB software tool for quantitative analyses of studies that use 13C-enriched tracers to estimate flux through the tricarboxylic acid (TCA) cycle and interconnected pathways (Figure 1). Analysis by 13C-NMR spectroscopy is more informative than by radiotracing or mass spectrometry (MS). However there have been two limitations: 1) analysis of 13C-NMR multiplets (from 13C-13C J-coupling) requires experience and 2) how to select which of the Figure 1 metabolic models best represents the potential biological complexity has been unclear. tcaCALC has been revised to address both issues.tcaCALC can model experiments that use combinations of all commercially available 13C-enriched substrates. It uses non-linear-least-squares fitting to determine the relative steady state fluxes through Pyruvate dehydrogenase (PDH), Pyruvate Carboxylase (Ypc), Pyruvate Kinase (PK), and four-carbon anaplerosis (Ys). Each is expressed as a ratio with respect to the TCA cycle rate. It fits measured metabolic product 13C-enrichment, to the metabolic models shown in Figure 1. Model01 is a generalized model that potentially has nonzero values for each of the unknowns. The 12 additional candidate metabolic models (Model02 – Model16) are derived by turning off (setting to zero and not fitting) all combinations of PDH, Ypc, PK and Ys. Model06, Model10 and Model15 are not present in Figure 1 because these models violate the steady state assumption. To facilitate 13C-NMR analysis, tcaCALC can read spectra generated by Bruker and Agilent NMR systems. After point/click identification of key 13C signals in the spectrum, a nonlinear least squares spectral-model based approach is used to estimate the relative intensities of all user-requested metabolic product 13C-NMR multiplets.
Methods
tcaCALC was developed using MATLAB 2017b. The software represents measured and simulated 13C-NMR multiplet and/or MS data together with metabolic models as MATLAB structures that contain all relevant quantitative information, which parameters are to be fit and the conditions for fit convergence. tcaCALC uses a recently developed MATLAB version of tcaSIM (1) to simulate 13C-enrichment of all relevant TCA cycle intermediates and products. It then generates simulated 13C-NMR multiplet and/or MS intensities from the 13C-enrichments. Metabolic model fitting is performed by simultaneous non-linear-least-squares optimization of PDH, Ypc, Ys, PK and substrate enrichment (if necessary) driven by least squares agreement between simulated and measured 13C-NMR multiplet and/or MS intensities.Spectral fitting was validated against that performed with a commonly-used spectral fitting software package – ACD/NMR Processor v 12.01 (Advanced Chemistry Development Inc).
Metabolic fitting was validated by simulating (with tcaSIM) glutamate 13C-NMR multiplet intensities over a range of metabolic conditions and then fitting the simulated data with tcaCALC.
Results
Figure 2 provides an example of spectral fitting of the glutamate C3 doublet and pseudo-triplet with tcaCALC. Detailed illustrations of the spectral fitting module’s performance will be given at the formal presentation.Figure 3 illustrates the performance of tcaCALC's metabolic model fitting module. Glutamate 13C-NMR multiplets were used for this illustration because isotopic metabolic tracing experiments typically produce substantial amounts of this 13C-enriched product. For this illustration tcaSIM was used to simulate 8745 13C glutamate spectra (15 glutamate multiplets per spectrum) that would be produced in hypothetical experiments in which uniformly 13C-enriched lactate having an exactly known enrichment of 0.9 was provided as a substrate to metabolic systems operating over a range of metabolic conditions (0.0 < PDH < 1.0, 0.0 < Ypc, Ys, PK < 5.0). The resulting simulated glutamate 13C-NMR multiplets were then fitted to each of candidate metabolic models using tcaCALC’s metabolic fitting module to produce estimates PDH, Ypc, Ys and PK. The Figure 3 plots show the distribution of PDH error (PDHGroundTruth – PDHBestFit) as colored ‘clouds’ for each of the ground truth metabolic models. The plots illustrate results when fitting with only Model01, only Model02, only Model05, and only Model07 (bottom to top). These results simulate the common practice of assuming that PK and/or Ys are insignificant when lactate is used as a substrate and the primary study goal is to estimate PDH. Figure 3 (top) also illustrates the results of fitting all 13 models and selecting which metabolic model best fits the glutamate 13C-NMR multiplets. The results illustrate that fitting to all candidate models and selecting the best fit model shows superior performance (smaller and less frequent errors) with regard to PDH estimation in comparison with arbitrary fitting with any particular metabolic model. Further, it illustrates that use of fitting models that have Ys and PK turned off can lead to significant error/bias in PDH estimation in metabolic situations in which Ys and PK are actually active. Further illustrations of error performance for Ypc, Ys and PK will be given at the formal presentation.
Conclusion
tcaCALC has been developed as a tool that facilitates the quantitative analysis of metabolic tracing studies that use 13C enriched substrate. The most recent version of tcaCALC includes novel features of 1) incorporating spectral fitting of J-coupled 13C-NMR multiplets and 2) accommodating possibility of complex metabolic situations in which PDH, Ypc, Ys and PK may be active or inactive. The MATLAB source code and a compiled version is available to interested research teams.Acknowledgements
Financial support from NIH/NIBIB P41 EB015908References
Alger JR, Sherry AD, Malloy CR. tcaSIM: A simulation program for optimal design of 13C tracer experiments for analysis of metabolic flux by NMR and mass spectroscopy. Current Metabolomics 2018;6:176-187.Figures
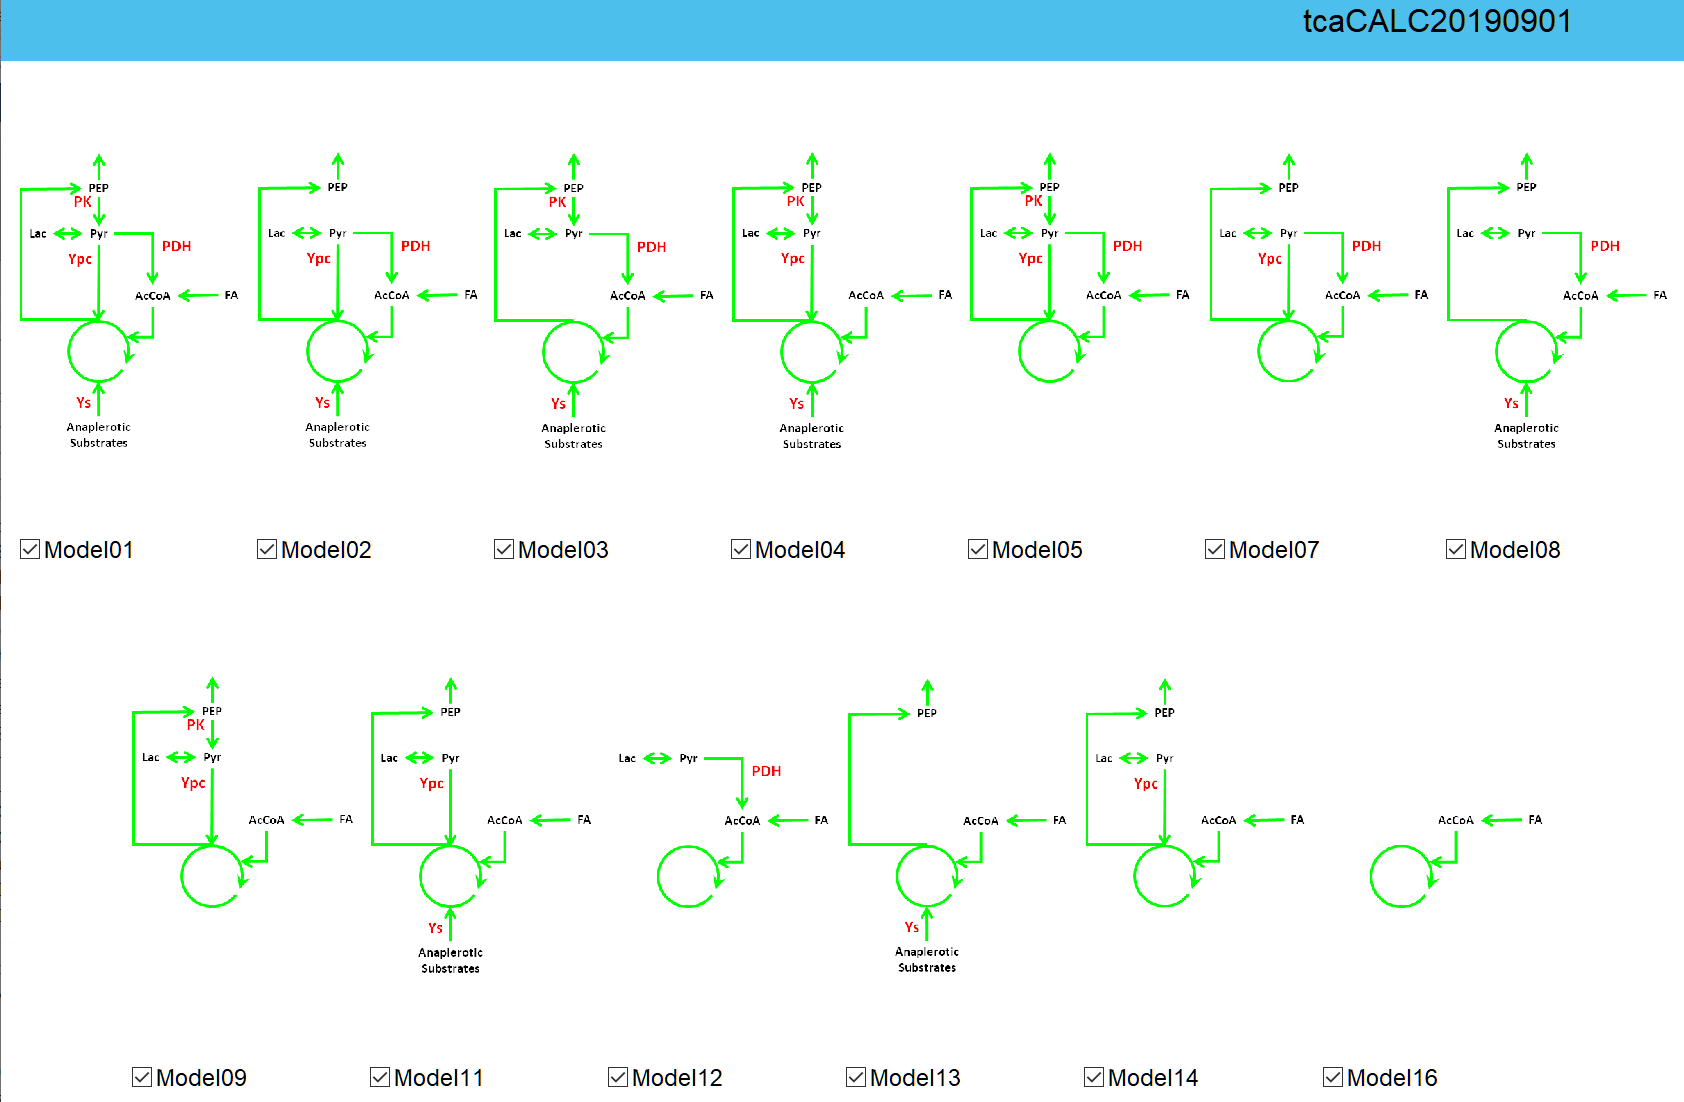
Figure 1: Candidate metabolic models as displayed on the user entry page of tcaCALC.
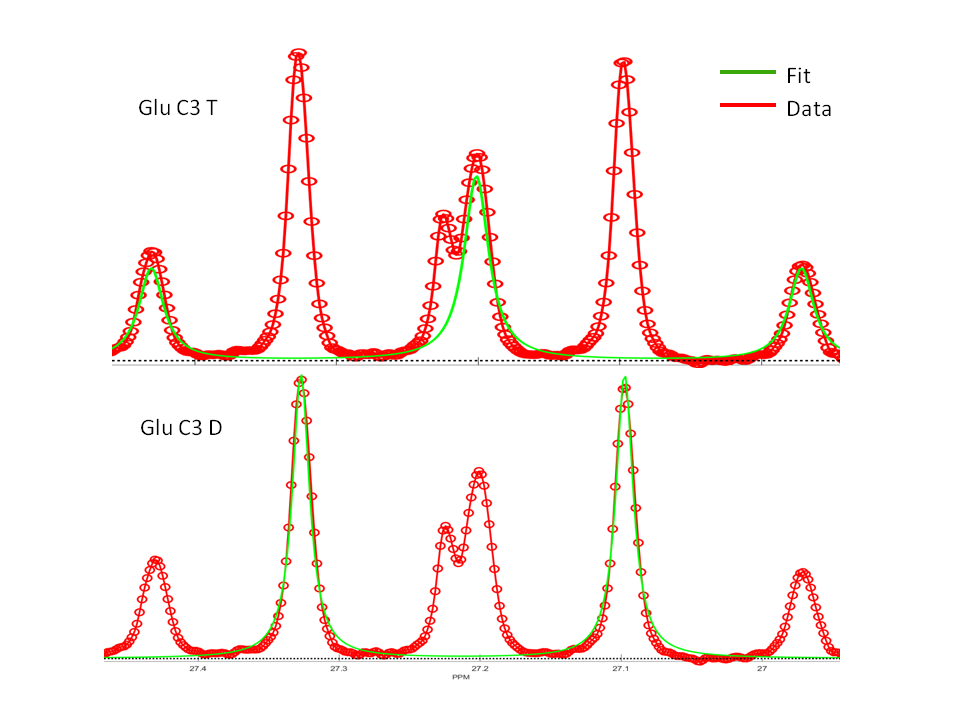
Figure 2: Illustration of 13C NMR multiplet fitting with tcaCALC.
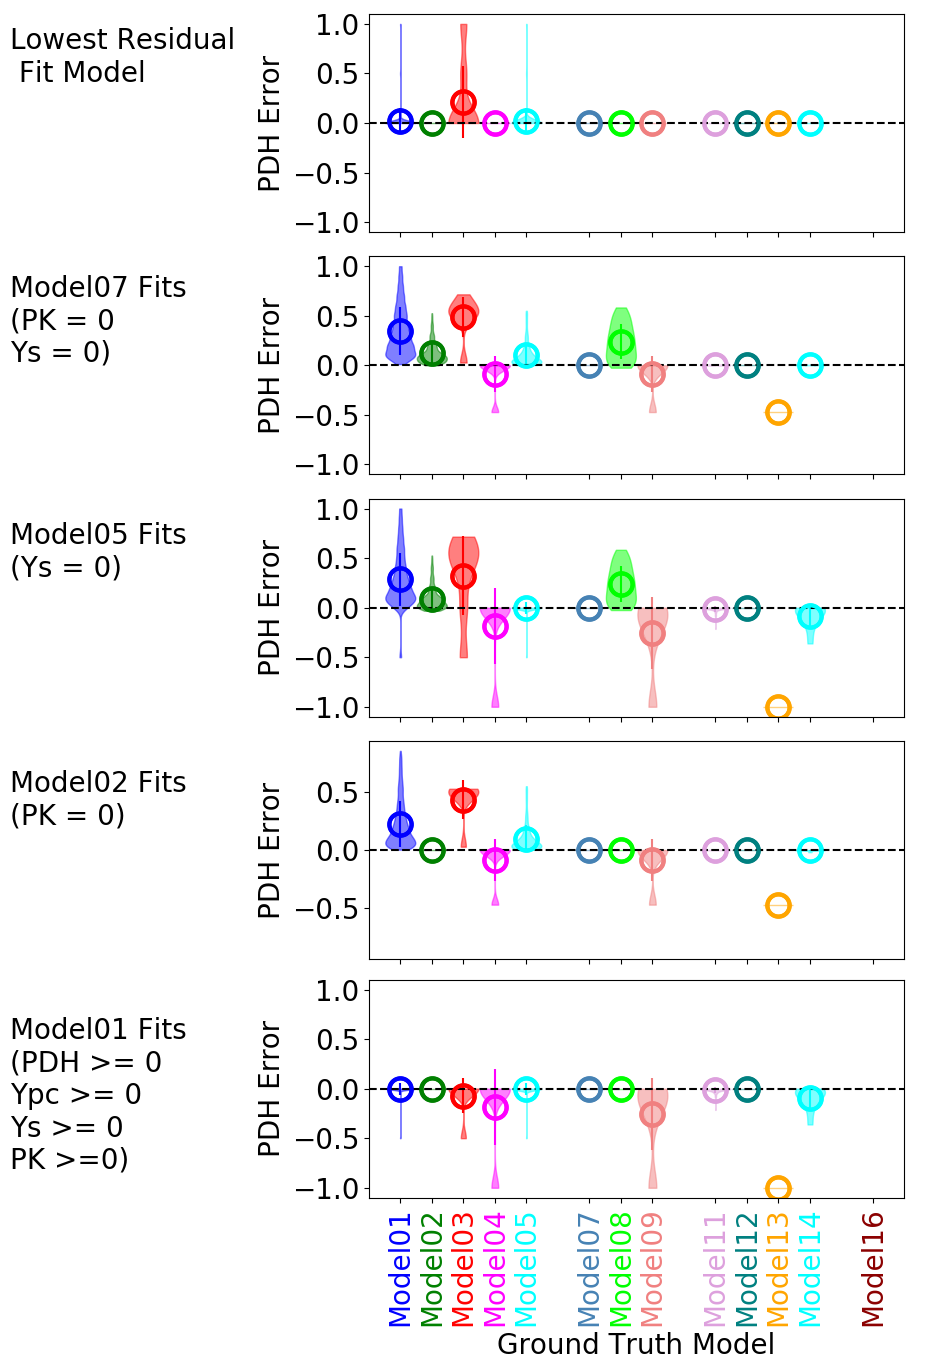
Figure 3: Example of tcaCALC error analysis for PDH. The colored 'clouds' display the error distribution. Means are circled and standard deviations are shown as vertical lines.