2989
Development of a 2H birdcage volume coil for homogeneous deuterium metabolic imaging of the human brain at 7T1Department of Radiology, University Medical Center Utrecht, Utrecht, Netherlands
Synopsis
Deuterium metabolic imaging (DMI) is a new emerging technique, which can measure the metabolism in the brain non-invasively. In this work, a shielded 2H birdcage volume coil for the head was developed and compared with a 2H surface coil setup. In contrast to the surface coil, the 2H birdcage coil enabled high SNR DMI measurements over the entire brain. The homogeneous B1+ field of the birdcage coil allowed for T1 mapping of deuterated water in the brain. Overall, the developed 2H birdcage coil shows high potential for non-invasive metabolic imaging of the brain.
Introduction
Metabolic processes in the brain play a crucial role in the cause or progression of many diseases, including neurodegenerative diseases, diabetes, and cancer. To gain knowledge on both the healthy and diseased brain, insight into underlying metabolism of the brain is essential. Deuterium metabolic imaging (DMI) is a novel, emerging technique, which enables non-invasive measurement of metabolism in vivo, after oral intake of deuterated glucose ([6,6′-2H2]glucose).1 It has been shown that DMI metabolite maps can distinguish brain tumours from healthy tissue, based on the increased production of deuterated lactate (Warburg effect).To date, mainly surface coils (single loops or phased arrays) have been used for DMI, because of their high SNR close to the coil.1,2 However, these coils have a decaying sensitivity profile towards the centre of the brain, which makes them less suited for applications that require a homogeneous B1+ field, such as T1 mapping or absolute signal quantification. A birdcage coil can be used to mitigate this issue. Especially at lower frequencies, as is the case for 2H at 7T (45.7 MHz), a birdcage coil can be effective because of its capability to produce a homogeneous B1+ field over the whole head. In this study, a 2H birdcage coil is developed and compared with a 2H surface coil for 3D DMI in the human brain at 7T.
Methods
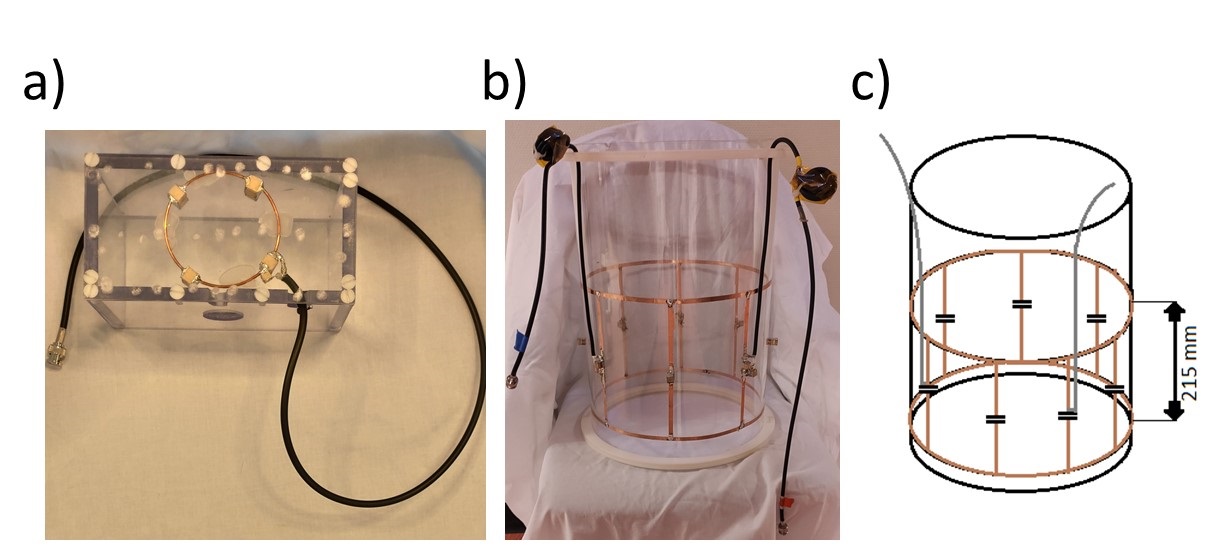
The study was performed on a 7T Philips Achieva system (Philips, Best, the Netherlands). A single-turn 2H surface coil was constructed with a diameter of 80 mm (Figure 1a). A shielded 2H birdcage volume coil with a diameter of 300 mm was constructed with 8 legs, each 215 mm long (Figure 1 b,c). 3D DMI of the brain was performed in the same volunteer using both the 2H surface coil, with the posterior part of the head positioned on top of the coil, and the 2H birdcage coil. A pulse-acquire sequence was used (TR = 333 ms), extended with phase-encoding gradients for 3D spatial encoding (11 x 11 x 11 matrix, FOV = 220 x 220 x 220 mm3, 20 x 20 x 20 mm3 nominal voxel size). Other acquisition parameters were as follows: 5000 Hz spectral bandwidth, 1024 points, NSA=4, FA=90°, 0.5/1.67 ms block pulse for the acquisition with the surface coil/birdcage coil. Using the 2H birdcage coil, additional, lower-resolution 3D DMI scans were made with a varying TR to make T1 maps. For these scans, the acquisition parameters were as follows: 7 x 6 x 9 matrix, FOV = 245 x 210 x 315 mm3, 35 x 35 x 35 mm3 nominal voxel size, 5000 Hz spectral bandwidth, 512 points, FA=90°, 1.67 ms square excitation pulse, TR=137/210/333/600/1200 ms with NSA=8/8/8/4/2. All scans were reconstructed offline, with Hamming filtering in the spatial domain and 10-Hz Gaussian apodization in the spectral domain using the CSIgui3 in MATLAB.Results
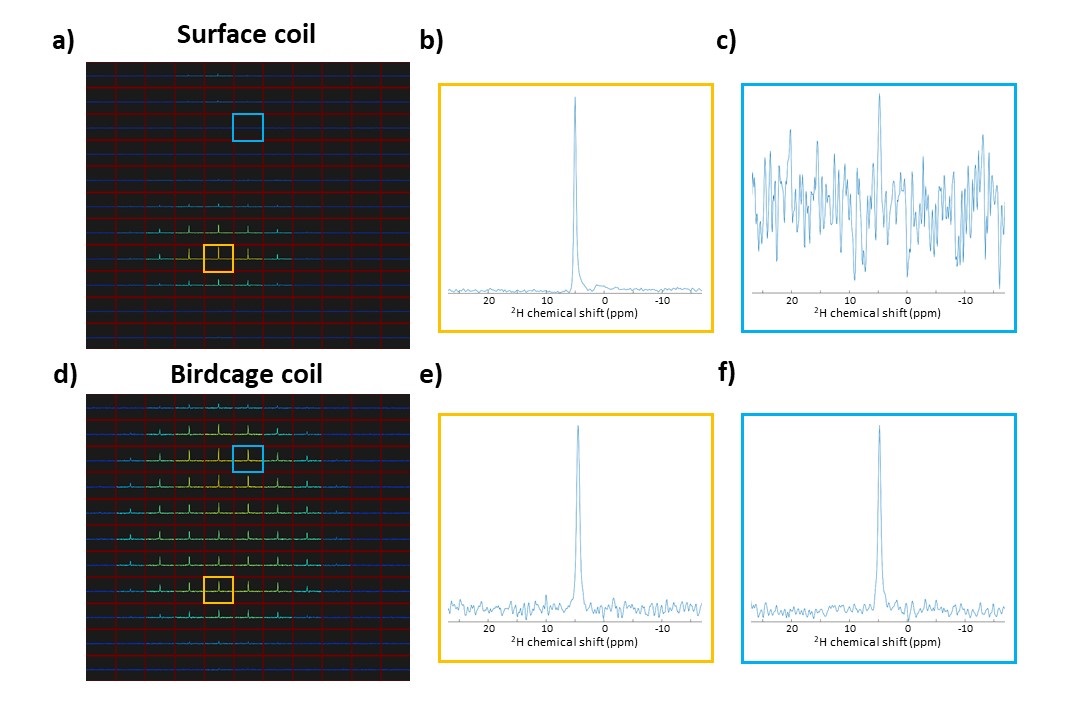
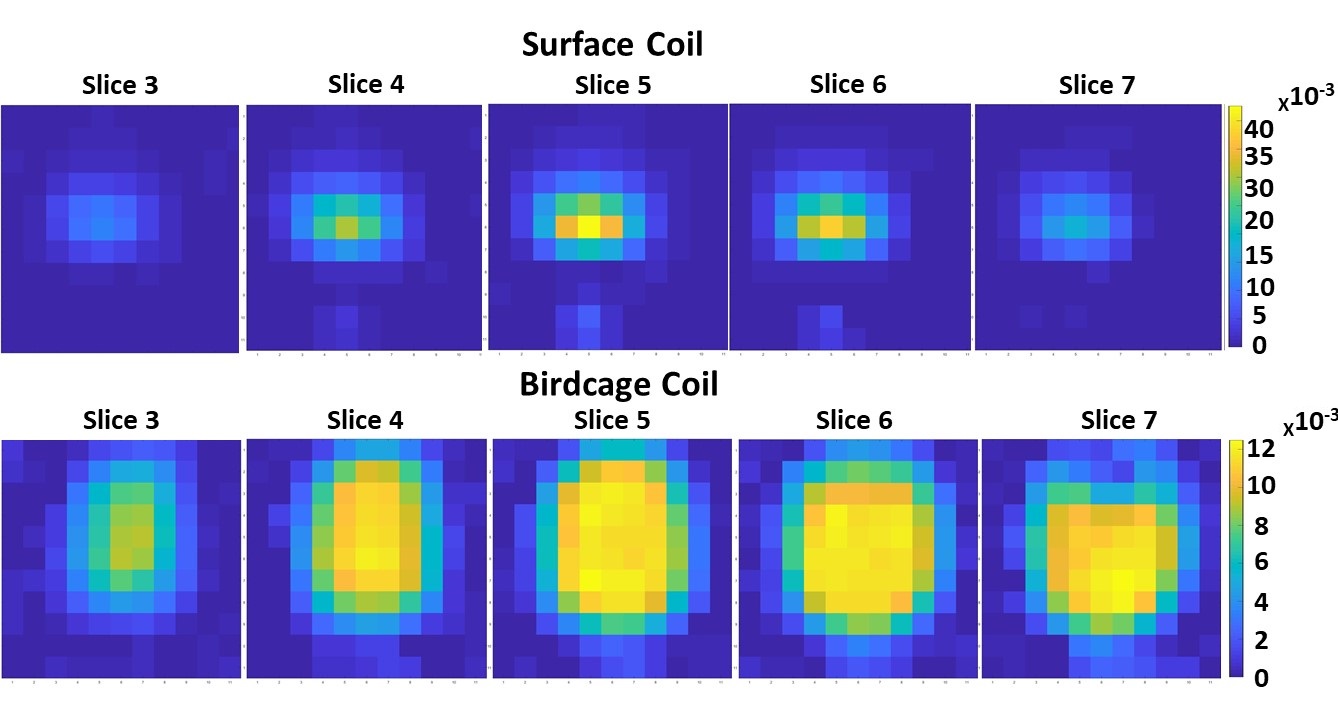
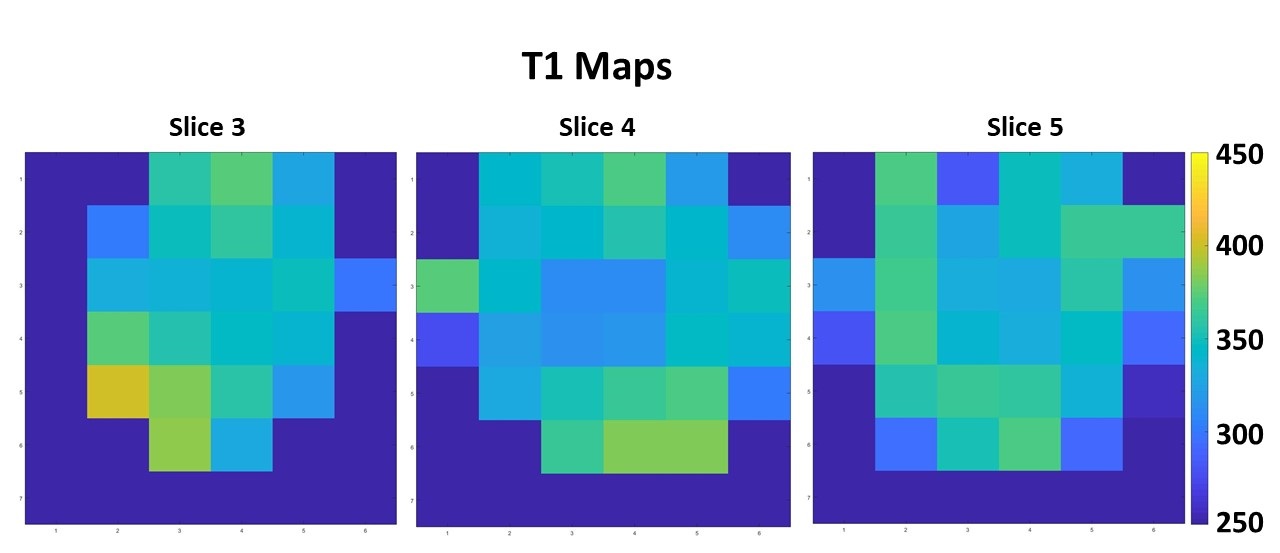
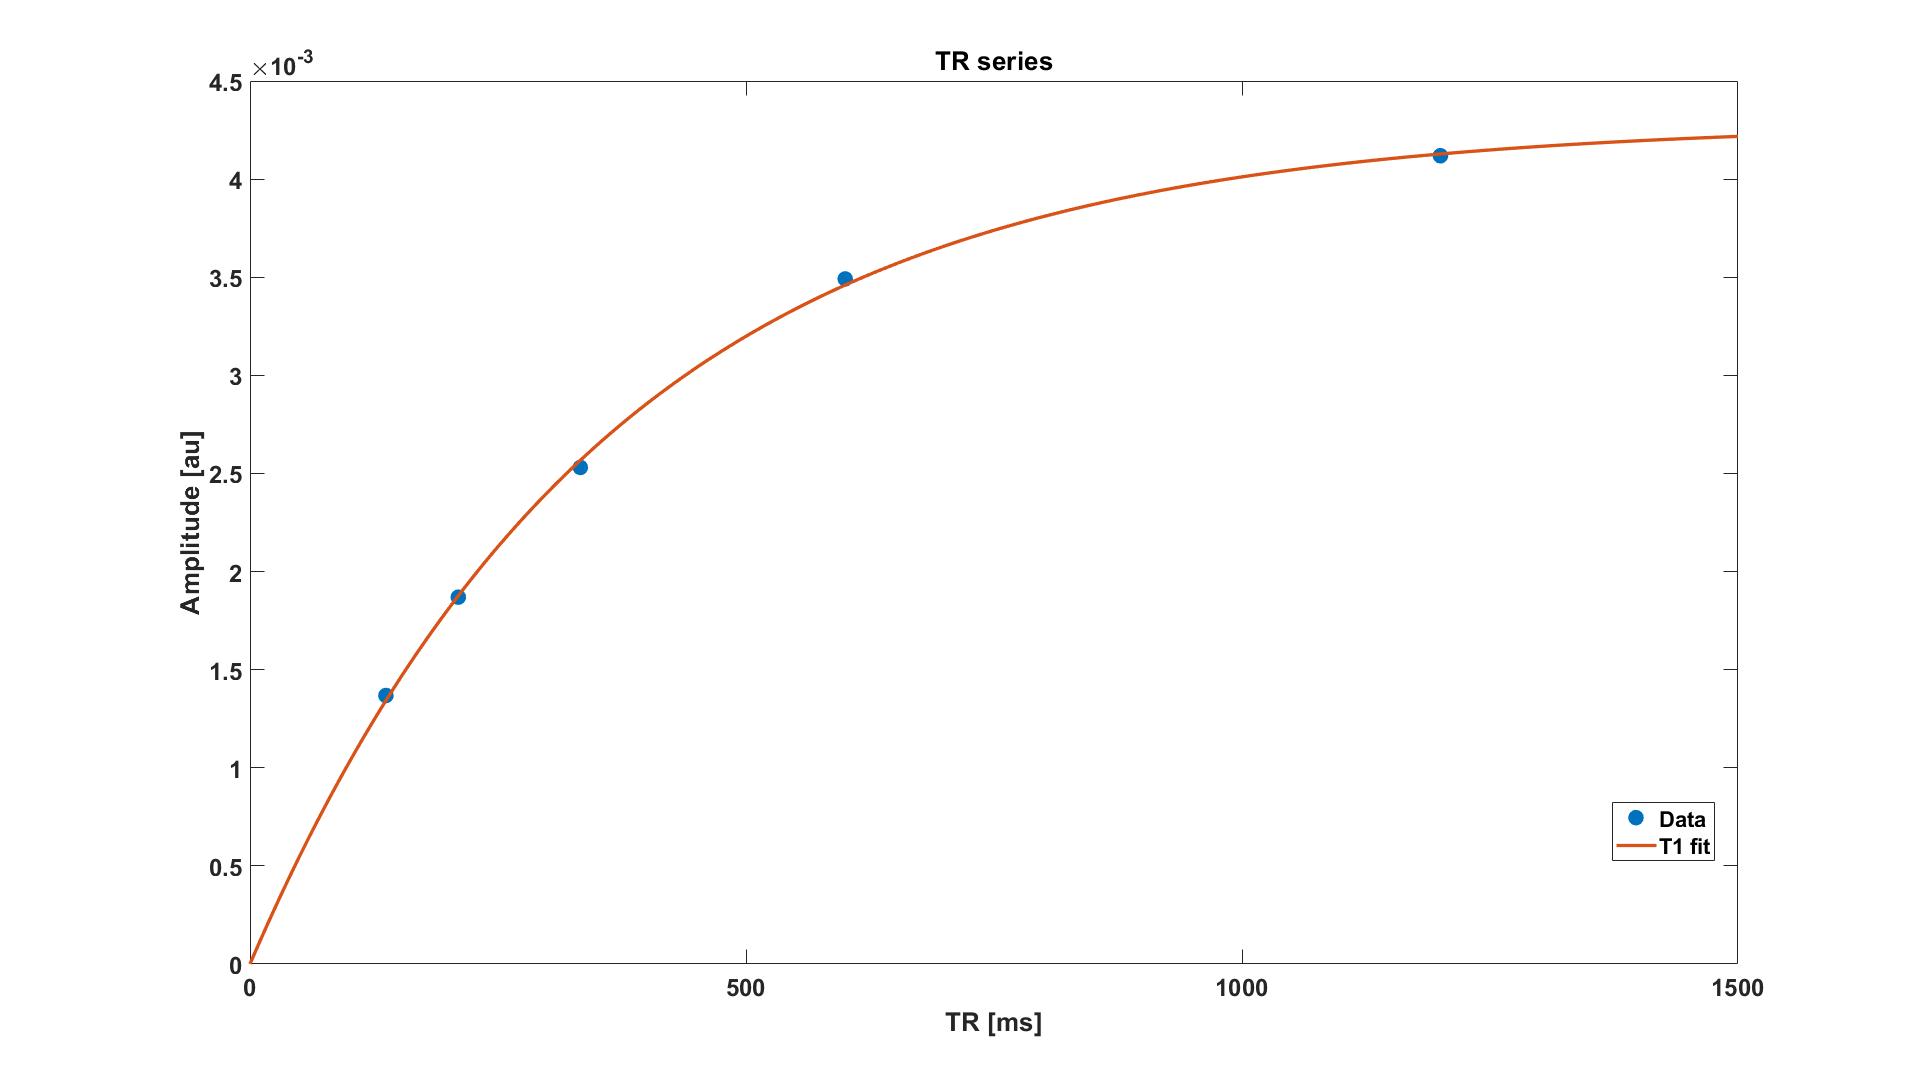
The performance of the developed 2H birdcage coil for 3D DMI acquisitions in the brain is shown in Figure 2, where it is compared to the 2H surface coil. For each coil setup, the slice with the highest natural abundance 2H water signal was selected for this figure. The birdcage coil receives signal from the whole brain in this slice, while the surface coil only detects signal in the posterior area of the brain (close to the surface coil). The highlighted spectra show that the SNR of the surface coil is higher than that of the birdcage coil close to the coil, but that hardly any signal is detected with the surface coil at the anterior side of the brain. In contrast, the 2H birdcage produces spectra with similar SNR’s at those two locations in the brain. The metabolic maps of deuterated water are shown for both coils in Figure 3. The birdcage coil shows a more homogeneous distribution of signal over and within the different slices of the brain. This allows for water T1 mapping, which is shown in Figure 4. An example of the mono-exponential fit of the saturation recovery curve for one of the voxels is shown in Figure 5. In the T1 maps, the T1 values have an average of 340 ms with a standard deviation of 28 ms.Discussion and Conclusion
The developed 2H birdcage coil enables high SNR DMI measurements over the entire brain. In contrast to the measurement with the 2H surface coil, the natural abundance 2H water signal acquired with the birdcage coil was homogeneously distributed over the brain. The homogeneous B1+ field of the birdcage coil allowed for T1 mapping of deuterated water in the brain. Throughout the whole brain, T1 values were rather homogeneous (340±28 ms) and accordance with literature values.1In this study, traditional sampling strategies were used. The application could benefit from more advanced acquisition strategies (such as spirals or EPSI), to reduce the acquisition time of the 3D DMI scans or to increase the spatial resolution. In addition, the sensitivity could be increased by combining the birdcage coil with additional receive arrays.
Overall, the developed 2H birdcage coil shows high potential and is ready to be combined with oral intake of deuterated glucose for non-invasive metabolic imaging of the brain in the next phase.
Acknowledgements
This work was funded by a HTSM grant from NWO TTW (project number 17134).References
1) De Feyter HM, Behar KL, Corbin ZA, Fulbright RK, Brown PB, McIntyre S, Nixon TW, Rothman DL, de Graaf RA. Deuterium metabolic imaging (DMI) for MRI-based 3D mapping of metabolism in vivo. Sci Adv 2018; 4: eaat7314.
2) de Graaf RA, Hendriks AD, Klomp DW, Kumaragamage C, Welting D, Arteaga de Castro CS, Brown PB, McIntyre S, Nixon TW, Prompers JJ, De Feyter HM. On the magnetic field dependence of deuterium metabolic imaging (DMI). Proceedings of the 27th Annual Meeting of the ISMRM, Montreal, Canada, 2019. p.0492
3) CSIgui v2, http://ww.csigui.tk, visited on 25/09/2019.
Figures