2987
Towards structure and metabolism of glycogen C1-C6 by 13C MRS at 7Tusing broadband 1H decoupling and low-power NOE by means of bi-level WALTZ cycles
1Laboratory of Functional and Metabolic Imaging (LIFMET) - Ecole Polytechnique Fédérale de Lausanne (EPFL), Lausanne, Switzerland, 2Centre d'Imagerie BioMédicale - Animal and Imaging Technology (CIBM-AIT) - Ecole Polytechnique de Lausanne (EPFL), Lausanne, Switzerland, 3Department of Radiology, Universities of Lausanne (UNIL) and Geneva (UNIGE), Lausanne, Switzerland
Synopsis
Glycogen metabolism is essential for glucose homeostasis in humans and may be disrupted in a variety of diseases. Largely neglected due to its low concentration, yet brain glycogen plays an active role in brain energy metabolism, such as during hypo-glycemia. Carbon-13 Magnetic Resonance Spectroscopy (13C MRS) allows the non-invasive detection of glycogen in vivo, while is typically done via the C1 carbon signal. In this study, we explore the potential of 13C MRS at 7T using uniform 13C excitation and bi-level broadband 1H-decoupling towards simultaneous detection of glycogen C1-C6 in vivo in human muscle, as a step towards brain studies.
Introduction
Glycogen is the main energy store in the human body, mostly found in liver and skeletal muscle but also in brain where it is most susceptible of being disrupted [1]. With the advent of in vivo 13C-MRS, it has been possible to monitor changes of glycogen concentration and to follow glycogen metabolism non-invasively [2], indicating that there must be a considerable motion within its structure despite its high molecular weight. Whilst in vivo 13C-MRS of glycogen is typically performed via the anomeric C1 carbon arising from its primary structure, the 13C relaxation properties of the C1 to C6 resonances may bring complementary information for investigating glycogen metabolism [3], at the expense of their low sensitivity. In this context, the aim of this study was to explore the advantage of 13C-MRS at 7T using bi-level broadband 1H-decoupling in terms of achievable bandwidth and sensitivity gain, while investigating its potential feasibility towards simultaneous detection of glycogen C1-C6 at 7T.Methods
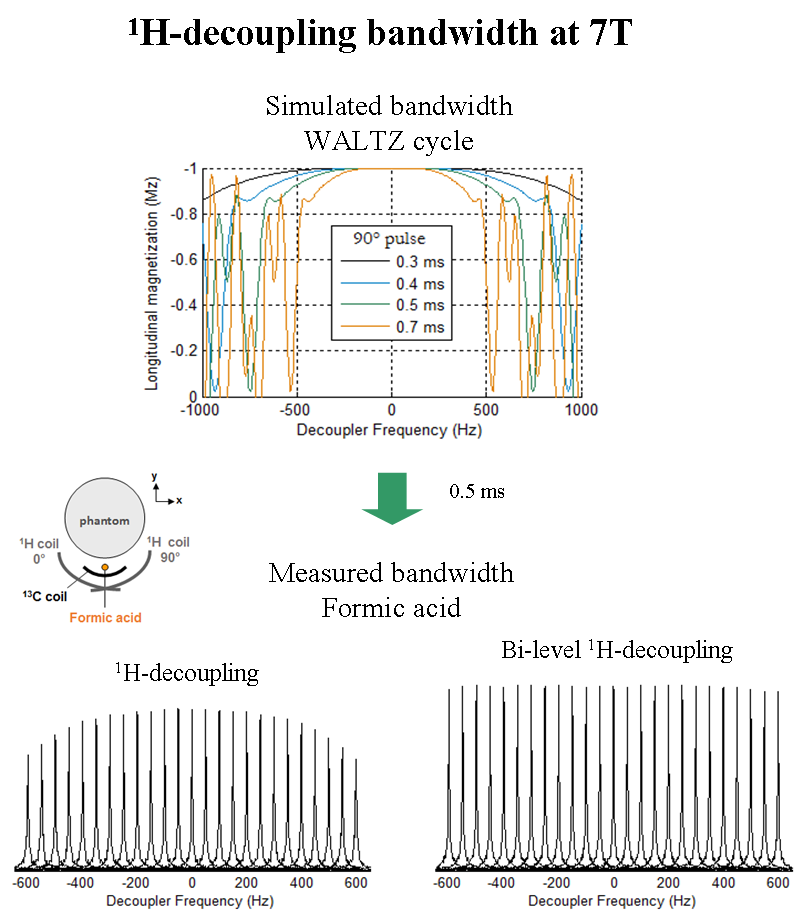
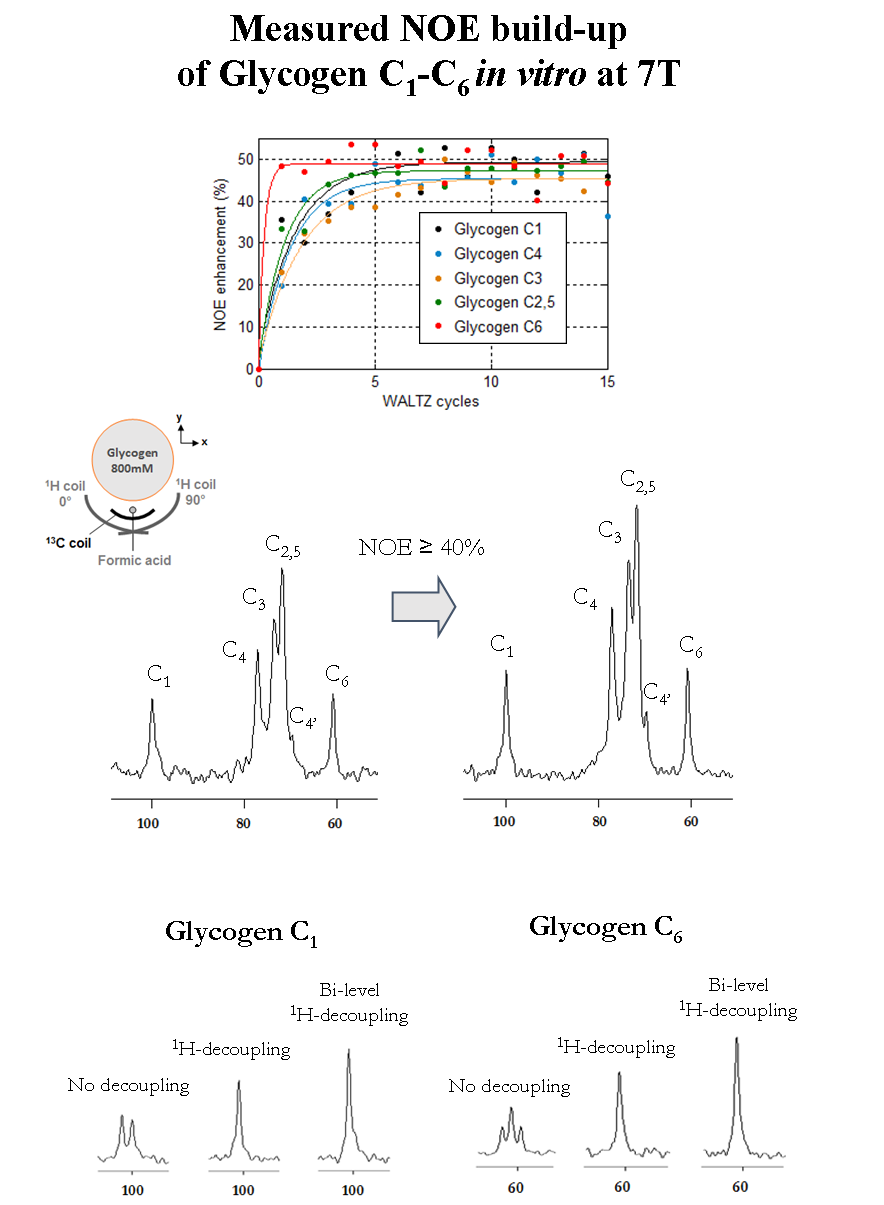
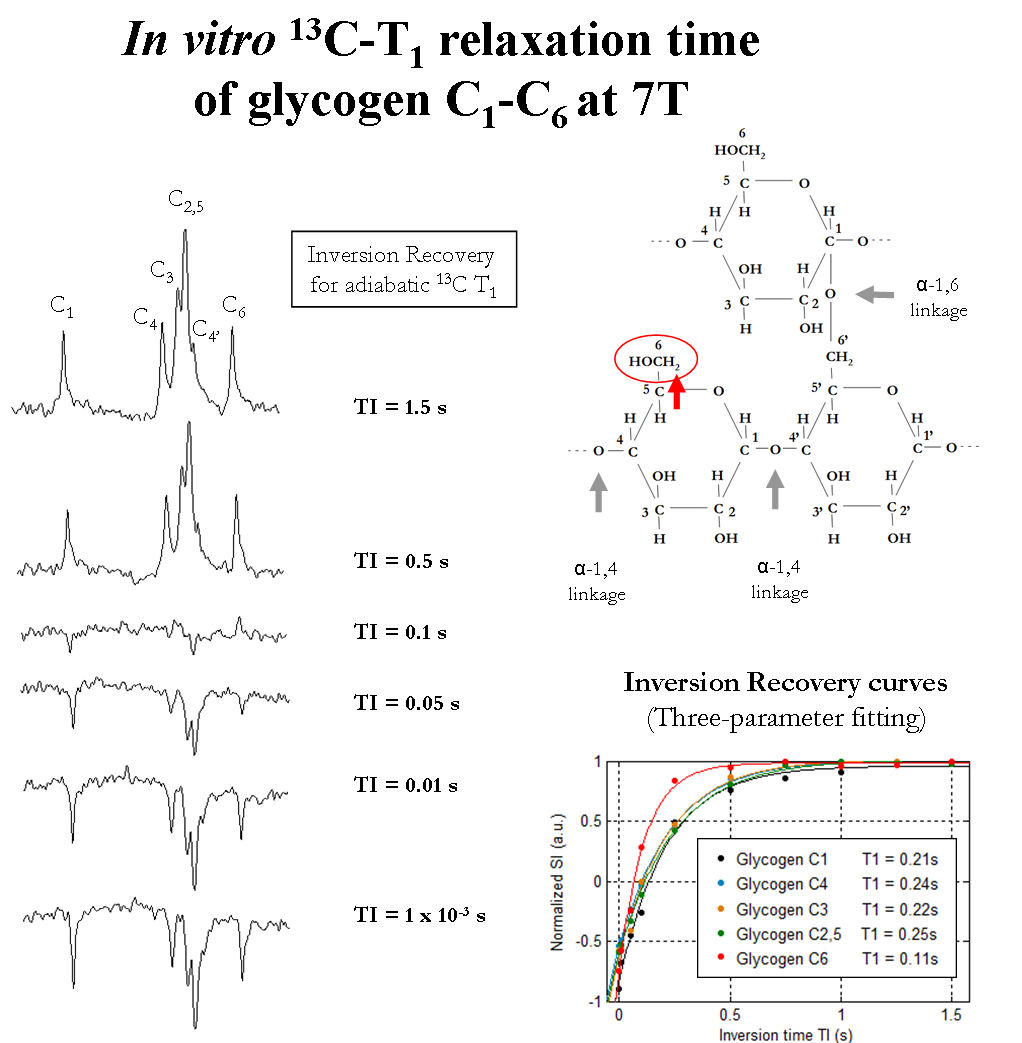
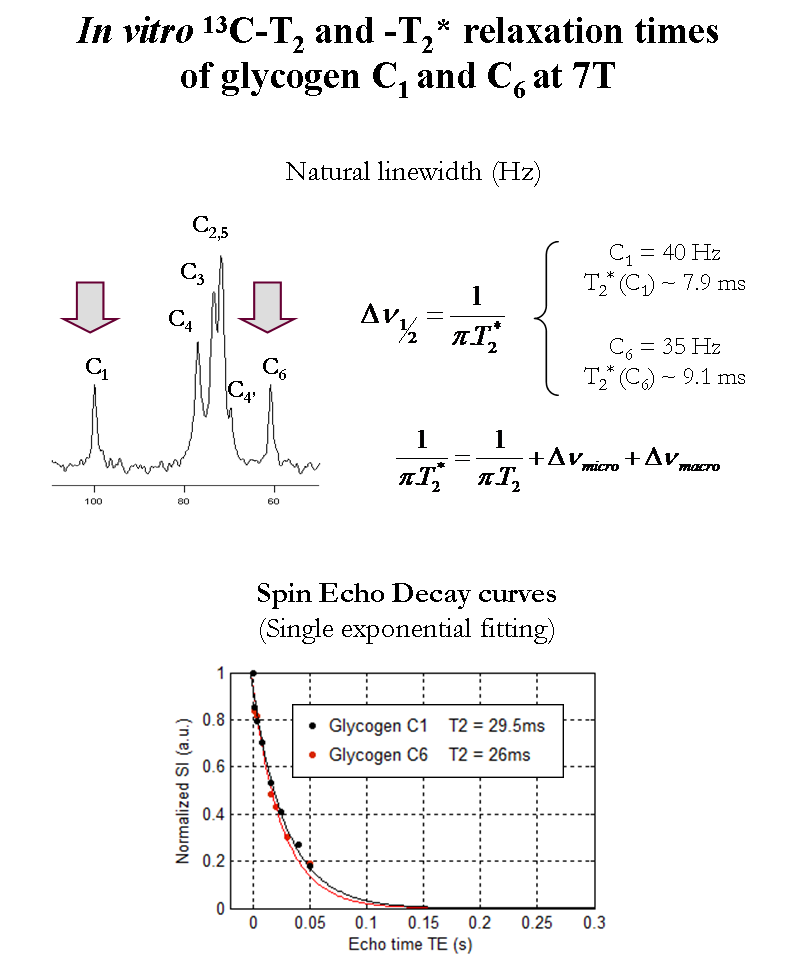
Proton-decoupled 13C-MRS measurements of glycogen C1-C6 were performed on a 7T human-scanner (Siemens Erlangen/Germany) using a home-built 13C-linear/1H-quadrature RF surface coil. A pulse-acquire sequence for sensitivity-enhanced localized 13C-MRS using bi-level 1H-decoupling was developed. Bi-level 1H-decoupling consisted of a series of equidistant WALTZ cycles interleaved with time delays during 13C-relaxation time for the generation of low-power NOE and WALTZ-16 for broadband 1H-decoupling during 13C-signal acquisition. The duration of the main WALTZ-cycle 90°-pulse was fixed to 0.5 ms to cover the ~3 ppm of glycogen H1-H6 [4]. The decoupling bandwidth was simulated and validated in vitro on a small bubble containing 99% 13C-enriched formic acid placed at the 13C-coil centre. The 13C-MR relaxation properties of glycogen C1-C6 at 7T were evaluated on a phantom containing 800mM natural abundance of glycogen. In particular, the NOE enhancement was measured by applying successively a series of WALTZ-cycles until the steady-state was reached. In addition, the spin-lattice (13C-T1) and spin-spin (13C-T2) relaxations times were measured using an optimized adiabatic inversion recovery and Hahn spin-echo sequences. All in vitro 13C-MRS measurements of glycogen C1-C6 were performed with symmetric adiabatic 13C-excitation (2ms) [5], using the centre of the 13C spectrum close to the C4 resonance (i.e. ~80 ppm). Natural abundance 13C-MRS of glycogen was acquired in vivo from the calf muscle of a healthy volunteer who signed informed consent of the local ethics committee. First and second order shims were adjusted using FAST(EST)MAP [6].Results and discussion
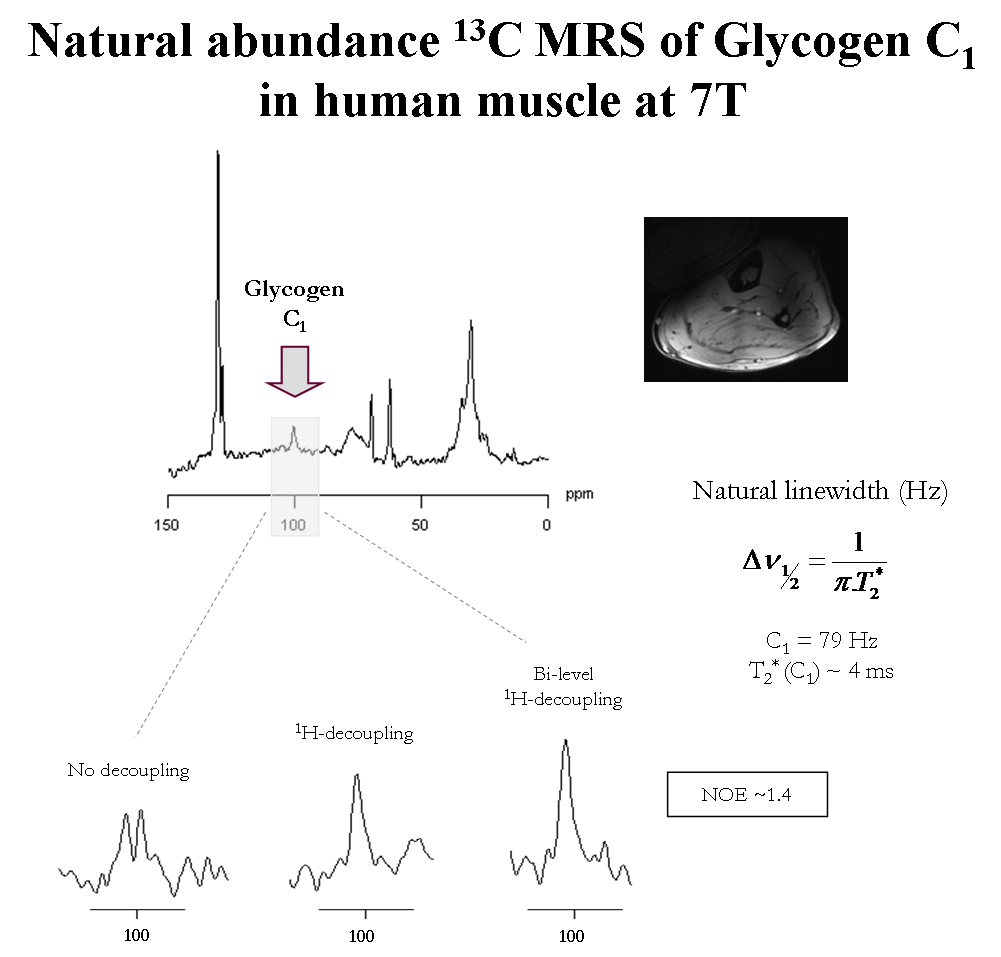
The measured bandwidth of formic acid at 7T using 1H-decoupling was in agreement with the simulated bandwidth, while using bi-level 1H-decoupling the decoupling bandwidth was increased and the B2 in-homogeneities off-resonance were eliminated (Figure1). An improved spectral resolution and sensitivity was further implied from the 13C-MR spectra of glycogen C1-C6 at 7T (Figure2). In particular, peak assignments of glycogen resonances C1, C4, C3, C2,5, C4’ and C6 were in agreement with the literature [3], at the expense that the C4 appeared clustered due to the lower field compared to [3]. In addition, signal enhancements of glycogen C1-C6 were ≥ 40% enhancement, i.e. higher than those encountered in the literature [3]. In particular, the NOE build-up of glycogen C6 was found to be faster compared to that of glycogen C1-C5 (Figure2). Besides, the 13C-T1 of glycogen C1-C6 measured ~ 0.23s and 1.1s for glycogen C1-C5 and C6, respectively (Figure3), in close agreement with [3], while the ~ half T1 of glycogen C6 versus those of glycogen C1-C5 was attributed to the two bonded protons of the C6 versus one of the C1-C5 [3]. The 13C-T2 of glycogen C1 and C6 were similar to each other as well as their measured line-widths, implying similar T2* for C1 and C6 (Figure4), while the small differences of T2 with [3] were attributed to the T2 dependence with the temperature. In addition, the line-width of the glycogen C4 resonance appeared to be twice of that of the C1 or C6, in agreement with [3], as attributed to its position at a branch point. For similar reasons, no resonance from C6 in α(1→6) linkage (i.e. ~ 67 ppm) was observed. The 13C-MR spectra from the human calf in vivo at 7T revealed glycogen C1 at 100.5ppm, while a signal enhancement of ~1.4 was achieved using bi-level 1H-decoupling (Figure5). The 13C-T1 of glycogen C1 was measured in vivo from the same subject, resulting in very close agreement with the T1 of glycogen C1 in vitro, i.e. ~0.21s (not shown). In contrast, the measured line-width of glycogen C1 in vivo was slightly broader compared to that in vitro, resulting in a T2* of ~4ms (Figure5), indicating difference in the motional properties of the glycogen C1 carbon when the two states are compared.Conclusion
We conclude that 13C-MRS at 7T using bi-level broadband 1H-decoupling improves both spectral resolution and sensitivity of glycogen C1-C6 in vitro as well as glycogen C1 in human muscle in vivo at 7T, suggesting further extension of this method towards simultaneous detection of glycogen C1-C6 in vivo at 7T. The high resolution of glycogen C1 and C6 at 7T suggest potential further extension into brain studies upon infusion.Acknowledgements
This study was supported by Centre d’Imagerie BioMédicale (CIBM) of the UNIL, UNIGE, HUG, CHUV, EPFL and the Leenaards and Jeantet Foundations.
References
[1] Gruetter R. JNR. 2003;74(2):179-83
[2] Oz G. et al, N Int. 2003;43:323-9
[3] Sillerud LO. et al, Bioch 1983;22,1087-1094
[4] Chen W. et al, Bioch 1993;32,43
[5] Serés Roig E. et al, NMR Biomed. 2019
[6] Gruetter R et al. MRM 2000;43,319-323
Figures