2983
Non-Invasive Dynamic Assessment of Heart Energy Metabolisms using in vivo Deuterium MRS Imaging and Close Chest Model1Center for Magnetic Resonance Research, Radiology, University of Minnesota, Minneapolis, MN, United States, 2Medical Physics, Radiation Oncology, University of Minnesota, Minneapolis, MN, United States
Synopsis
Continuation from our previous open-chest rat heart project to exploit the in-vivo deuterium (2H) MRS (DMRS) or imaging (DMRSI) methods for dynamic measurement of the myocardial energy metabolism in rat heart at 16.4 T, we further tested its sensitivity and feasibility in response to cardiac glucose metabolism as compared with acetate using a non-invasive method on close-chest rats by using a 1H/2H dual-frequency surface coil. This work demonstrates that both fatty acids and glucose are the main sources of fuel for cardiac activities with a preference for fatty acids.
Introduction
Heart failure is a serious syndrome affecting ~5 million people in the United States and until recently, methodologies have failed to attest myocardial activities and energy metabolisms in the heart.1 Recent advances in Deuterium (2H) MR (DMR) spectroscopy (DMRS) for brain application2 has allowed us to apply this method to better understand myocardial metabolism.In this study, we extended our experimental designs from open-chest rat model3 to completely non-invasive DMRS imaging on close-chest rats; and evaluated the sensitivity and feasibility of DMRS in studying cardiac energy metabolism and substrate preference at 16.4T.Materials & Methods
Ten female Sprague Dawley rats (Body Weight (BW): 291±24g) under ~2% isoflurane anesthesia were scanned. D-Glucose-6,6-D2 (Cambridge Isotope Laboratories, Inc., 1.0 g/kg BW) or Acetate-D3 (Sigma-Aldrich, 1.0 g/kg BW or 1.0 g/rat) dissolved in 2.5 mL saline was used. Animals’ rectal temperature was maintained at 37.5±1℃ using heated circulating water; their arterial blood pressure and heart rate were monitored through the entire experiment. The animal protocol is approved by the University of Minnesota IACUC. All experiments were conducted on a 16.4T/26cm bore scanner (Varian/VNMRJ) using a 1H/2H (700MHz/107MHz) dual-frequency surface coil (~1.7cm in diameter) positioned underneath the heart outside of the rat body with the animal in a prone position.A 2H 3D-CSI FSW-weighted sequence was used to obtain dynamic DMR spectra in coronal orientation with 9×9×5 3D phase-encoding matrix, 6×6×5cm3 FOV, 45ms TR and 69s per CSI volume for 80mins acquisition. To introduce substrates, the first 5 mins baseline was followed by i.v. infusion of either D-Glucose-6,6-D2 (~0.3 g, n=3) within 8mins or Acetate-D3 compound (0.25-1.0 g, n=7) within 25-75mins. An inversion recovery pulse sequence was used to measure acetate T1 to account for the T1 saturation effect. All resonance signals (deuterated water (D2O), glucose, glutamate/glutamine (Glx), acetate, lactate) were fitted using a MATLAB-based program for quantification.
Results
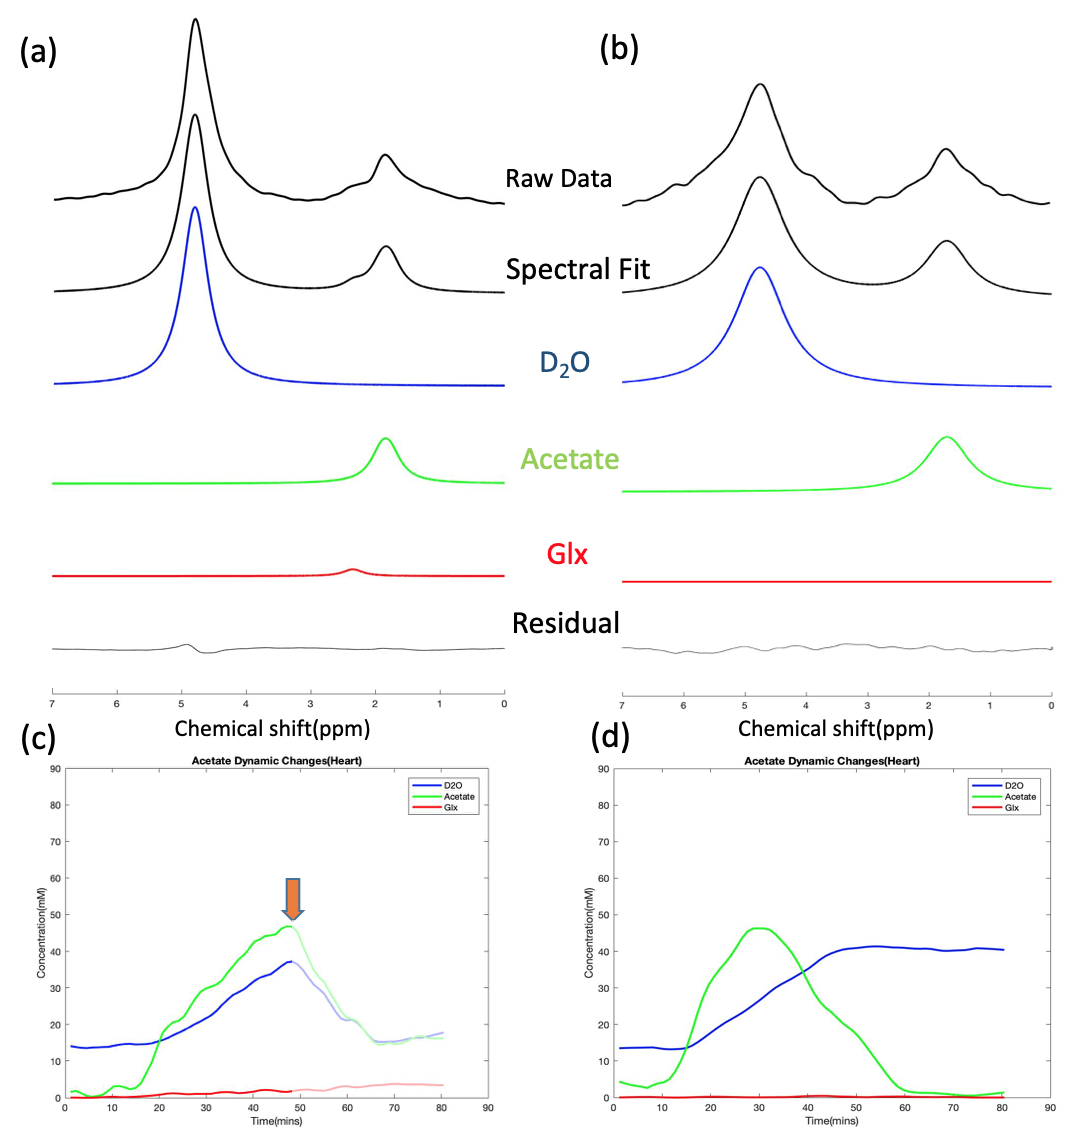
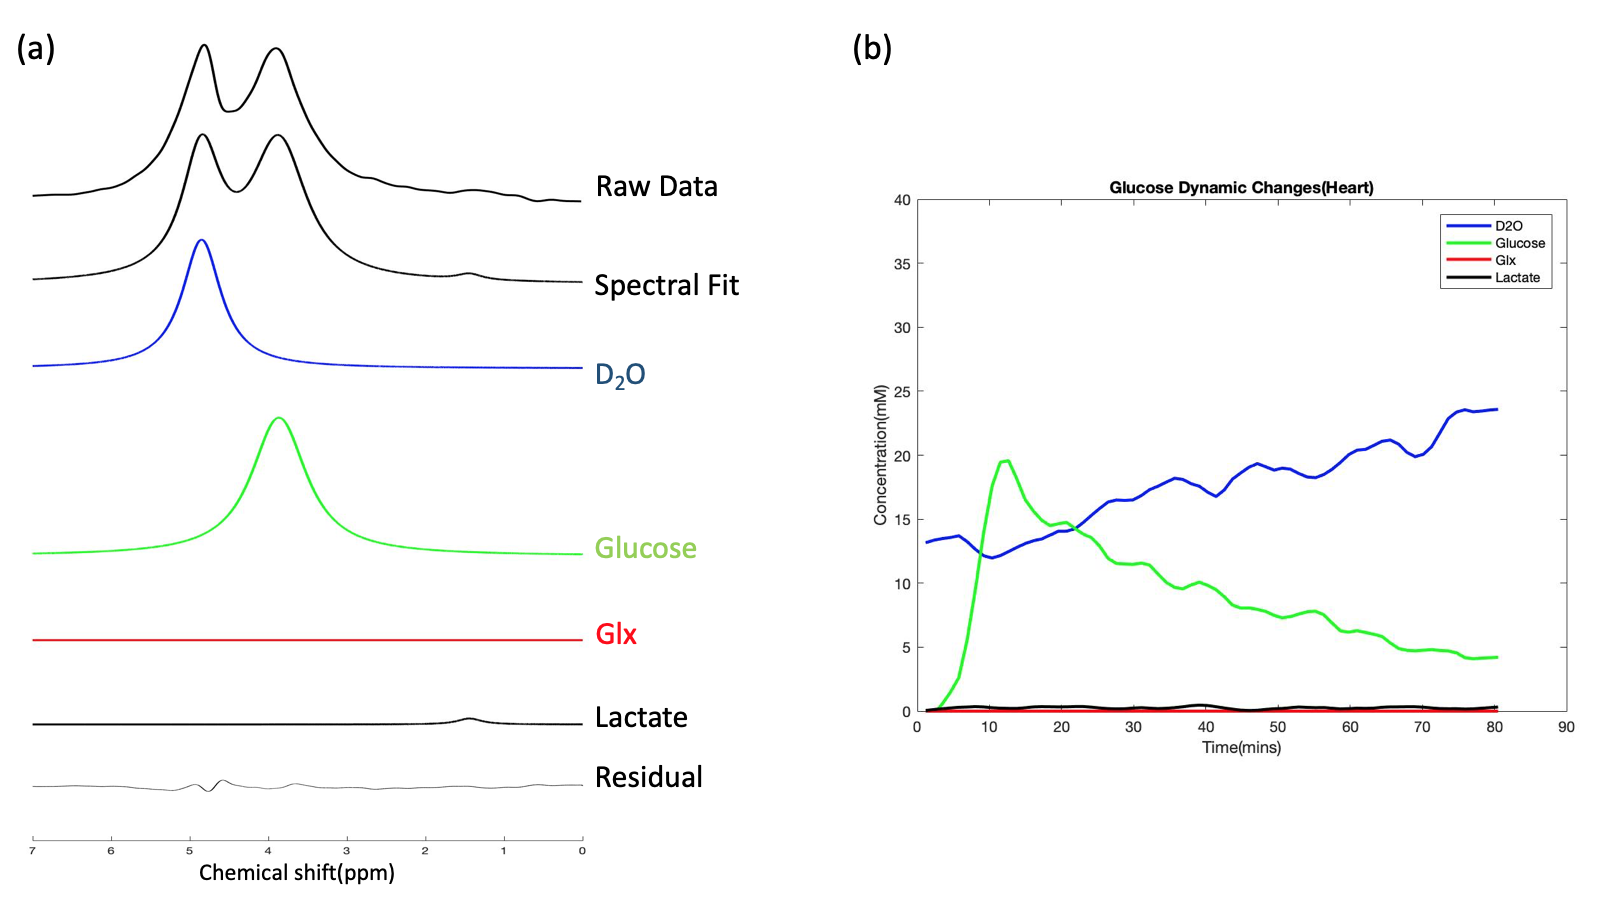
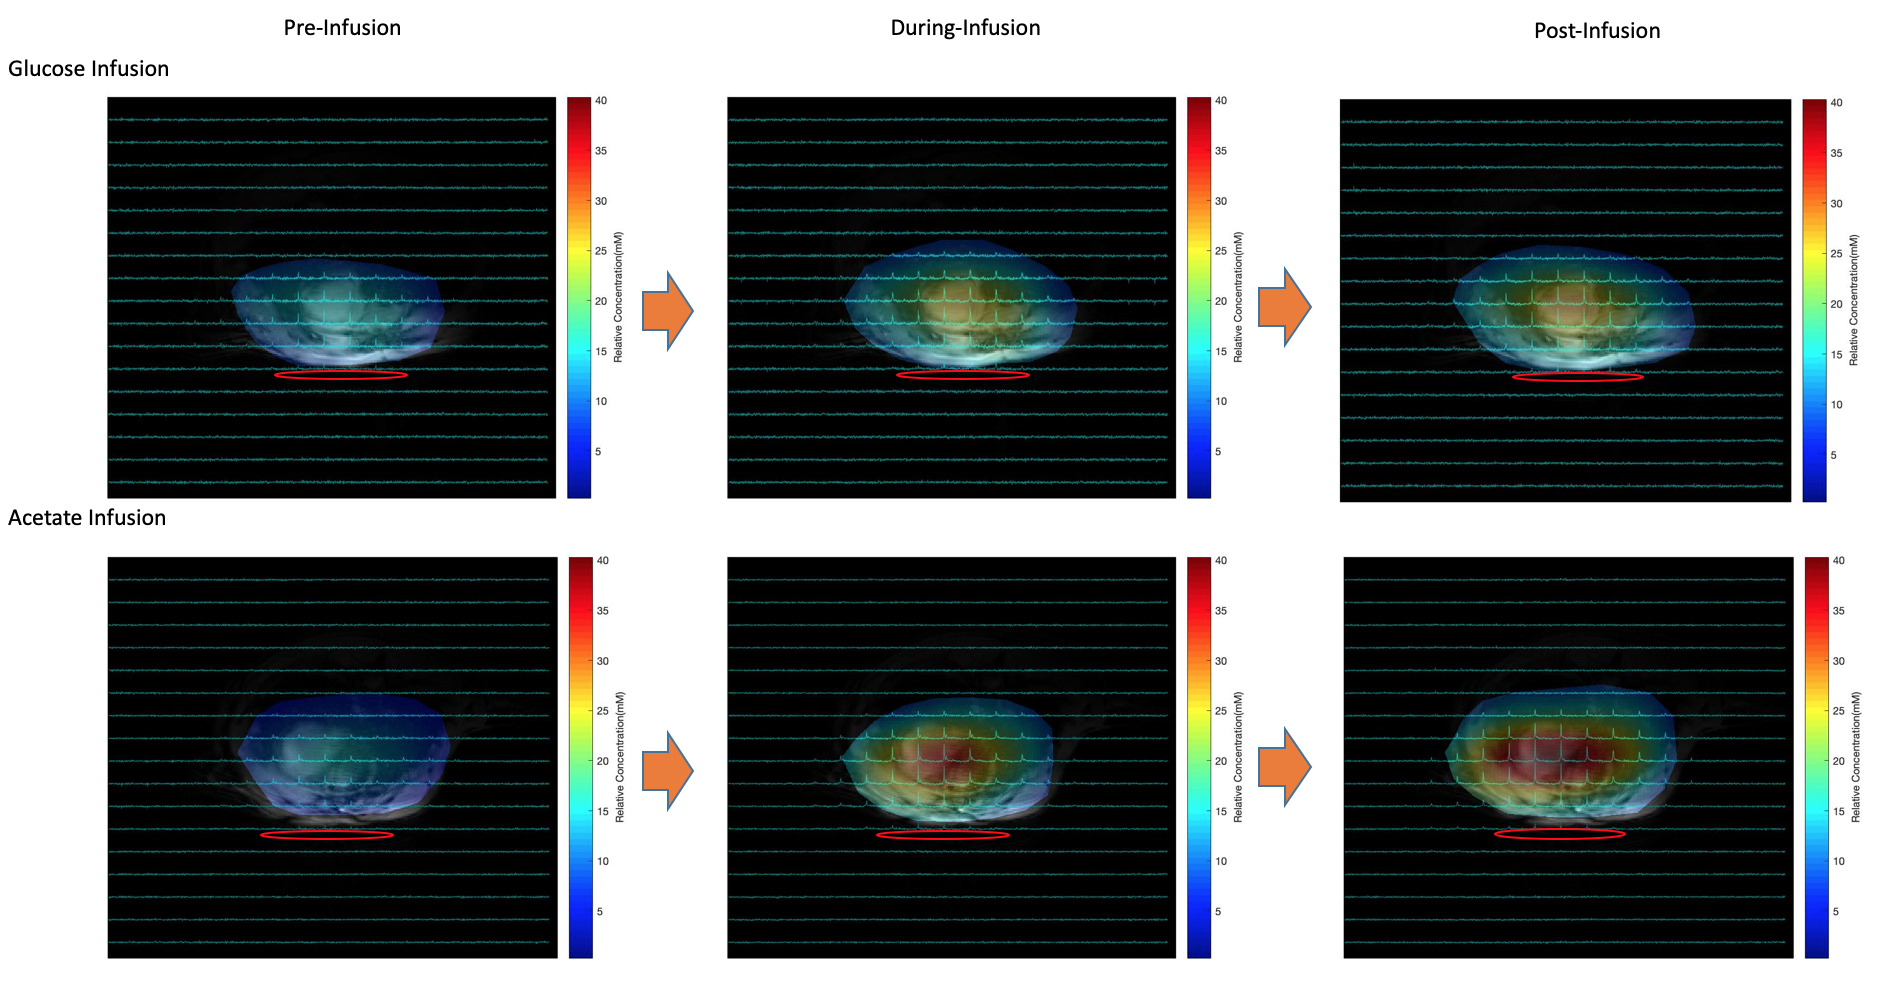
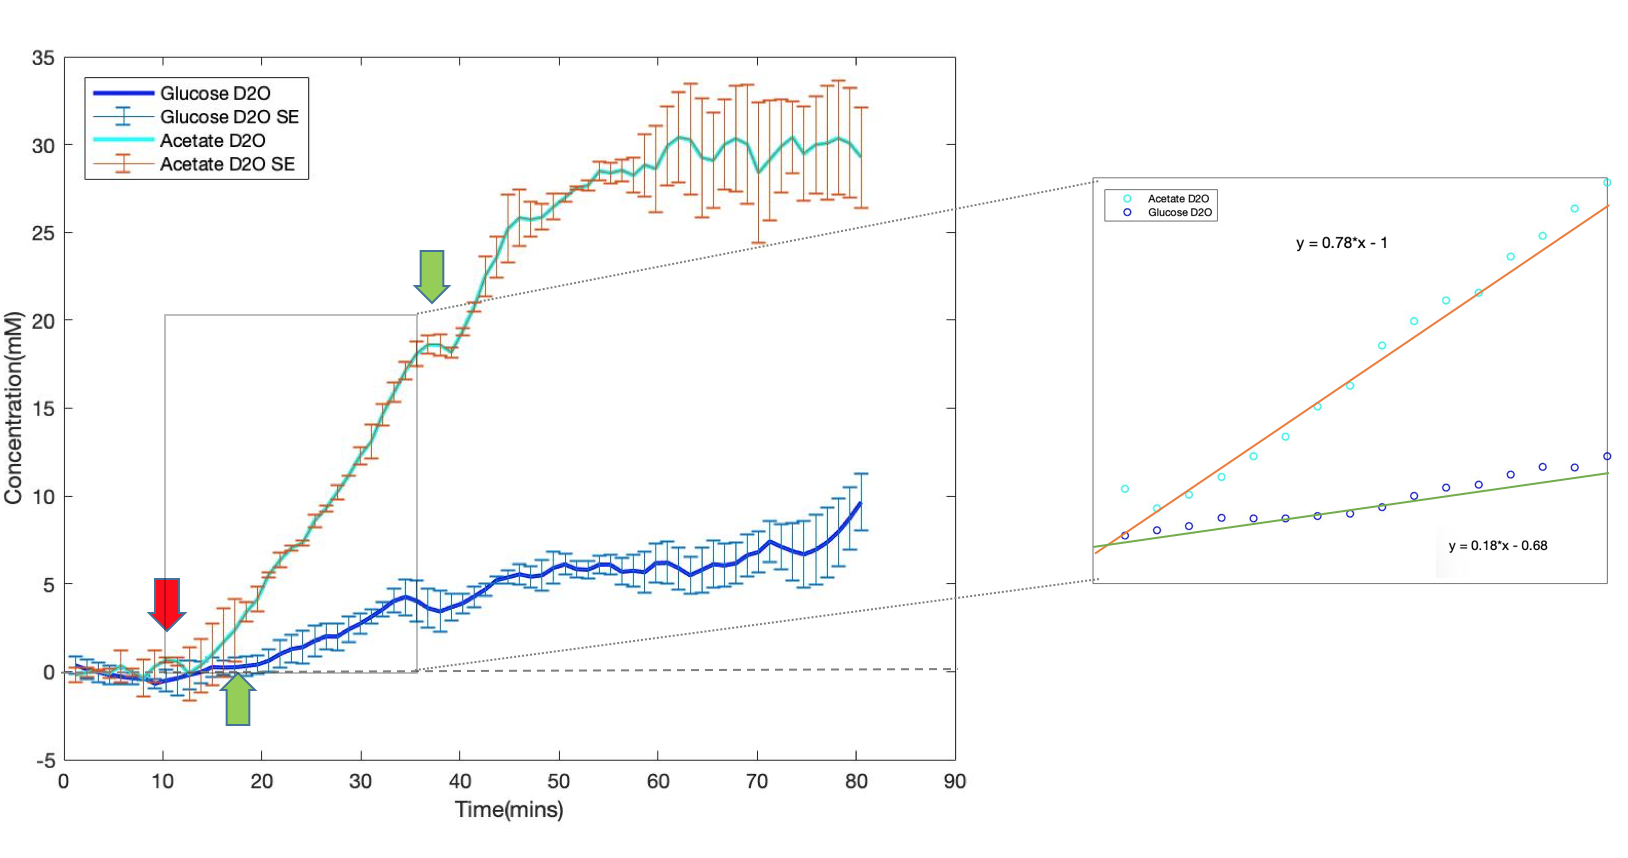
Figure 1 demonstrates the spectral fitting and time courses of the 3D DMRSI voxel located in the rat hearts. In particular, Figs. 1a and 1b show representative 2H spectra of the rat heart under 70 mins continuous high dose (~0.58 g) and 25 mins low dose acetate infusion (~0.25 g); the corresponding metabolites time courses are also displayed in (c) and (d) respectively. Moreover, Figs. 2a and 2b show the representative heart 2H spectral fitting and dynamic change of deuterated metabolites under the glucose infusion condition.Figure 3 displays the representative 2D 2H CSI (from the 3D dataset) overlaid with the anatomical images of the rat heart under both glucose and low dose acetate infusions conditions. The colored maps show the water concentration at different scanning time points. In addition, Fig. 4 compares the grouped time courses of deuterated water with bolus glucose or low does acetate infusion indicating distinct characteristics. Lastly, we determined that the acetate T1 in the phantom and in-vivo heart was approximately 2.2 seconds, which was used to correct the saturation effect in quantifying acetate concentration.
Discussions & Conclusions
The 2H-labeled Glx signal was low in Figs. 1-2 because compared to brain, the rat heart tissue contains a very low levels of natural abundance Glx,4 which may make Glx difficult to be detected in-vivo if SNR is inadequate. Although a convincing Glx signal is shown in Fig. 1a, we found that introducing high dose Acetate-D3 often led to unexpected spectra distortion and signal drop in deuterated metabolites (see Fig. 1c). One possible explanation is that high concentration of acetate might selectively impair fatty acid metabolism in heart tissue, which would negatively influence the physiological performances of the rat heart.5 Nevertheless, as shown in Fig. 3, by comparing the results between glucose and acetate infusion, it is obvious that more deuterated water was produced from acetate infusion. We estimated the D2O production rates in the rat heart from the linear regression slope using data acquired during 10-35mins (see Fig. 4) showing a significantly higher (~3 times after correcting the number of 2H atoms contained in each D-Glucose-6,6-D2 or Acetate-D3 molecule ) D2O concentration increase per minute with acetate infusion. Thus, it is clear that the rat’s myocardial tissue prefers acetate rather than glucose since approximately 60-90% of the energy used by the normal adults’ heart is provided by the mitochondrial oxidation of long-chain fatty acid with the remainder supplied by oxidation of glucose.6,7 This is consistent with in-vivo imaging findings we obtained from the present study. Also, the long T1 value of Acetate-D3 is likely due to the three-deuterium atoms that impede molecular relaxation, thus, it needs to be accounted for when quantifying acetate content.Overall, we demonstrated the feasibility of using a completely non-invasive 3D DMRSI technique to assess cardiac energy metabolism, suggesting its potential for clinical applications. Despite some limitations, e.g., relative poor Glx SNR and long acetate T1, the deuterated water produced from substrate metabolism showed high SNR and large dynamic change, which should be highly valuable for imaging and studying heart energy metabolisms under normal and diseased conditions. To exploit and confirm a clinical possibility of DMRSI technique, further studies and quantification modeling are needed for understanding the relationship between the imaging assessment and cardiac pathophysiology in human patients.
Acknowledgements
This work was supported in part by NIH grants of R01 MH111413, R01 CA240953, S10 RR025031 and P41 EB027061.References
1. “Readmissions-Reduction-Program.” CMS.gov Centers for Medicare & Medicaid Services, 31 July 2019.
2. Lu, Ming, et al. “Quantitative Assessment of Brain Glucose Metabolic Rates Using in Vivo Deuterium Magnetic Resonance Spectroscopy.” Journal of Cerebral Blood Flow & Metabolism, vol. 37, no. 11, 2017, pp. 3518–3530., doi:10.1177/0271678x17706444.
3. Li, H. et al. “Dynamic deuterium MRS imaging for studying rat heart energy metabolism in vivo – initial experience.” in Proc. Intl. ISMRM p. 47, (2019).
4. Lewandowski, E. Douglas, et al.“Multiplet Structure of 13C NMR Signal from Glutamate and Direct Detection of Tricarboxylic Acid (TCA) Cycle Intermediates.” Magnetic Resonance in Medicine, vol. 35, no. 2, 1996, pp. 149–154., doi:10.1002/mrm.1910350203.
5. Jacob, Alexis D., et al. “Effects of Acetate on Energy Metabolism and Function in the Isolated Perfused Rat Heart.” Kidney International, vol. 52, no. 3, 1997, pp. 755–760., doi:10.1038/ki.1997.392.
6. Pascual, Florencia et al. “Fuel Availability and Fate in Cardiac Metabolism: A Tale of Two Substrates.” Biochimica et Biophysica Acta, vol. 1861, 2016, pp. 1425-1433.
7. Stanley, William C. et al. “Myocardial Substrate Metabolism in the Normal and Failing Heart.” Physiol Rew, vol. 85, 2005, pp. 1093-1129.
Figures