2981
Reduced brain sodium and elevated cerebral blood flow in women with lipedema1Radiology, Vanderbilt University Medical Center, Nashville, TN, United States, 2Physical Medicine and Rehabilitation, Vanderbilt University Medical Center, Nashville, TN, United States, 3Biomedical Engineering, Vanderbilt University, Nashville, TN, United States, 4Neurology, Vanderbilt University Medical Center, Nashville, TN, United States, 5Psychiatry, Vanderbilt University Medical Cener, Nashville, TN, United States
Synopsis
Patients with the adipose disorder lipedema exhibit elevated sodium in the extremities, potentially due to blood or lymphatic vasculopathy. Despite evidence of psychological symptoms, these parameters have not been examined in the brain. We utilized multi-nuclear imaging (23Na-MRI) and arterial spin labeling to test whether dysregulation of brain sodium and perfusion is present in women with (n=15) versus without (n=18) lipedema. We observed lower brain sodium (61.3±6.9 vs. 67.9±5.8mmol/L; p=0.03) and higher cerebral blood flow (43.3±7.0 vs. 37.9±6.3ml blood/100mg tissue/min; p=0.03) in lipedema compared to control participants. Results suggest that brain sodium and hemodynamic dysregulation may exist in lipedema patients.
Introduction
Lipedema is a disease of chronic pain and adipose deposition affecting the lower extremities in as many as 11% of women1. Lipedema is frequently misdiagnosed as typical obesity although symptoms are largely refractory to common treatments of diet and exercise, suggesting a different etiology. To develop targeted treatments for lipedema, and better understand its causes, disease biomarkers that can distinguish lipedema pathophysiology from obesity are needed.Recent studies of patients with lipedema report increased sodium in the skin and adipose tissue of the lower extremities2, which is consistent with peripheral inflammatory markers3 and possibly blood and/or lymphatic vasculopathy, including microangiopathy4 and increased capillary fragility1 in the legs. Patients with lipedema also frequently report fatigue accompanied by hyperalgesia of unknown origin5, and prevalent psychological distress6. Given this symptomatology, we hypothesized that cerebral hemodynamic function and brain tissue sodium content (TSC) may also be affected in patients with lipedema. We utilized multi-nuclear neuroimaging in well-characterized patients with lipedema and BMI-matched controls to investigate possible central nervous system involvement. Findings are intended to utilize novel multi-modal imaging tools to expand a growing literature linking adipose disorders to sodium and vascular dysfunction.
Methods
Participant recruitment and characterization. All participants provided written, informed consent in compliance with the Institutional Review Board. Participants with lipedema were evaluated by a certified lymphologist and met all primary criteria (bilateral leg swelling, negative Stemmer’s sign) and at least one secondary criterion according to established clinical guidelines7.MRI. Neuroimaging was performed on a multi-nuclear enabled 3.0T D-stream Philips Ingenia (Philips Healthcare, Best, The Netherlands). Anatomical scanning included high spatial-resolution brain T1-weighted (TR/TE=8.9/4.6ms; resolution=1mm isotropic), T2-weighted fluid-attenuated-inversion-recovery (T2-FLAIR, TR/TE=11000/120ms; resolution=0.57x0.57x5.0mm), and time-of-flight magnetic resonance angiography (MRA, TR/TE=23/3.4ms; spatial resolution=0.39x0.39x0.70mm).
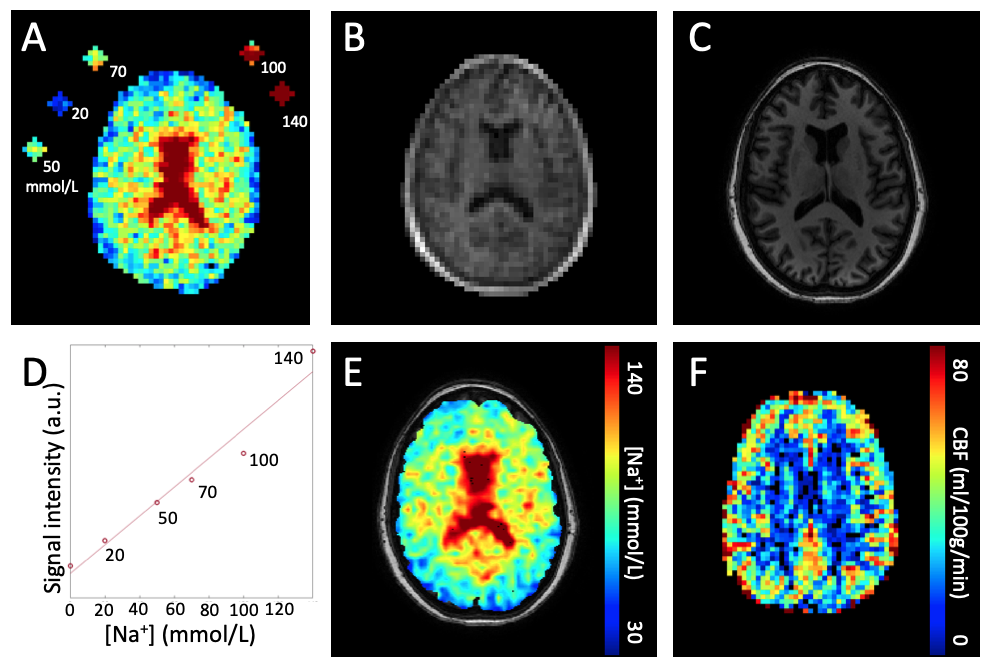
Sodium imaging was performed using a single-tuned quadrature coil for 23Na sodium nuclei (33.8MHz birdcage volume coil, Rapid Biomedical GmbH, Rimpar, Germany, Fig. 1A-E). Sodium MRI employed an ultrashort echo time (UTE) technique with a radial readout (TR/TE=50/0.16ms; spatial resolution=3.75mm isotropic; in-plane field-of-view [FOV]=240x240mm). To calibrate TSC, standard solutions containing 20, 50, 70, 100, and 140mmol/L NaCl were included in the FOV. Quantitative perfusion mapping was obtained using pseudo-continuous ASL (pCASL, TR/TE=4133/14ms; spatial resolution=3.4x3.4x8.0mm, labeling duration=1.6s, post-labeling delay=1.9s, echo-planar readout, Fig. 1F). Cerebral blood flow (CBF) was quantified using the simplified model from the ISMRM perfusion study group8.
Statistical analysis and hypothesis testing. T1-weighted images were segmented into gray matter (GM), white matter (WM), and cerebrospinal fluid (CSF) using FSL-FAST and sub-cortical regions using FSL-FIRST9. TSC values were compared between controls and participants with lipedema in three compartments (GM, WM, ventricular CSF). CBF values were compared in GM.
The primary statistical objective was to evaluate the hypothesis that brain TSC and CBF differ between lipedema and control participants. To determine whether any observed differences were related to brain size or structure, the volume of GM, WM, and CSF regions, and major subcortical structures, were also compared between groups. T2-FLAIR and MRA were examined for white matter lesions and large-vessel obstructions. Student’s t-tests were applied to evaluate differences (significance: two-sided p≤0.05).
Results
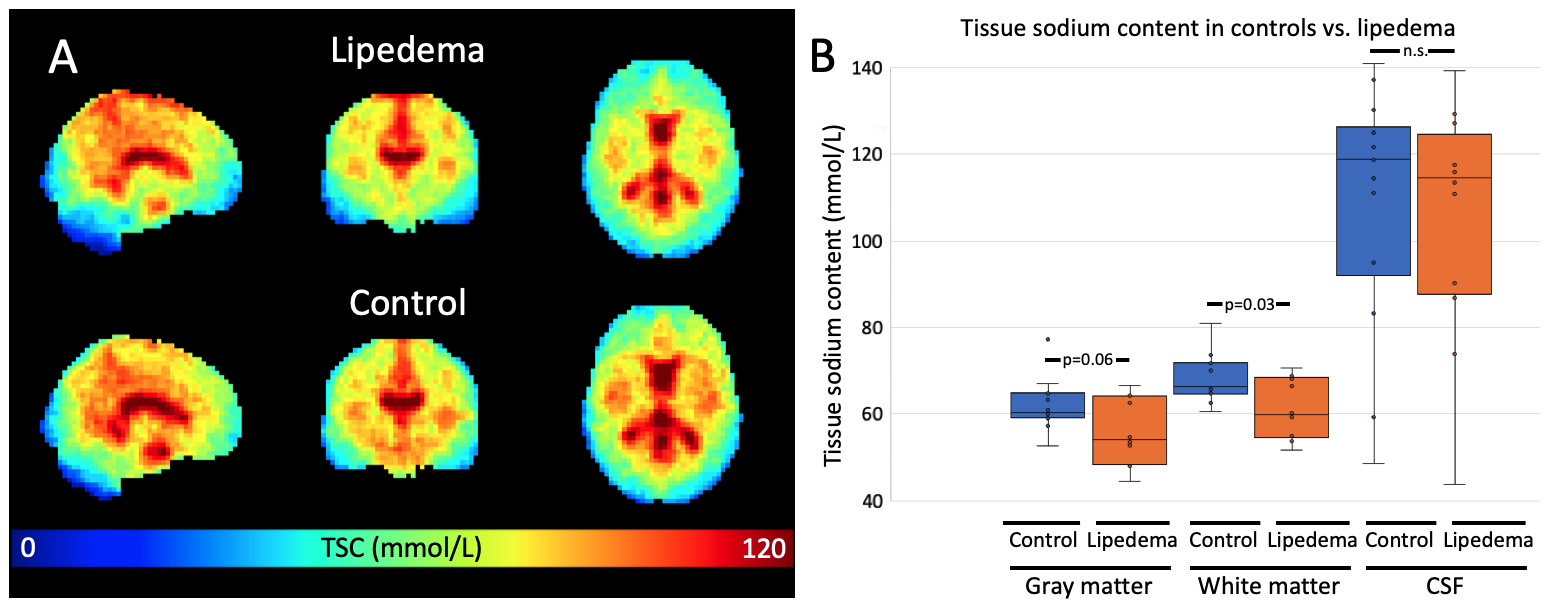
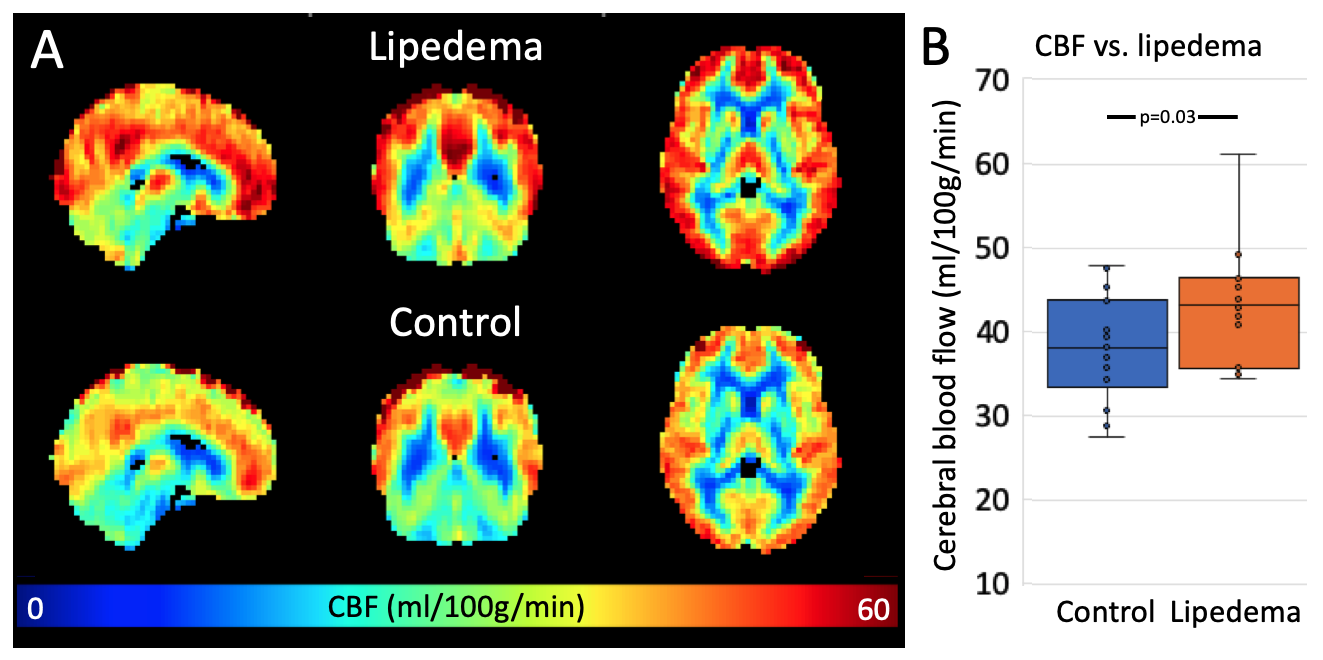
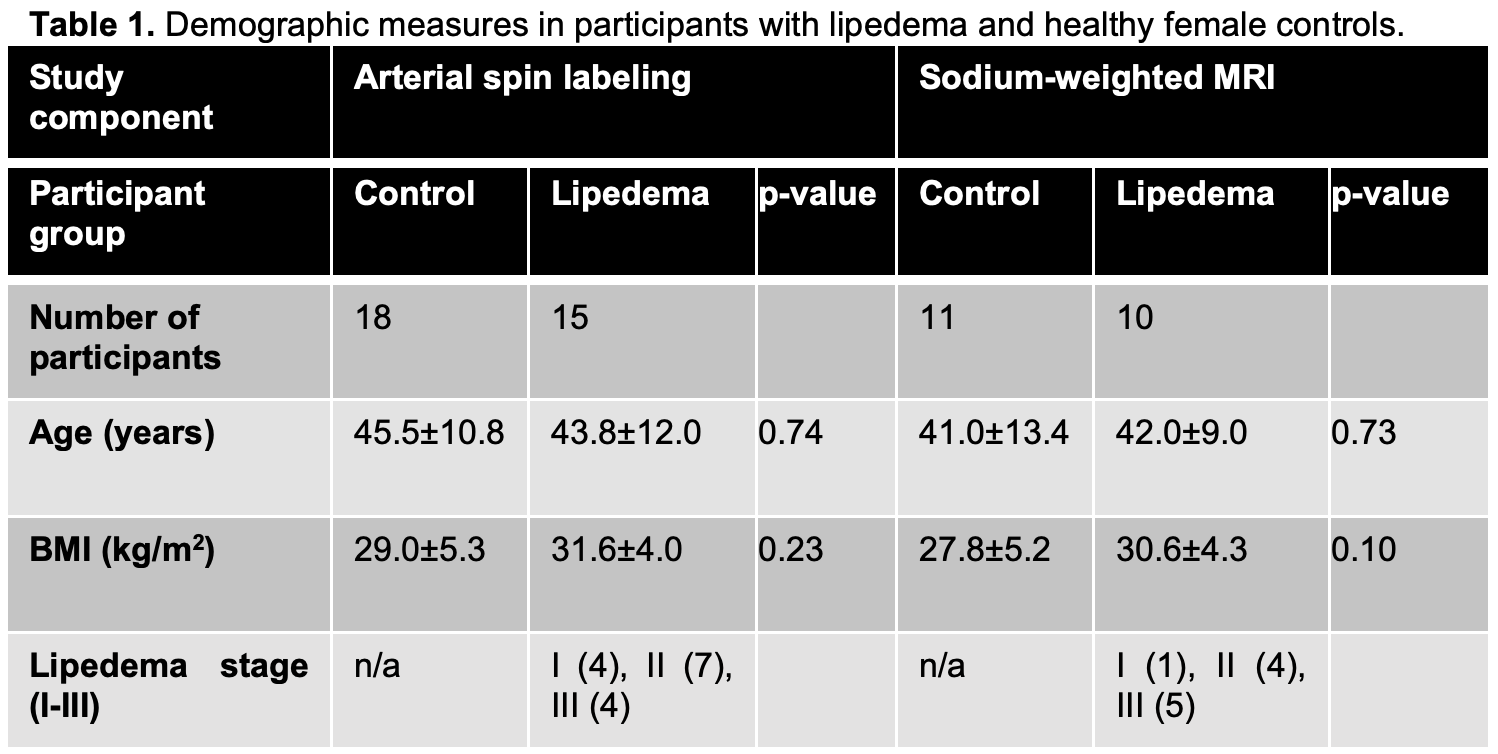
pCASL was obtained in 18 controls and 15 participants with lipedema. Brain sodium imaging was acquired in 11 controls and 10 participants with lipedema. Both groups were statistically matched for age and BMI (Table 1). WM TSC was significantly lower in lipedema than controls (61.3±6.9 vs. 67.9±5.8mmol/L; p=0.03). In GM, a trend for lower TSC in lipedema was observed (55.9±7.9 vs. 62.0±6.3mmol/L; p=0.06, Fig. 2). CBF in GM was significantly higher in participants with lipedema (43.3±7.0 vs. 37.9±6.3ml blood/100 mg tissue/min; p=0.03, Fig. 3). GM, WM, and CSF volume, normalized to total brain size, were not significantly different between groups (p=0.55, 0.38, 0.45, respectively), nor were subcortical structure volumes. Examination of T2-FLAIR and MRA images did not reveal evidence of atypical ischemic WM lesions or flow-limiting vasculopathy.Discussion
We provide the first evidence of neuroimaging irregularities in patients with lipedema, an adipose disorder known to involve peripheral sodium and fat clearance dysfunction, chronic pain, and psychosocial distress. We measured significantly decreased TSC in WM and increased CBF in GM.Sodium neuroimaging findings extend a previously described phenotype of elevated sodium in lower extremities affected by lipedema2, suggesting the possibility of a gravity-dependent gradient in sodium biodistribution. This observation may relate to lymphatic abnormalities that manifest in the legs with lipedema but which have not been investigated in the CNS. Sodium exchange at the blood-CSF barrier may also be affected10, as is reported in other diseases of chronic pain11,12.
While the mechanism of elevated CBF in lipedema remains unknown, altered perfusion indicates small vessel cerebrovascular dysfunction in the absence of large vessel vasculopathy. Multi-nuclear neuroimaging findings merit further investigation into the association between circulation and tissue sodium in a whole-body manner.
Conclusion
In this multi-nuclear neuroimaging MRI study, we detail the first evidence of differences in brain sodium content and cerebral blood flow in women with lipedema compared to BMI-matched controls. These findings could relate to vascular clearance physiology, and may help to further investigate systemic mechanisms of disease.Acknowledgements
We are grateful to the Vanderbilt University Institute of Imaging Science technical staff and to all study participants. Funding: Lipedema Foundation collaborative grant #12 and postdoctoral fellowship, NIH 1R01NR015079, 1S10OD021771-01 and T32 EB001628, and NCATS CTSA 5UL1TR002243-03.References
1 Herbst, K. L. Rare adipose disorders (RADs) masquerading as obesity. Acta Pharmacol Sin 33, 155-172 (2012).
2 Crescenzi, R. et al. Tissue Sodium Content is Elevated in the Skin and Subcutaneous Adipose Tissue in Women with Lipedema. Obesity (Silver Spring) 26, 310-317 (2018).
3 Al-Ghadban, S. et al. Dilated Blood and Lymphatic Microvessels, Angiogenesis, Increased Macrophages, and Adipocyte Hypertrophy in Lipedema Thigh Skin and Fat Tissue. J Obes (2019).
4 Foldi, E. a. F. M. Lipedema. Foldi's Textbook of Lymphology, Elsevier GmbH, Munich, Germany, 417-427 (2006).
5 Child, A. H. et al. Lipedema: an inherited condition. Am J Med Genet A 152A, 970-976 (2010).
6 Dudek, J. E., Bialaszek, W., Ostaszewski, P. & Smidt, T. Depression and appearance-related distress in functioning with lipedema. Psychol Health Med 23, 846-8531 (2018).
7 Langendoen, S. I., Habbema, L., Nijsten, T. E. & Neumann, H. A. Lipoedema: from clinical presentation to therapy. A review of the literature. Br J Dermatol 161, 980-986 (2009).
8 Alsop, D. C. et al. Recommended implementation of arterial spin-labeled perfusion MRI for clinical applications: A consensus of the ISMRM perfusion study group and the European consortium for ASL in dementia. Magn Reson Med 73, 102-116 (2015).
9 Patenaude, B., Smith, S. M., Kennedy, D. N. & Jenkinson, M. A Bayesian model of shape and appearance for subcortical brain segmentation. Neuroimage 56, 907-922 (2011).
10 Amin, M. S., Reza, E., Wang, H. & Leenen, F. H. Sodium transport in the choroid plexus and salt-sensitive hypertension. Hypertension 54, 860-867 (2009).
11 Ghaffari H, G. S., Petzold LR, Harrington MG. Regulation of cerebrospinal fluid and brain tissue sodium levels by choroid plexus and brain capillary endothelial cell Na+, K+-ATPases during migraine. bioRxiv 572727. (2019).
12 Abad, N., Rosenberg, J. T., Hike, D. C., Harrington, M. G. & Grant, S. C. Dynamic sodium imaging at ultra-high field reveals progression in a preclinical migraine model. Pain 159, 2058-2065 (2018).
Figures