2980
Configuration Space Imaging of 23Na at 3T1Department of Biomedical Engineering, University of Basel, Basel, Switzerland, 2Department of Radiology, University Hospital Basel, Basel, Switzerland
Synopsis
Configuration space is explored for sodium MRI with bSSFP in phantoms and for the brain of a healthy volunteer. To this end, a set of eight phase-cycled bSSFP scans are recorded and from the lowest order configuration modes, quantitative T1, T2 and sodium concentration maps are heuristically derived using the framework valid for spin-1/2 particles.
Introduction
Sodium MRI proves challenging due to the ~10000 times weaker signal strength compared to proton imaging. For translation, however, not only the development of signal efficient methods is crucial, but also biexponential transverse relaxation, resulting from the spin-3/2 characteristics of the 23Na nucleus, needs to be taken into account. While the fast component plays no role in fluids due to rapid molecular movement, it is the dominating process in tissue making up approximately 60% of the T2 decay. Currently, the gold standard for sodium MRI is the use of twisted projection imaging (TPI)(1). The major downside of this method are the extremely long dead times within TR intervals (TR $$$\approx$$$ 160ms) to ensure complete T1 recovery for quantification of tissue sodium concentration (TSC). In contrast, balanced steady-state free precession (bSSFP) imaging is performed with much shorter TR and offers the highest signal-to-noise ratio (SNR) among fast imaging methods(2). This, in principle, makes bSSFP the perfect candidate for sodium MRI. Furthermore, Kharrazian et. al.(3) found out in the context of bSSFP that the spin-3/2 system of 23Na can be treated as a spin-1/2 system in some limits, such as long TR and small flip angles. In this work the feasibility of quantitative sodium imaging with classical bSSFP theory is explored.Methods
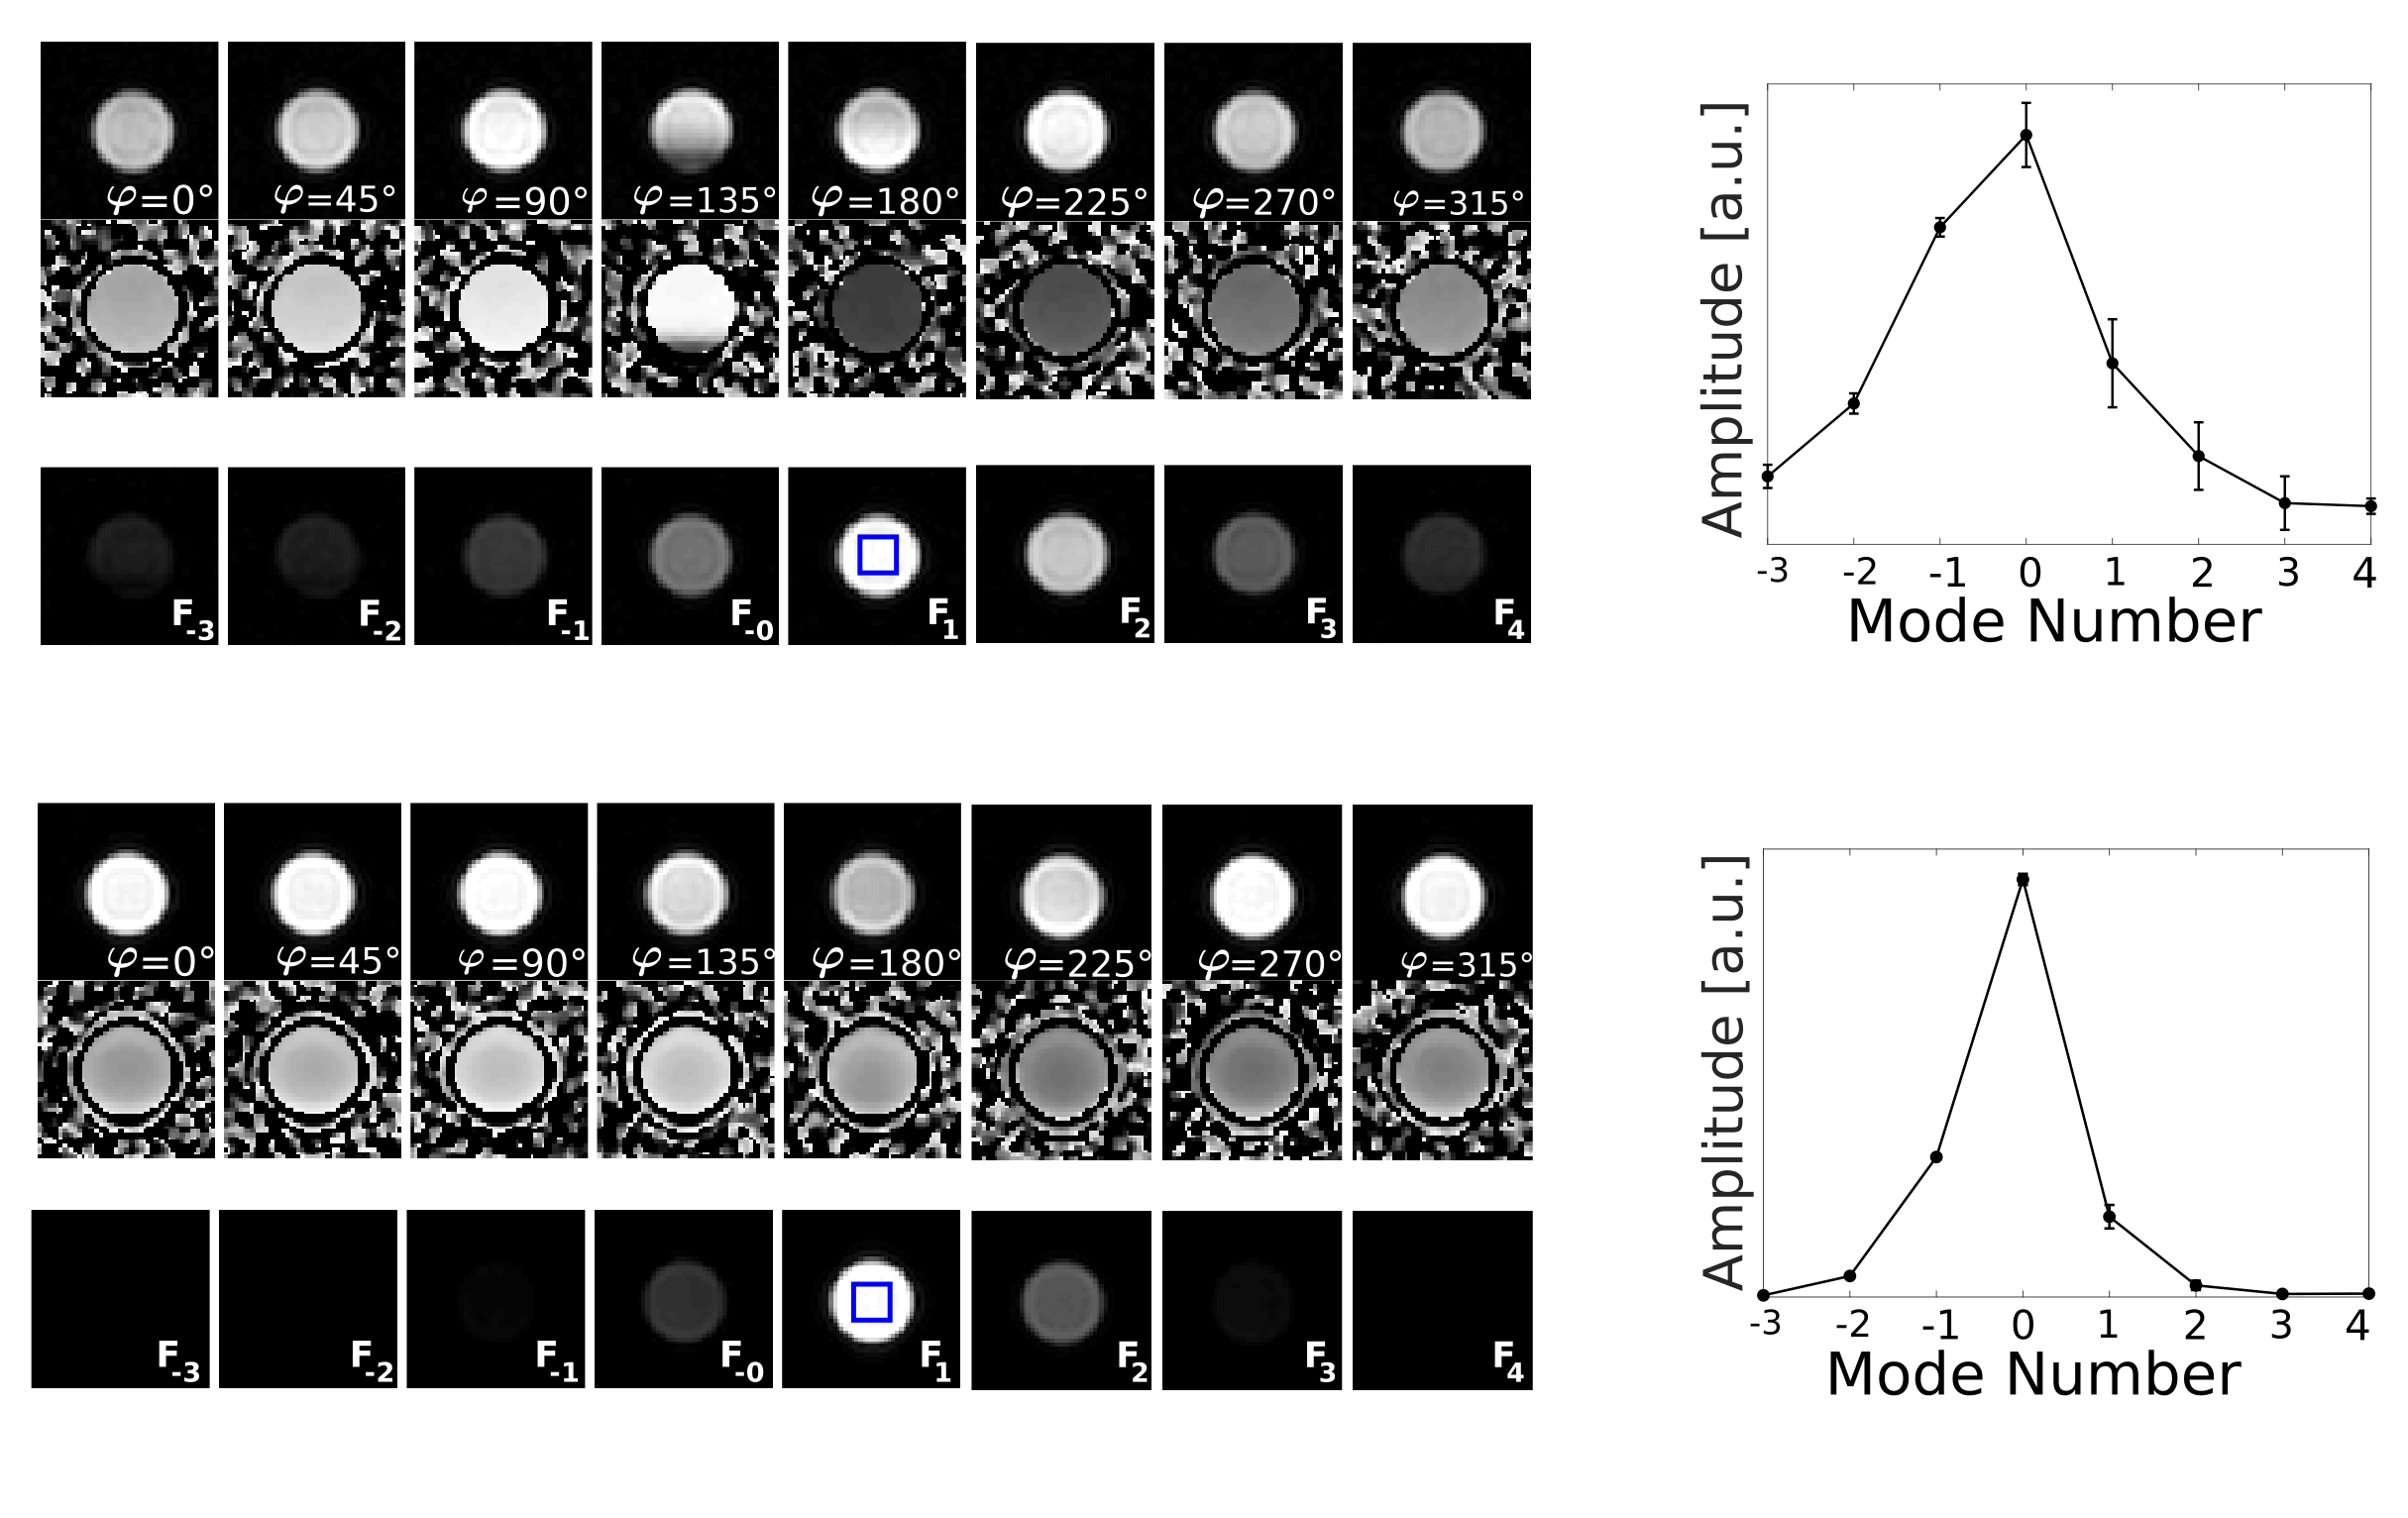
Configuration-based bSSFP: One of the major issues of proton-based bSSFP are off-resonances leading to prominent signal modulations. Evidentially, also with sodium, bSSFP shows a periodic frequency response. This, in good approximation, can be approached by the Freeman-Hill equation for spin-1/2 particles(4)(5). Generally, due to the periodic modulation with the phase θ, accumulated within any TR-period, the sodium magnetization can be expressed in the configuration space that can be explored by the acquisition of multiple phase-cycled bSSFP scans and a subsequent N-point Fourier transform(6). Heuristically, considering the modes to follow the theoretical framework developed for protons for a pure spin-1/2 ensemble (i.e., mono-exponential decay), this can be used to compute longitudinal (T1) and transverse (T2) relaxation times(7), as well as the relative TSC from the zeroth-order mode, using(8)$$\mathrm{SSFP}_{\mathrm{FID}} = \tan\left(\frac{\alpha}{2}\right) \left(1- \frac{(E_1 - \cos\alpha)\left(1-E_2^2\right)}{\sqrt{p^2-q^2}}\right) \tag{1}$$
where
$$E_i = \exp(-\mathrm{TR}/T_i) \hspace{1cm}\mbox{for } i=1,2$$
$$p = 1-E_1\cos\alpha - E_2^2(E_1 - \cos\alpha)$$
$$q = E_2(1-E_1)(1 + \cos\alpha)$$
MRI: Sodium MRI was performed on two highly concentrated (4mol/l with and without 4% agar) sodium phantoms(5) and in the brain of a healthy volunteer. For transmission and reception a dual-tuned 1H/23Na birdcage coil was used. For TSC estimation, the birdcage coil sensitivity was assumed to be constant. The RF reference amplitude was estimated by maximizing the free induction decay. Subsequently, a set with N = 8 phase-cycled 3D isotropic bSSFP scans were acquired with RF phase increments of {0, 45, 90, 135, 180, 225, 270, 315}°, using TR = 5ms, TE = 2.5ms, flip angle α = {30, 40, 50}° for the phantoms, α = 40° for the brain, isotropic resolution: 8mm. For the phantoms a total of 24 averages per measurement were used, yielding 2:55 minutes per bSSFP scan and 23:20 minutes in total. For the brain imaging 60 averages were used, yielding 7:15 minutes per scan, resulting in a total scan time of 58 minutes.
Results/Discussion
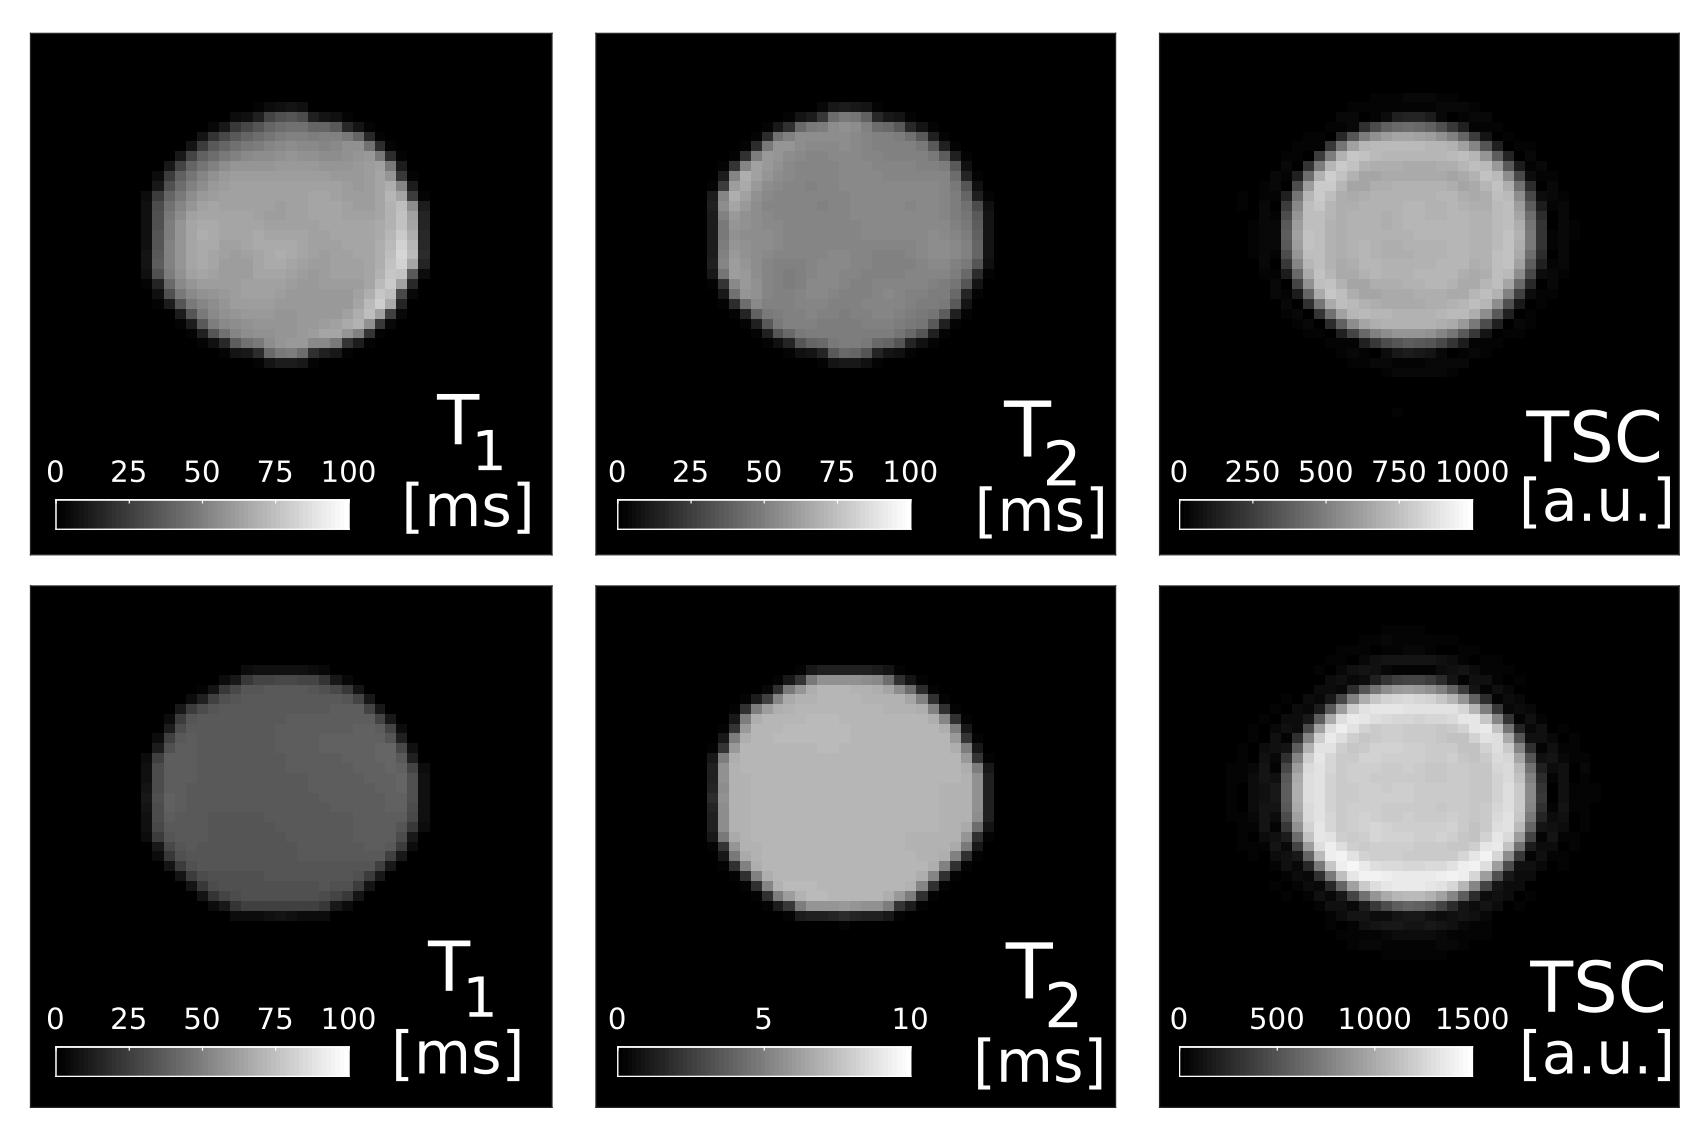
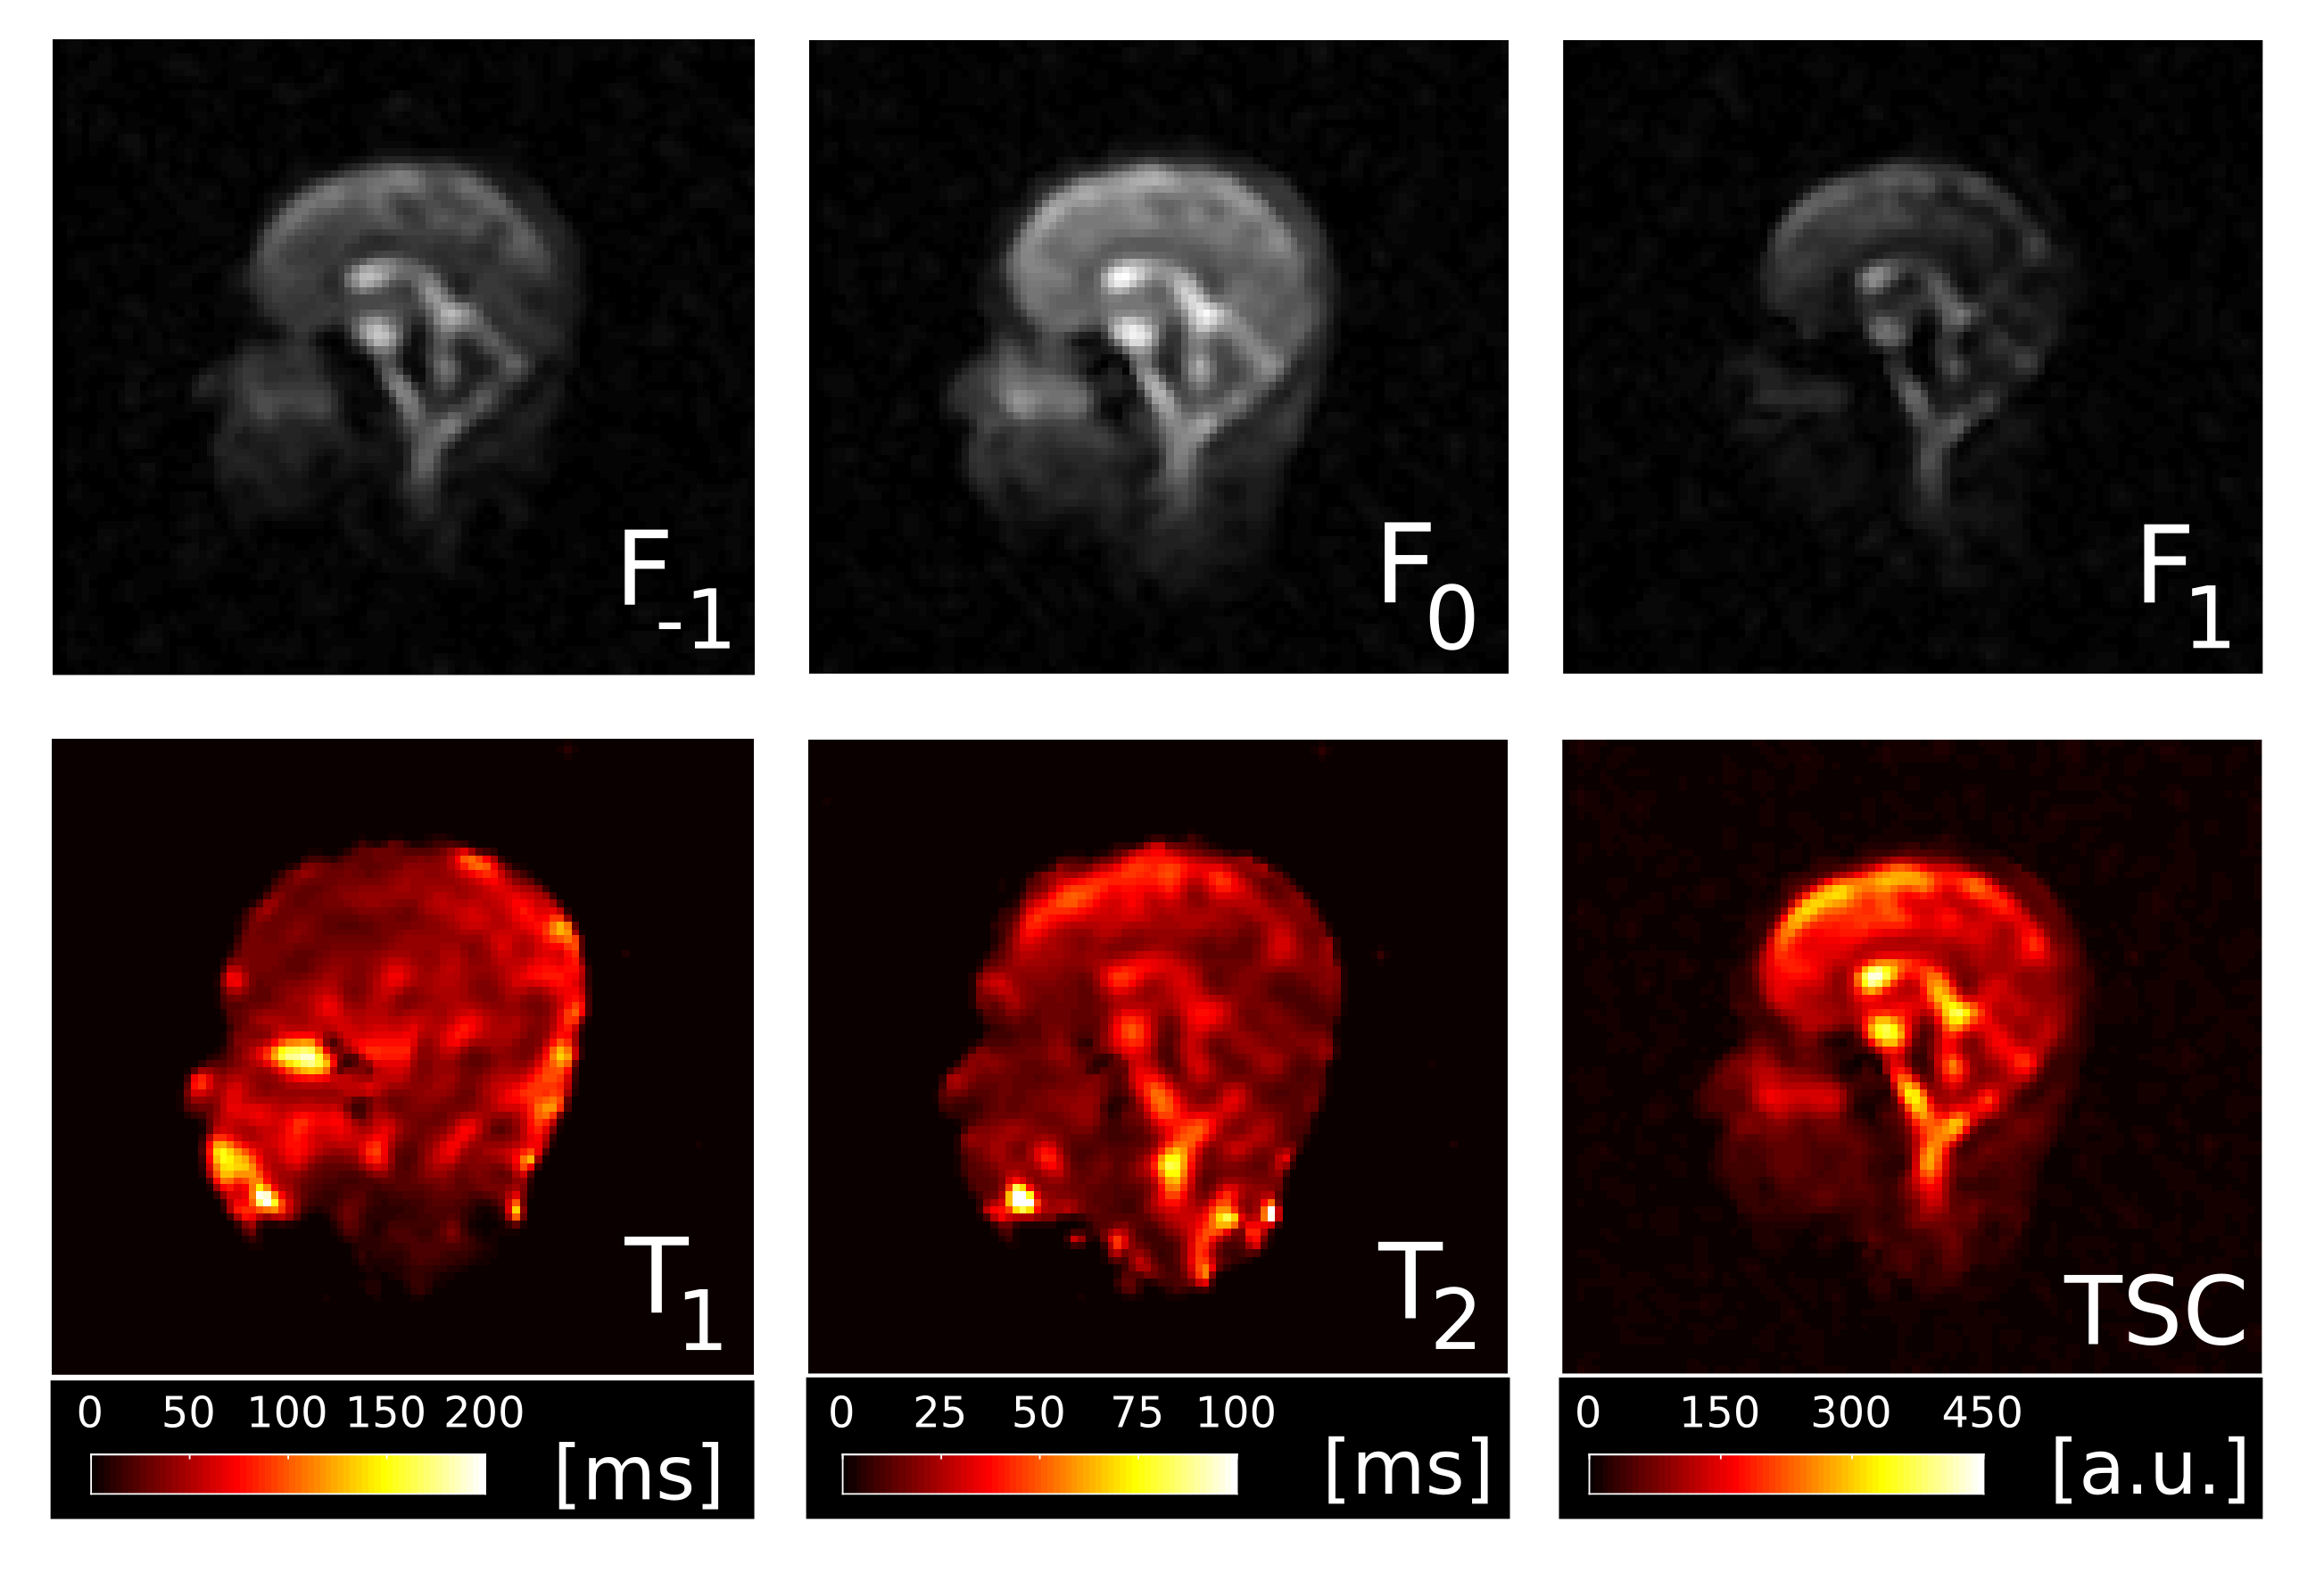
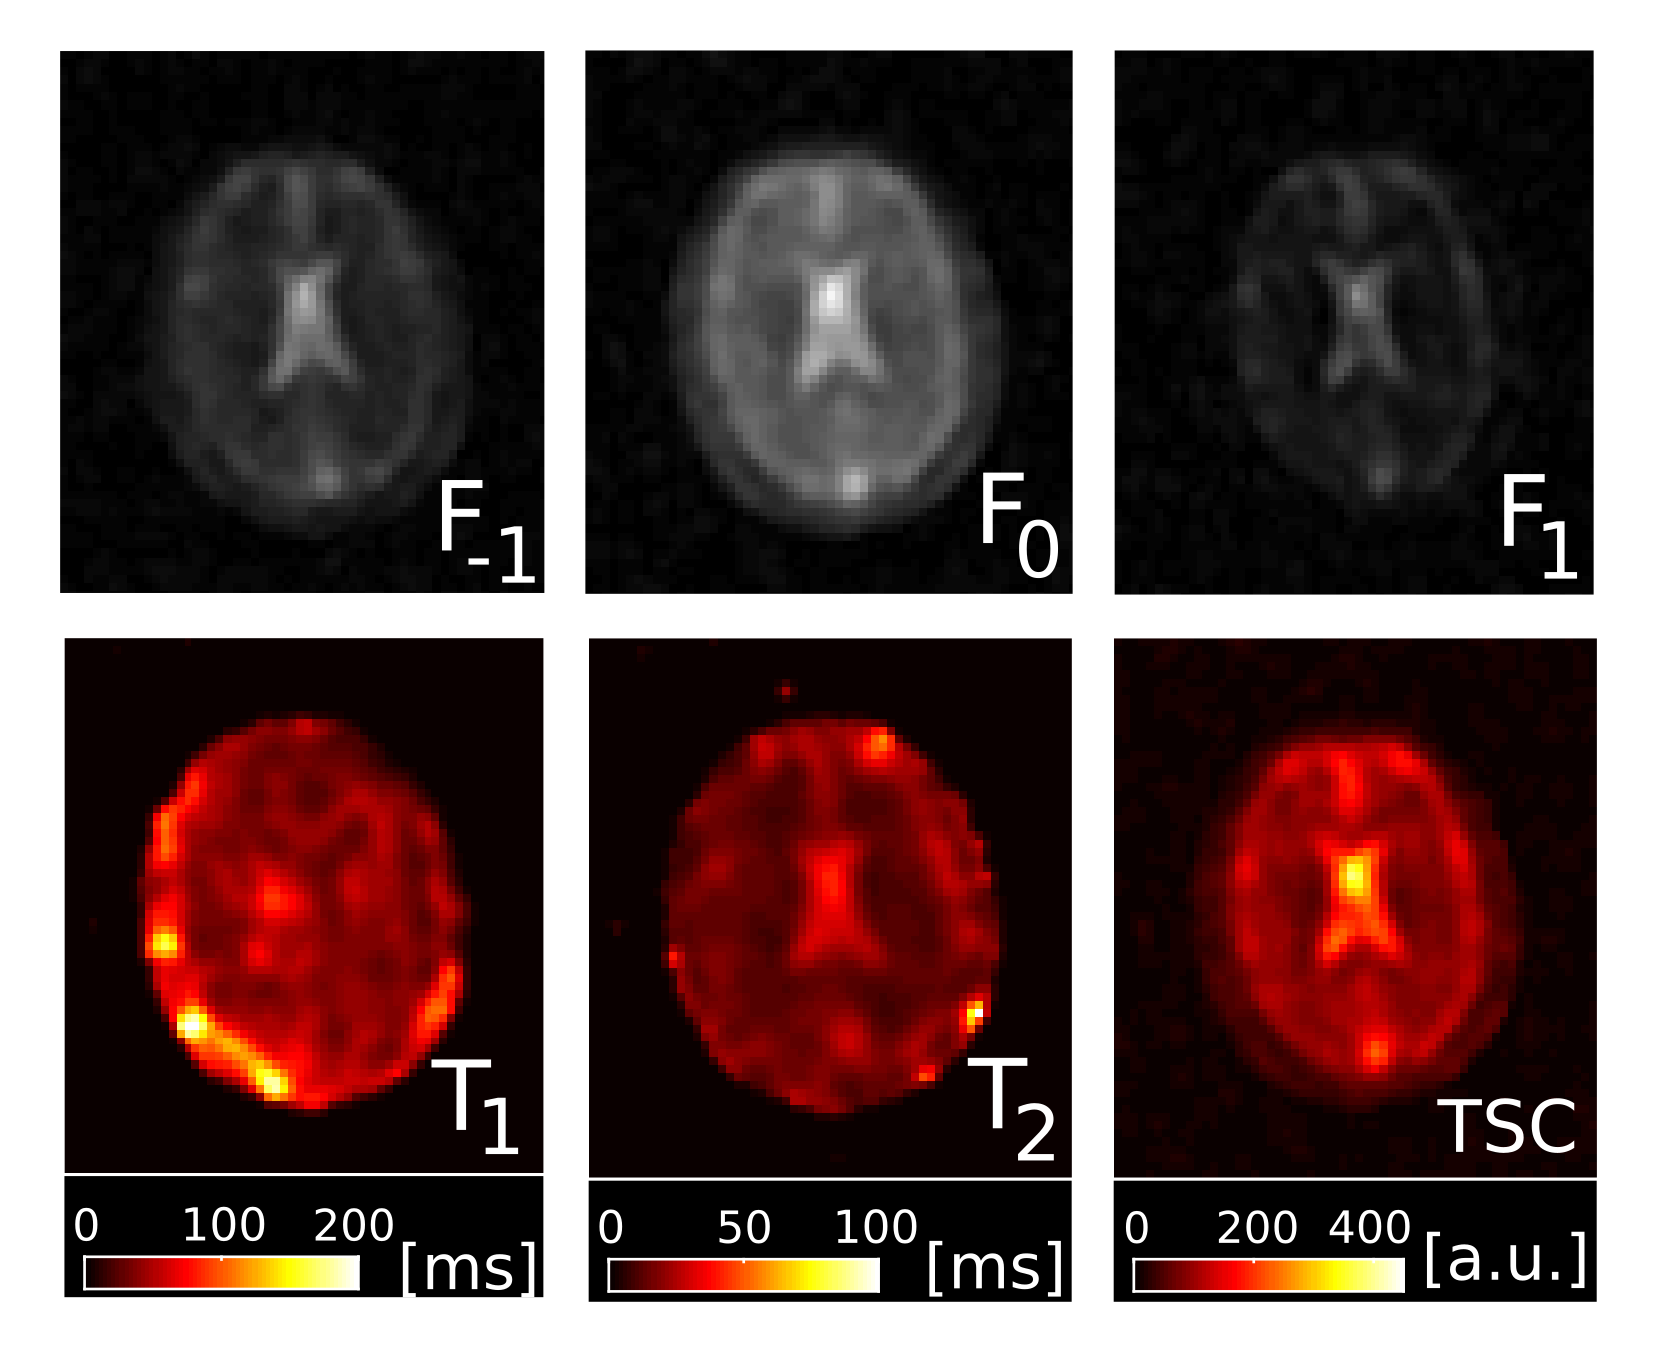
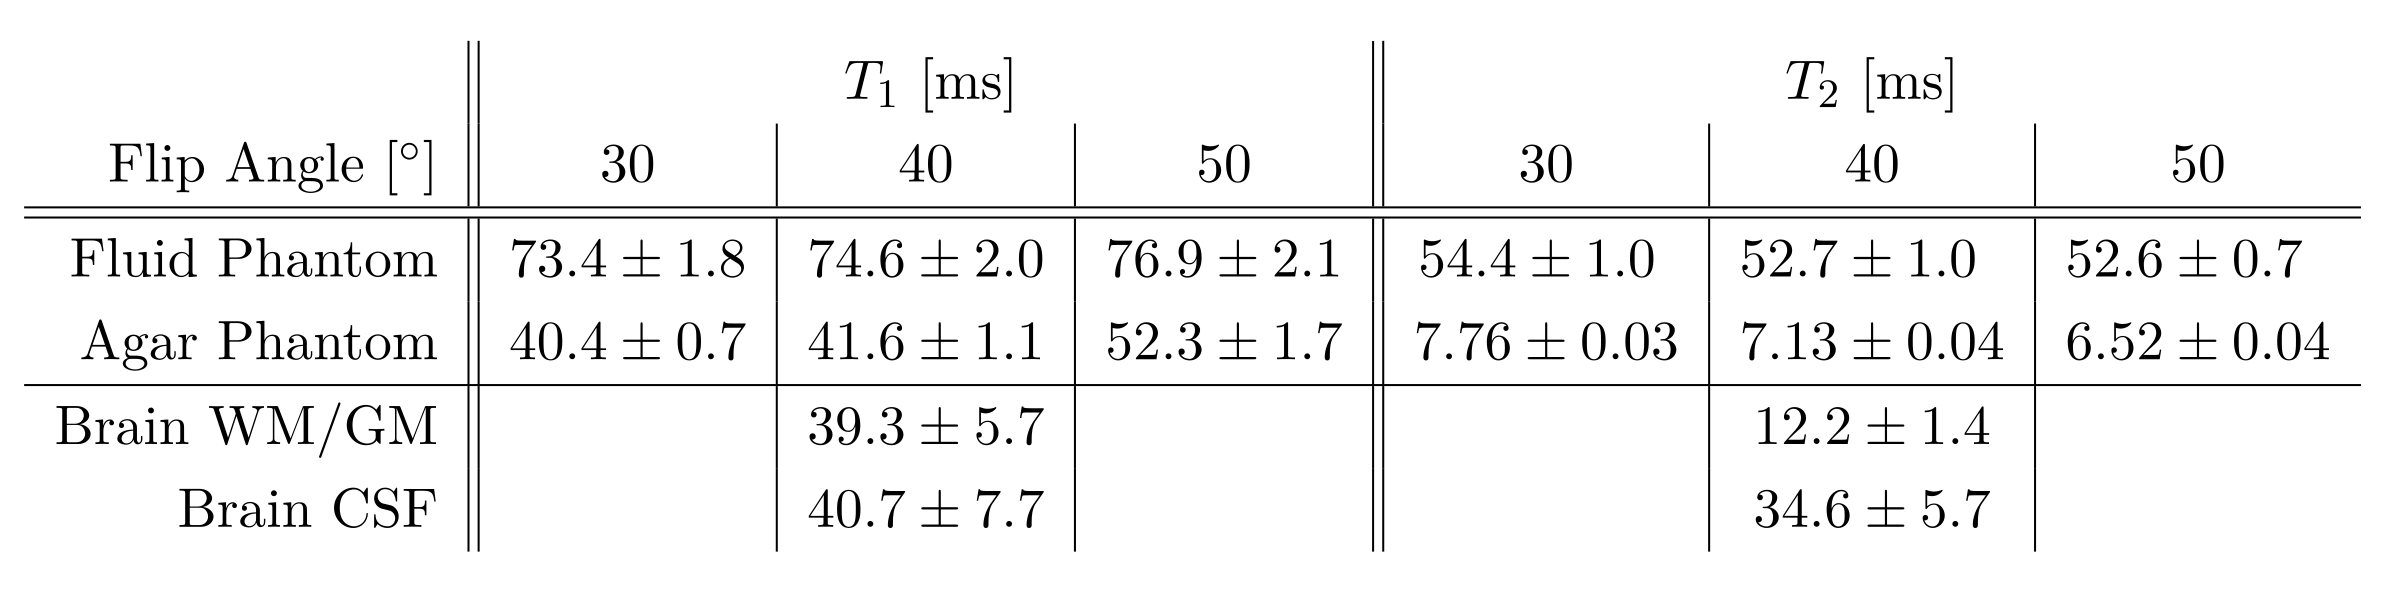
Fig.1 shows magnitude and phase data of a representative coronal slice of both fluid and agar phantoms for all eight phase cycles as well as their computed modes Fp. From the three most dominant modes F-1, F0 and F1, T1 and T2 maps were heuristically computed together with the relative TSC according to equation (1) (Fig.2). As expected, the T1 and T2 values are of the same order for the fluid but markedly different in agar due to spin-3/2 effects. Notably, a slight dependency of the relaxation times on the flip angle α was observed in agar.In analogy, F-1, F0 and F1, as well as maps for T1, T2 and the relative TSC are shown for the brain scan in Figs. 3 & 4. Mean T1 and T2 values for the phantom as well as gray matter/white matter (GM/WM) and cerebral spinal fluid (CSF) are summarized in Tab. 1. Overall, T1 values for brain tissue and CSF agree with expectations(9)(10). T2 values appear predominantly lower than the literature values(10) in tissues and fluids. For tissues, this is most likely due to the fast T2 decaying component that can not be resolved, whereas for CSF, partial volume effects might affect T2 estimates. While the absolute TSC can not be computed in this experiment, the calculated ratio of 3.1$$$\pm$$$0.9 between WM/GM tissue and CSF is in accordance with the literature (11).
Conclusion
The presented heuristic treatment of 23Na using a spin-1/2 based configuration analysis for subsequent quantification yields results that are in agreement with literature. Further investigations, however, are required to corroborate and validate our findings.Acknowledgements
This work was supported by the Swiss National Science Foundation (SNF grant No. 325230_182008).References
1. Lu, A, Atkinson IC, Claiborne TC et.al. Quantitative sodium imaging with a flexible twisted projection pulse sequence. Magn Reson in Med, 63(6): 1583-1593, 2010
2. Scheffler K, Lehnhardt S. Principles and applications of balanced SSFP techniques. European Radiology, 13(11): 2409-2418, 2003
3. Kharrazian R, Jakob PM. Dynamics of 23Na during completely balanced steady-state free precession. Journal of Magnetic Resonance, 179(1): 73-84, 2006
4. Freeman, R., & Hill, H. D. W. (1971). Phase and intensity anomalies in Fourier transform NMR. Journal of Magnetic Resonance (1969), 4(3), 366-383.
5. Heule R, Madörin P, Bieri O. Exploring sodium SSFP MRI in phantoms at 3T, Proc. ISMRM 2016, p. 1837
6. Zur Y, Wood ML, Neuringer LJ. Motion-insensitive, steady-state free precession imaging. Magn Reson Med, 16(3):444-459, 1990
7. Heule R, Ganter C, Bieri O. Triple echo steady-state (TESS) relaxometry. Magn Reson Med, 71(1):230-237, 2014.
8. Bernstein MA, King KF, Zhou XJ. Handbook of MRI pulse sequences. Elsevier, 2004
9. Coste A, Boumezbeur F, Vignaud A at.al. (2019). Tissue sodium concentration and sodium T1 mapping of the human brain at 3 T using a Variable Flip Angle method. Magnetic resonance imaging, 58, 116-124.
10. Shah NJ, Worthoff WA and Langen KJ. Imaging of sodium in the brain: a brief review. NMR in Biomedicine, 29(2): 162-174, 2016
11. Romanzetti S, Mirkes CC, Fiege DP et. al. Mapping tissue sodium concentration in the human brain: a comparison of MR sequences at 9.4 Tesla. NeuroImage, 96: 44-53, 2014
Figures