2979
Intracellular sodium changes in cancer cells using a microcavity array-based bioreactor and sodium triple-quantum signal
Dennis Kleimaier1, Victor Schepkin2, Cordula Nies3, Eric Gottwald3, and Lothar R. Schad1
1Computer Assisted Clinical Medicine, Heidelberg University, Mannheim, Germany, 2National High Magnetic Field Laboratory, Florida State University, Tallahassee, FL, United States, 3Institute of Functional Interfaces, Karlsruhe Institut of Technology, Karlsruhe, Germany
1Computer Assisted Clinical Medicine, Heidelberg University, Mannheim, Germany, 2National High Magnetic Field Laboratory, Florida State University, Tallahassee, FL, United States, 3Institute of Functional Interfaces, Karlsruhe Institut of Technology, Karlsruhe, Germany
Synopsis
This study demonstrates the possibility of a microcavity array-based bioreactor to investigate intracellular sodium changes using sodium TQ signal. The response of HepG2 cells during 60min Na+/K+-ATPase inhibition by 1mM ouabain or K+-free medium was monitored. An improved TQTPPI sequence with almost four times TQ SNR increase allowed achieving cell sensitivity of 14*106. During cell experiments, the TQ signal increased to 128.9±3.9% and 165.0±7.4% for 1mM ouabain and K+-free medium, respectively. After reperfusion, the TQ signal recovered to 129.5±4.5%. This bioreactor design with improved TQ signal detection provides the capability to investigate a variety of cells using sodium TQ signal.
Introduction
A sodium triple-quantum(TQ) signal is created when sodium ions interact with negatively charged groups of macromolecules, mainly proteins. An increased sodium TQ signal was observed during different Na+/K+-ATPase inhibitions, which increased the intracellular sodium concentration, in isolated rat hearts1. A linear correlation of the TQ signal with the intracellular sodium concentration is an attractive feature to quantify cellular responses1. An MRI-compatible microcavity array-based bioreactor can be used to study different mammalian cells2. Such cell experiments allow a large flexibility with cell interventions and combined with MR is a promising tool for anti-cancer drug development.In this study, we modified the TQ time proportional phase incrementation(TQTPPI) sequence3,4. This modification allowed us to achieve several times gain in TQ signal sensitivity while preserving the simultaneous measurement of the TQ and single-quantum(SQ) signal at distinct frequency offsets. In a second step, the capability of the sodium TQ signal to monitor intracellular sodium changes during Na+/K+-ATPase inhibition of HepG2 cells was evaluated.
Material and Methods
Data was acquired at a 9.4T preclinical MRI(Bruker Biospec 94/20, Ettlingen, Germany). A 1H/23Na/39K Bruker volume coil was used for the phantom measurements, while a 23Na in-house built surface coil was used for the bioreactor experiments.Hepatocellular carcinoma cells(HepG2) cultivated three-dimensionally within two microcavity arrays(MCAs) were actively perfused(400 μl/min) under normoxic conditions at 37°C inside a bioreactor system2(Fig.1). HepG2 cells(ATCC HB-8065, USA, Manassas) were prepared according to2,5,6.
The TQTPPI sequence was modified so that phase α was still incremented while the evolution time was optimized and fixed throughout the experiment(Fig.2). This approach increases the TQ SNR as the TQ signal is always measured at its maximum value when τevo=τopt. In comparison to TQ filtration, the fixed TQTPPI still separates the different coherences at different frequency offsets. The sensitivity gain of the fixed TQTPPI sequence(TR=300ms, 720 phase steps) in comparison to the standard TQTPPI sequence(TR=300ms, 720 time steps) was evaluated in three phantoms with [2, 4, 6]% agarose in 134.75mM NaCl. The standard TQTPPI FID was fitted according to4 and the sodium TQ and SQ signal amplitude were corrected to the fixed evolution time according to their fit function. The fixed TQTPPI FID was fitted by:
$$Y(t) = A_{SQ} sin(α+θ_1) + A_{TQ} sin(3α+θ_2) + DC$$
Where Y(t) is the FID amplitude; ASQ and ATQ are the sodium TQ and SQ amplitude; θi are phase offsets and DC is a baseline offset.
In cell experiments, the fixed TQTPPI sequence(TR=250ms, 420 phase steps, TA=4min) was used for sodium TQ measurements. To evaluate the TQ signal origin, the TQ signal from collagen on two MCAs in medium was compared to HepG2 cells on two collagenized MCAs in medium. In a second step, the Na+/K+-ATPase was blocked in two 3D cultures with 16*106 and 14*106 HepG2 cells for 60min using either 1mM ouabain or a K+-free medium. The sodium TQ signal was monitored for 50 min before intervention and 190min after reperfusion with normal medium. The time course of ATQ/ASQ was normalized to the first 50min. The K+-free medium consisted of 1.8mM CaCl2, 0.8mM MgSO4, 26.2mM NaHCO3, 117.2mM NaCl, 1.0mM NaH2PO4-H2O and 5.6mM glucose. The TQ signal of cells in K+-free medium was corrected by the background TQ signal since the K+-free medium did not contain proteins.
Results and Discussion
In the standard TQTPPI spectrum the different coherences can be described by Lorentzian functions4(Fig3a), while in the fixed TQTPPI spectrum the coherences are close to delta functions(Fig.3b). The evaluation of both sequences in [2, 4, 6]% agarose phantoms yielded the same values within the 95% confidence intervals for ATQ, ASQ and ATQ/ASQ(Fig.3c). However, for the fixed TQTPPI sequence, a measured TQ SNR gain of 3-4 was even higher than expected(Fig.3c). This higher SNR gain resulted from fewer fitting parameters for the fixed TQTPPI FID fit compared to the standard TQTPPI FID fit.The measurement of two MCAs in medium resulted in a small TQ signal ATQ/ASQ=0.4±0.6‰(Fig.4). The TQ signal from 14*106 HepG2 cells on two MCAs in medium increased to ATQ/ASQ=1.2±0.7‰(Fig.4).
Blocking the Na+/K+-ATPase by 1mM ouabain for 60min led to an increase of the TQ signal to 128.9±3.9% of the pre-intervention level(Fig.5a). Reperfusion with normal medium did not reduce the TQ signal, but a further TQ signal increase was observed. This continuation of sodium influx into the cells is indication of irreversible cell damage during ouabain perfusion.
Perfusion of cells for 60min with a K+-free medium produces a specific Na+/K+-ATPase inhibition which corresponds to a maximum TQ signal increase of 165.0±7.4%(Fig.5b). After reperfusion, the TQ signal recovered to 129.5±4.5%. This recovery indicated that cells remain viable and partly preserve Na+/K+-ATPase pump activity.
Our results correlate with earlier experiments in isolated rat hearts1 where an increase of the TQ signal was observed by 190±9% and ~265% for 30min of 1mM ouabain and 60min of K+-free medium, respectively. The TQ signal increases in our study were lower, which may indicate a higher intracellular sodium concentration in cancer cells.
Conclusion
Changes in the intracellular sodium of cancer cells in a microcavity array-based bioreactor were successfully detected by sodium TQ signal. This bioreactor design with the improved TQ signal detection provides a capability to investigate a variety of cells using sodium TQ signal.Acknowledgements
One of the authors (Schepkin, V.D.) would like to acknowledge the support from the National Science Foundation through NSF/DMR-1644779 and State of Florida.References
- Schepkin VD, Choy IO, Budinger TF, et al. Sodium TQF NMR and intracellular sodium in isolated crystalloid perfused rat heart. Magnetic resonance in medicine. 1998;39(4):557-563.
- Gottwald E, Kleintschek T, Giselbrecht S, et al. Characterization of a chip-based bioreactor for three-dimensional cell cultivation via Magnetic Resonance Imaging. Zeitschrift fur medizinische Physik. 2013;23(2):102-110.
- Hoesl MAU, Kleimaier D, Hu R, et al. (23) Na Triple-quantum signal of in vitro human liver cells, liposomes, and nanoparticles: Cell viability assessment vs. separation of intra- and extracellular signal. Journal of magnetic resonance imaging : JMRI. 2019;50(2):435-444.
- Schepkin VD, Neubauer A, Nagel AM, Budinger TF. Comparison of potassium and sodium binding in vivo and in agarose samples using TQTPPI pulse sequence. Journal of magnetic resonance. 2017;277:162-168.
- Altmann B, Giselbrecht S, Weibezahn KF, Welle A, Gottwald E. The three-dimensional cultivation of the carcinoma cell line HepG2 in a perfused chip system leads to a more differentiated phenotype of the cells compared to monolayer culture. Biomedical materials. 2008;3(3):034120.
- Gottwald E, Giselbrecht S, Augspurger C, et al. A chip-based platform for the in vitro generation of tissues in three-dimensional organization. Lab on a chip. 2007;7(6):777-785.
Figures
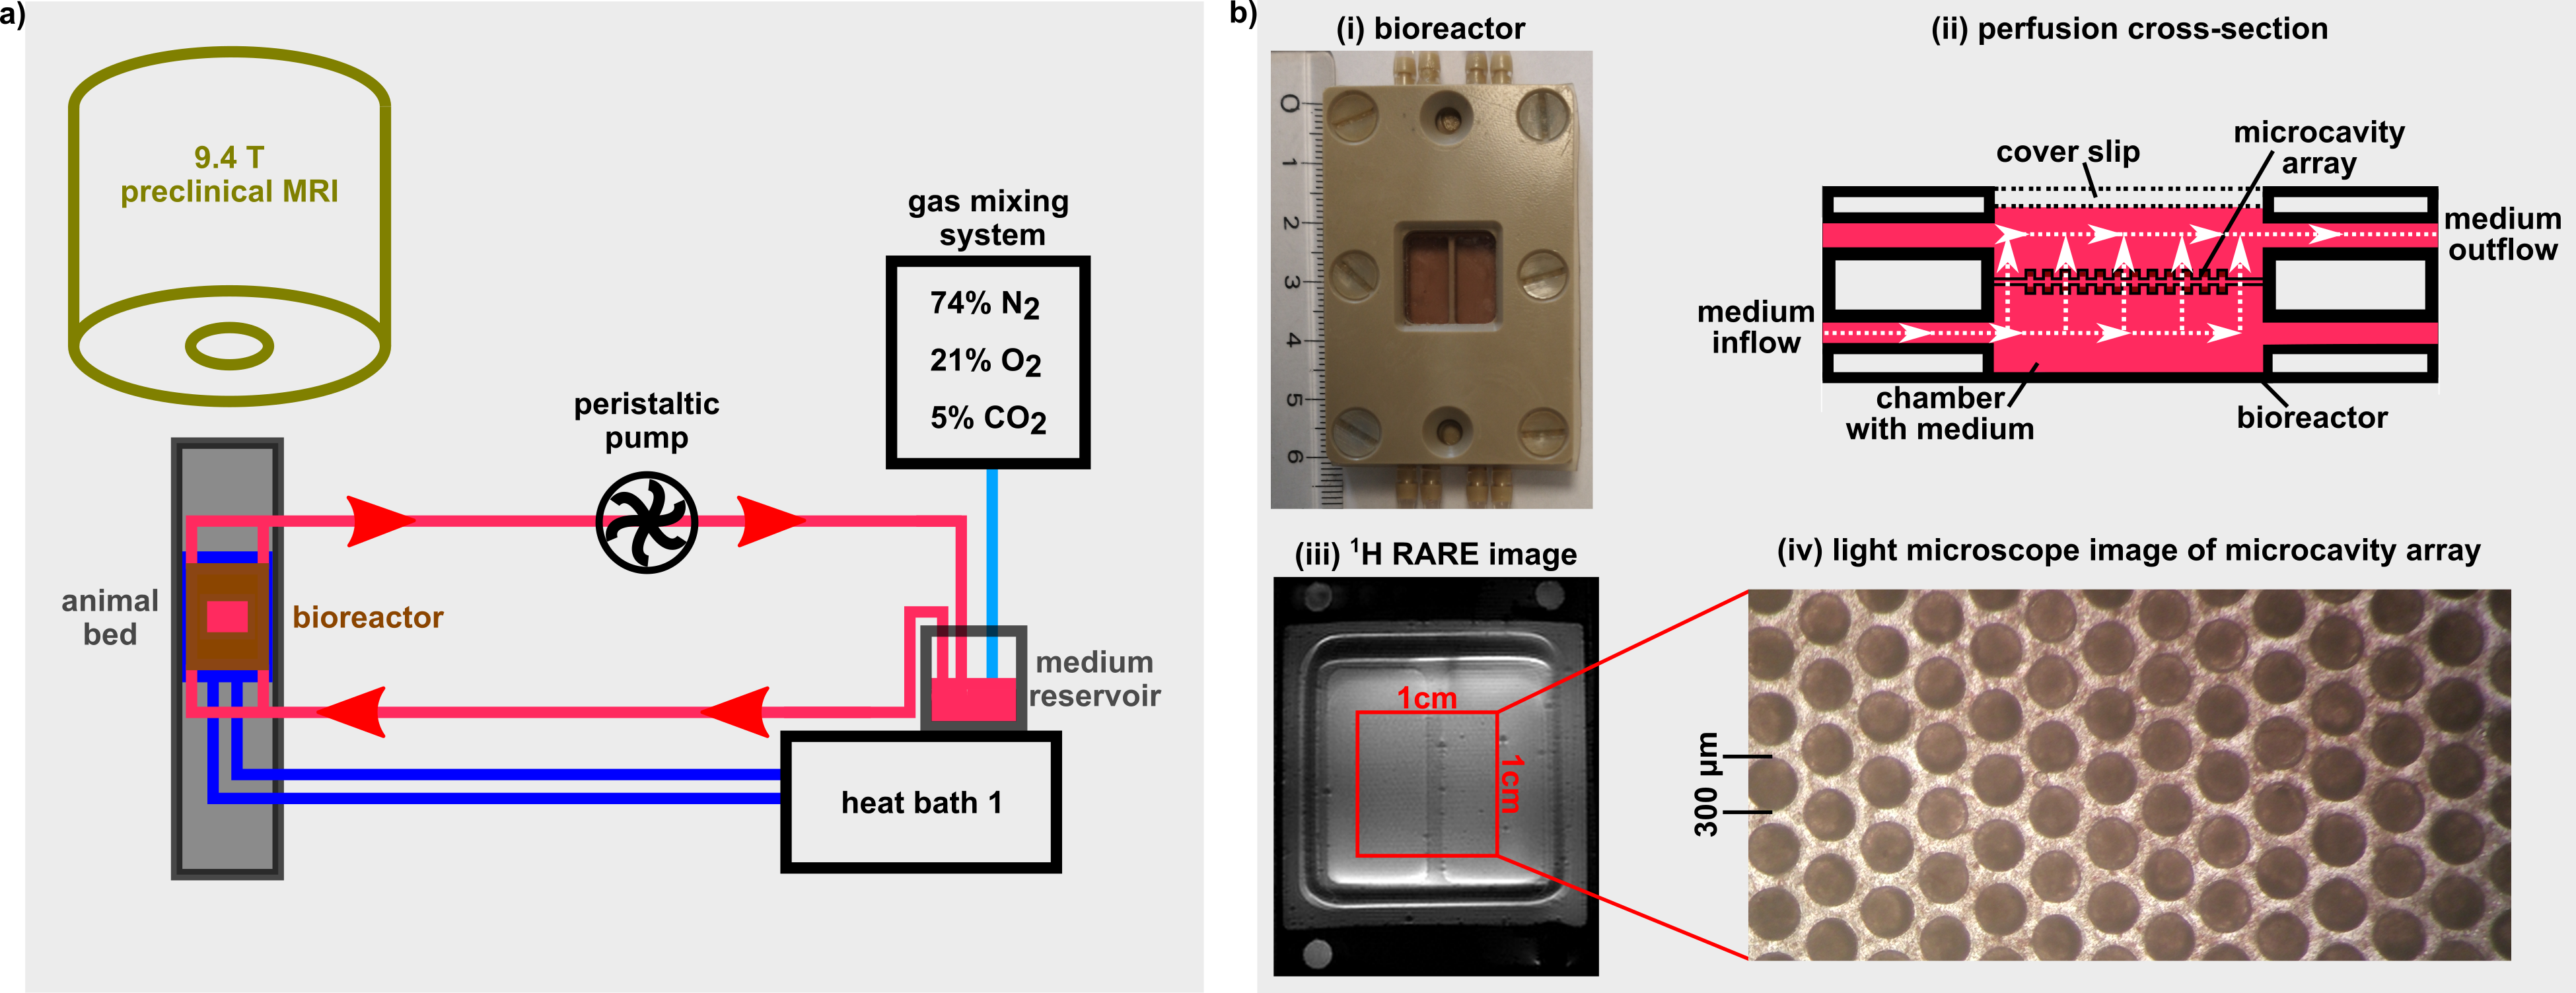
Fig.1: a) The bioreactor setup
consisted of a peristaltic pump, a gas mixing station and a heated water bath. b) i)
The microcavity arrays are placed inside the bioreactor housing. ii) The medium
flow inside the bioreactor is indicated by white arrows. iii) 1H
high-resolution RARE image of bioreactor. iv) Light microscope image of the
microcavity array. The cavity structure of the microcavity array is visible.
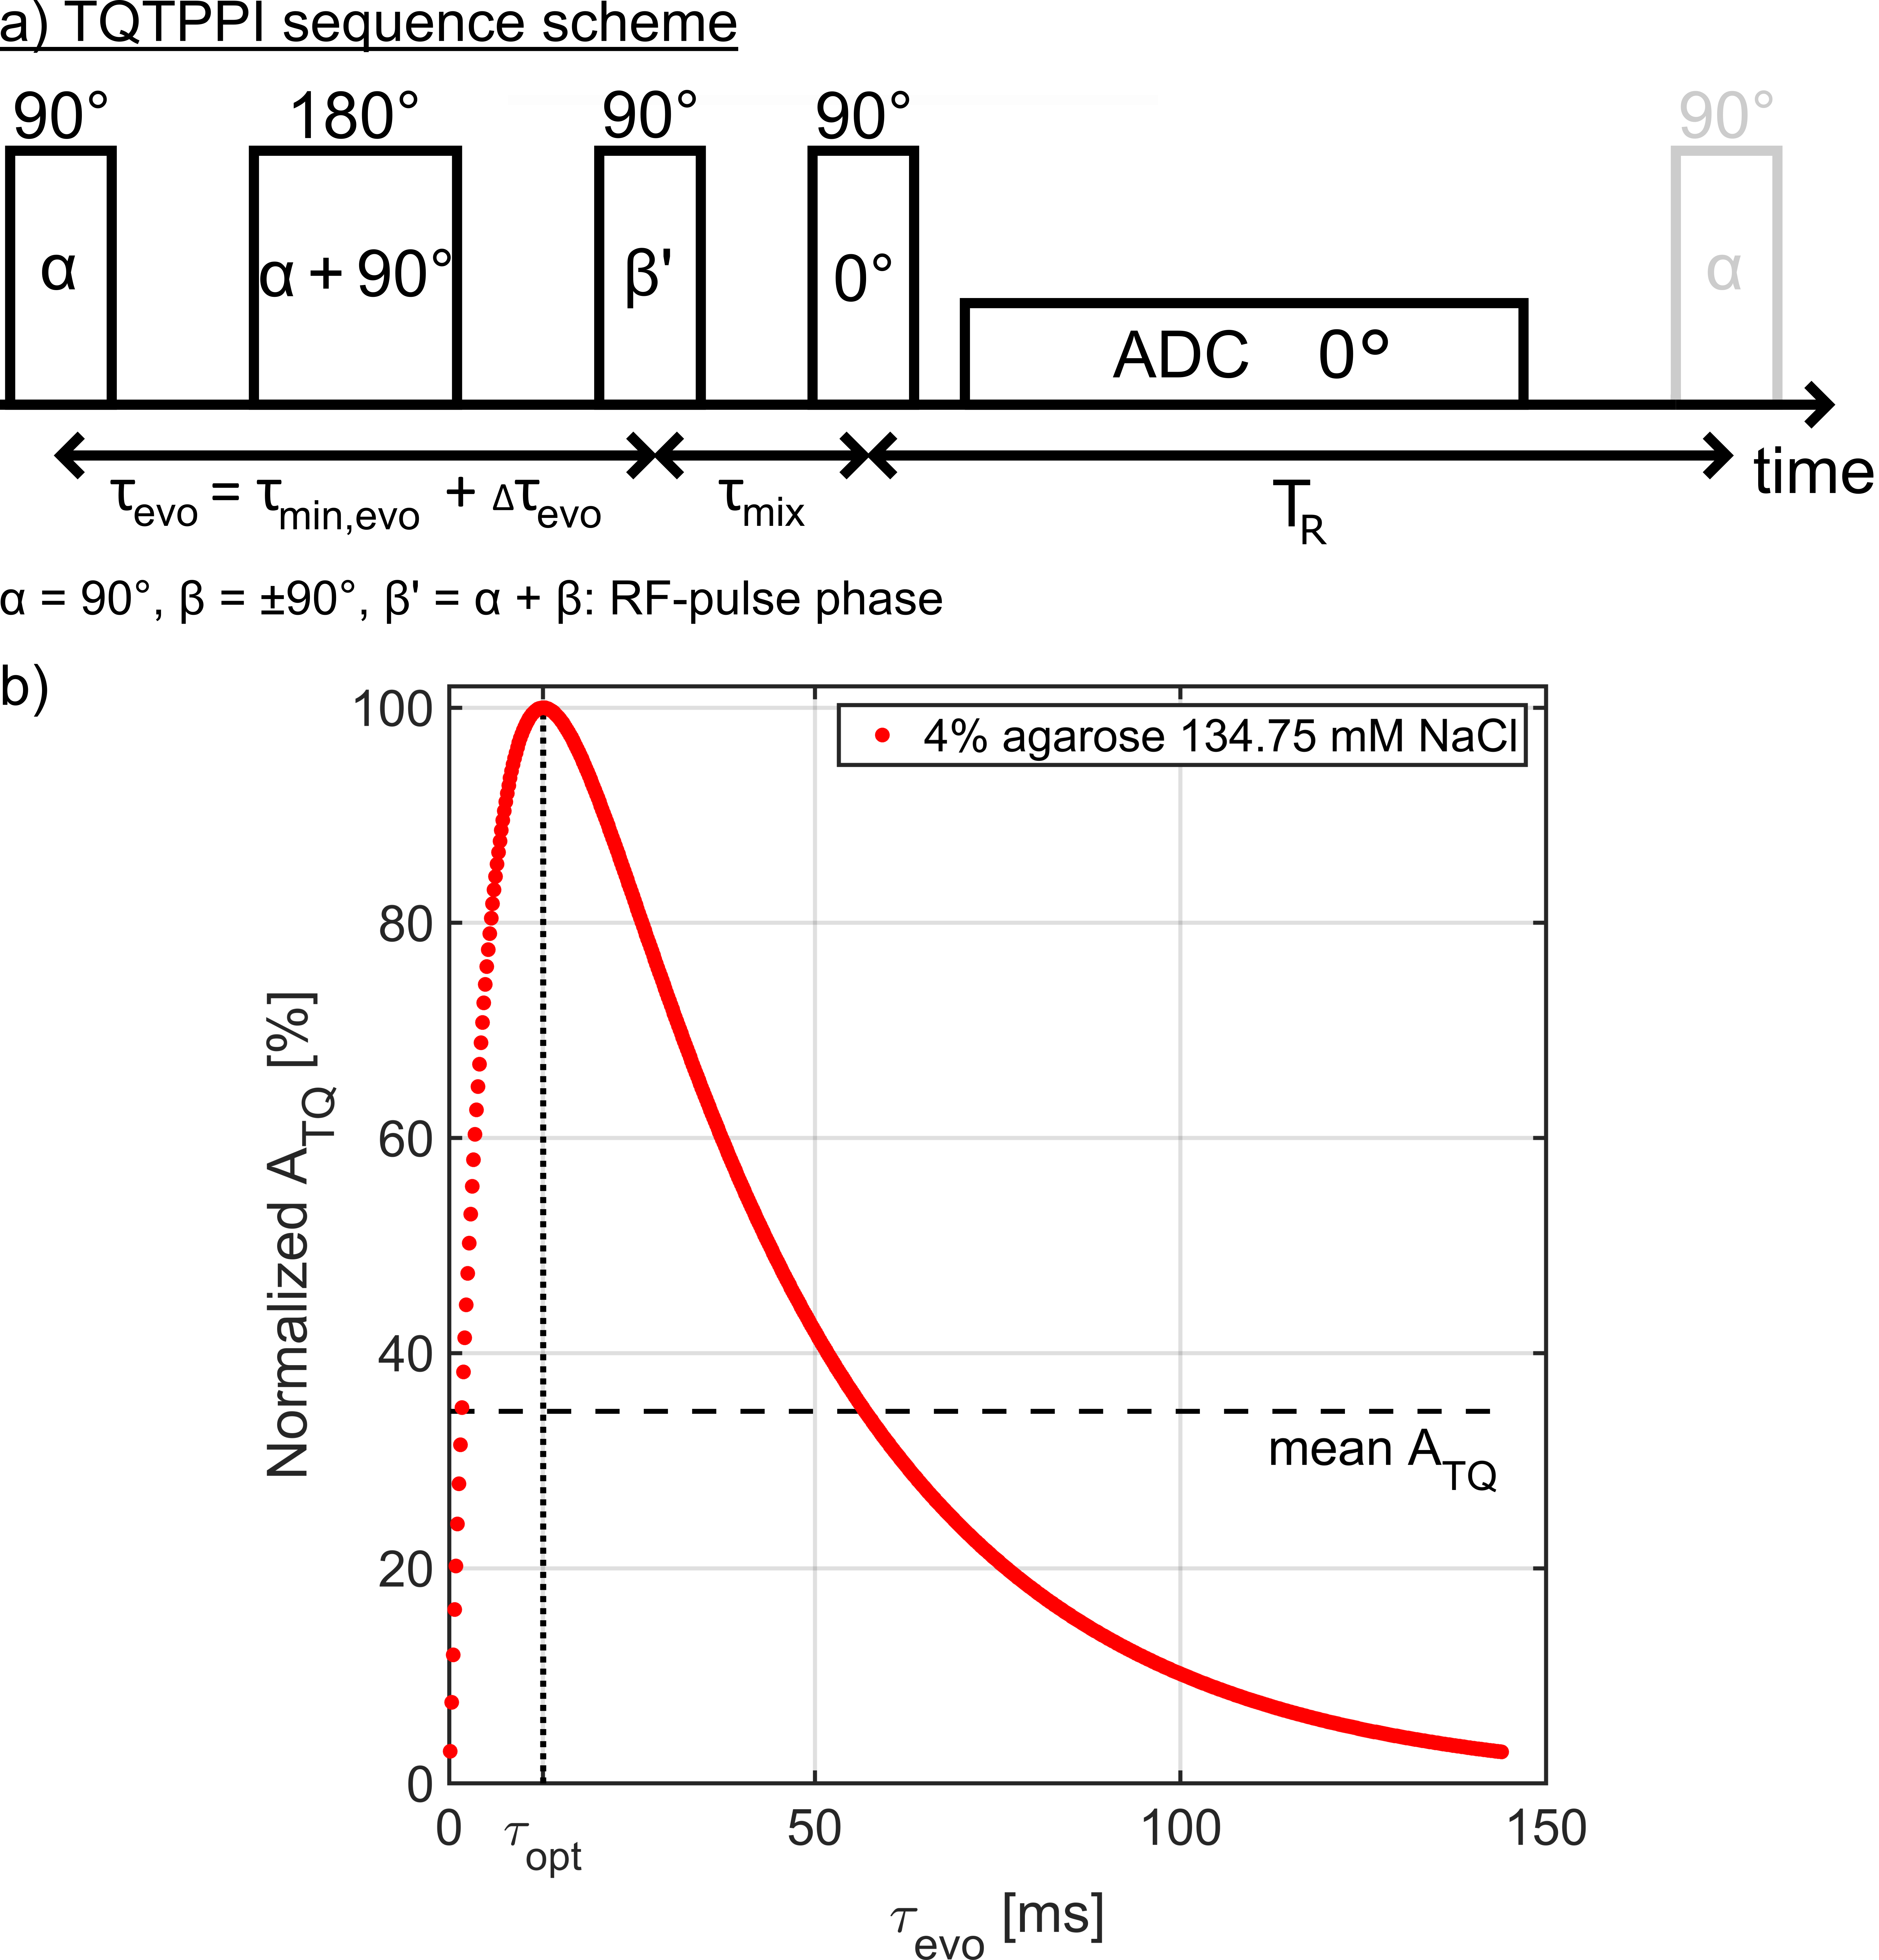
Fig.2: a) The TQTPPI pulse sequence scheme. The standard
TQTPPI sequence uses an evolution time and a phase increment, while the fixed
TQTPPI sequence uses only a phase increment. b) The mean TQ amplitude ATQ is
lower for the standard TQTPPI sequence as the whole TQ FID is measured. The
fixed TQTPPI measures the maximum ATQ amplitude throughout the
sequence when τevo=τopt.
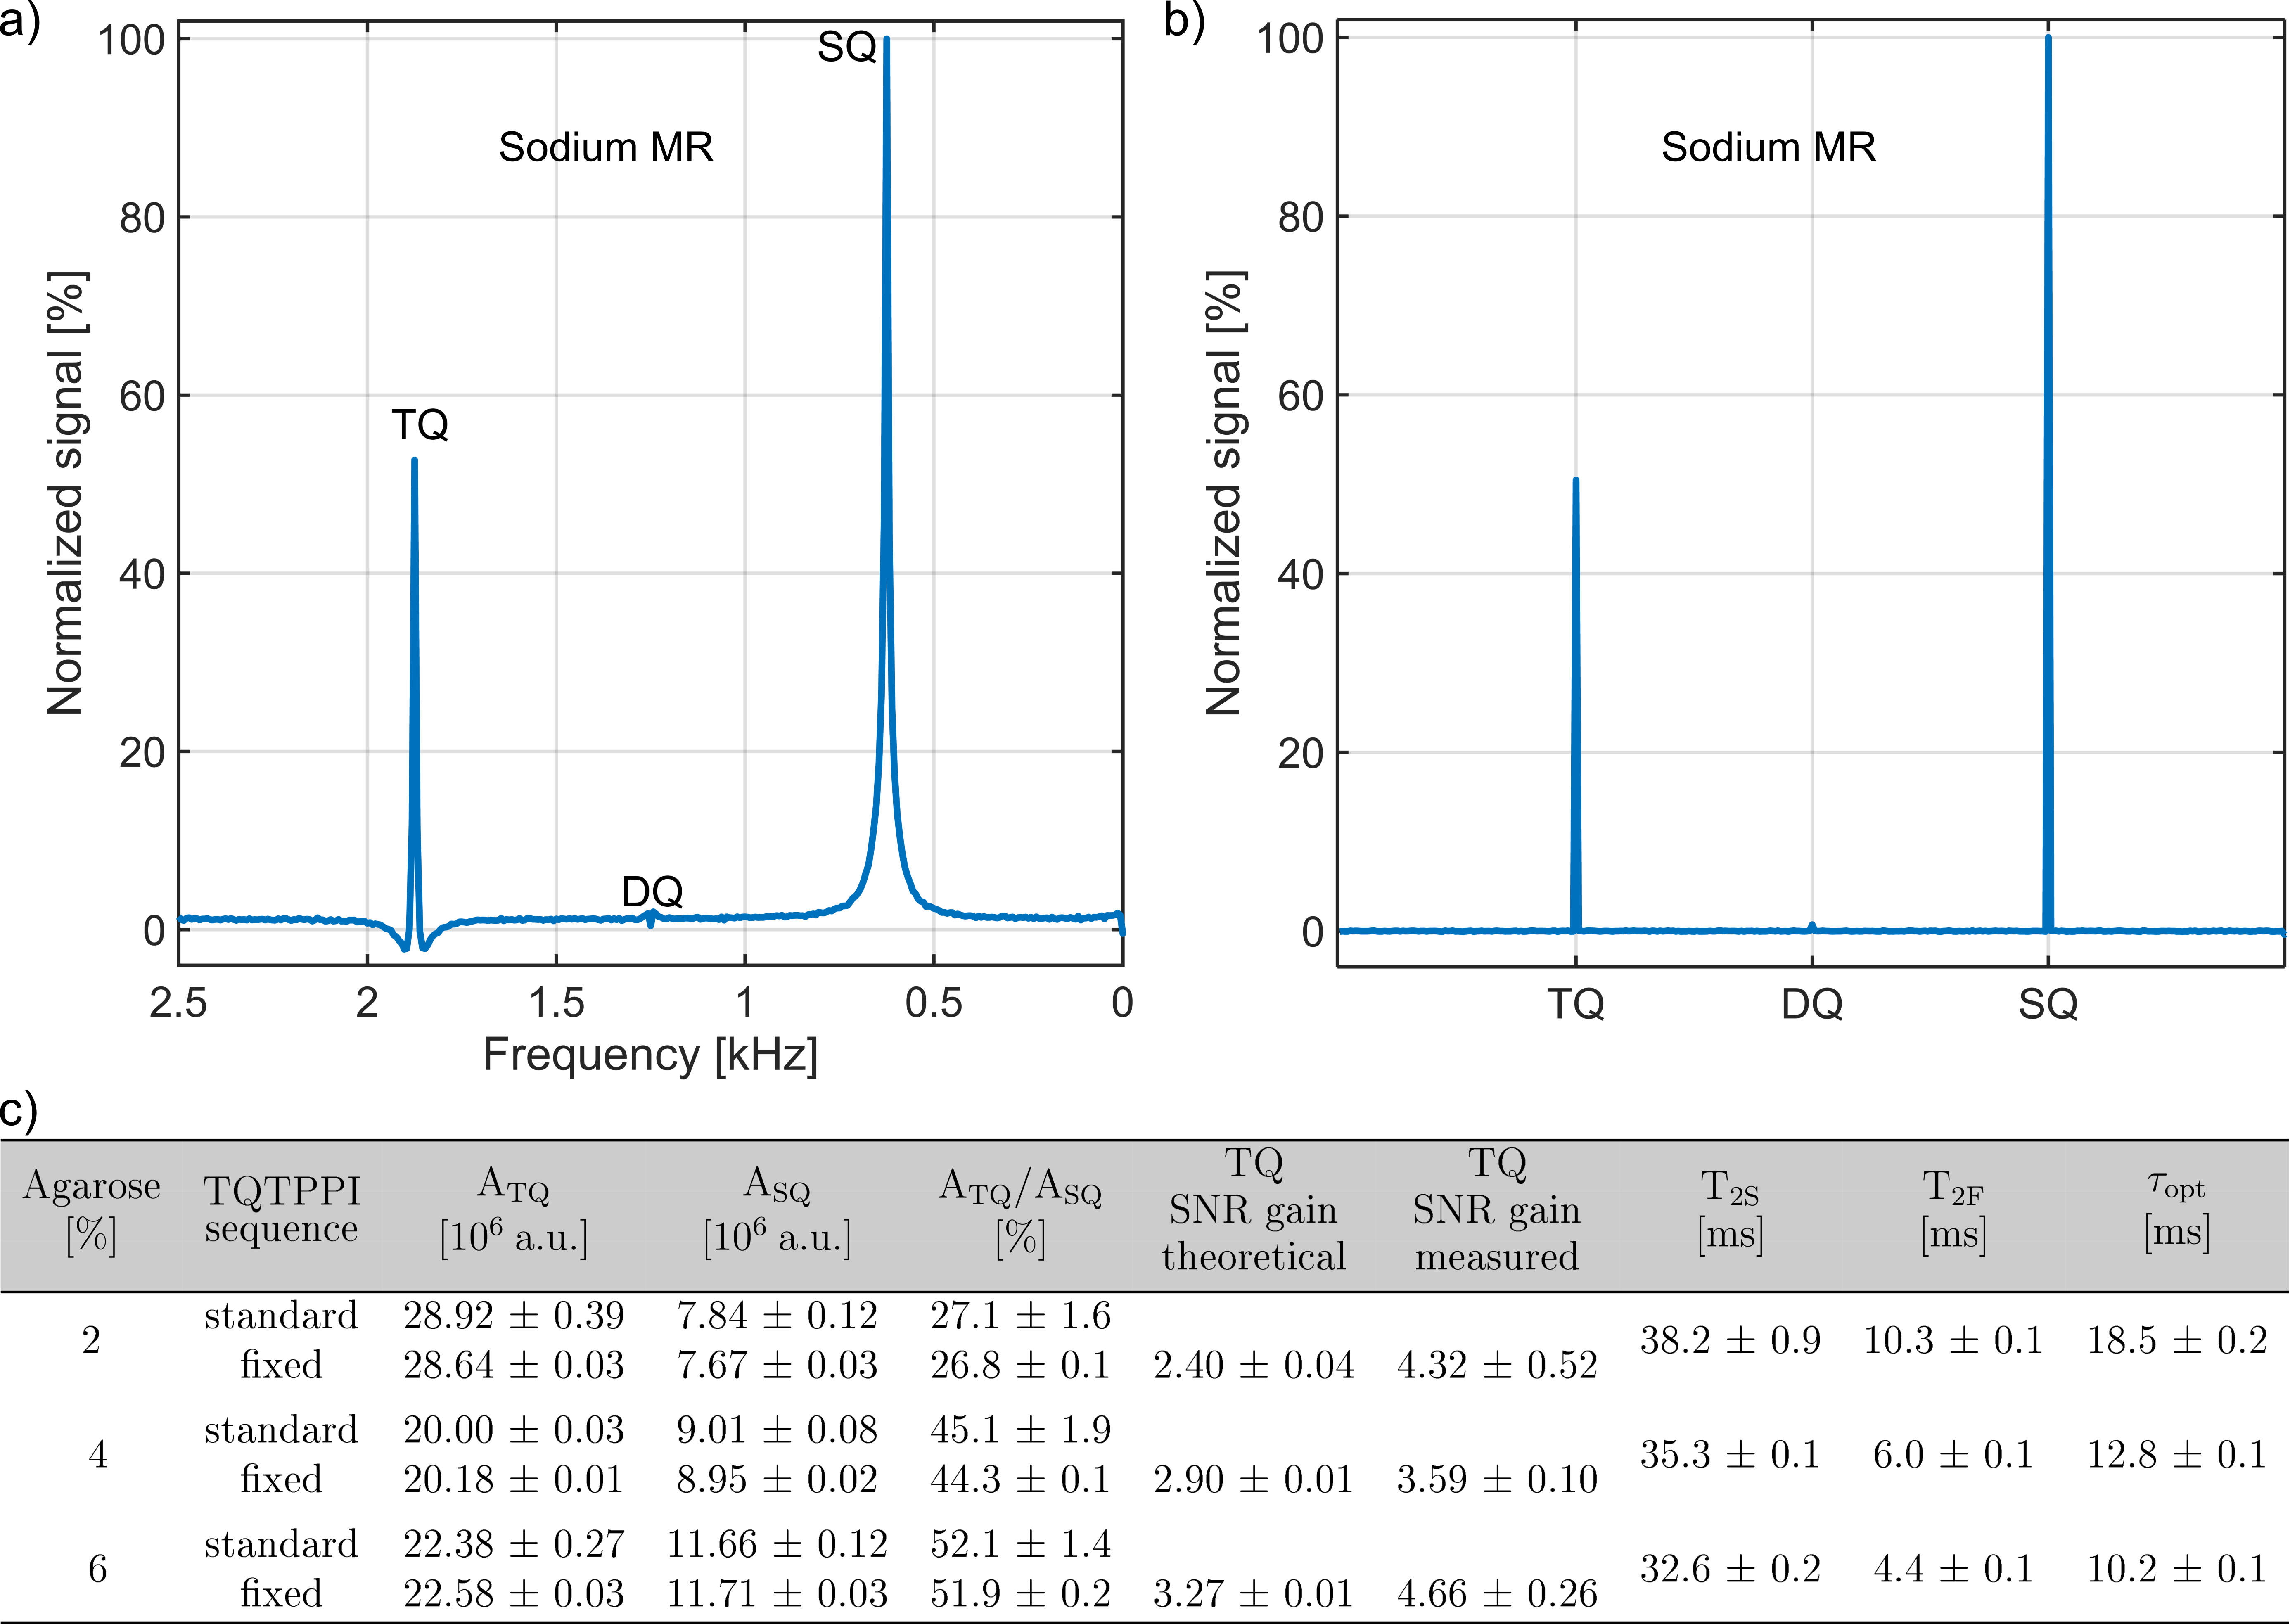
Fig.3: a) and b) show the
standard and fixed TQTPPI spectrum for 4% agarose in 134.75mM NaCl,
respectively. c) TQ SNR gain for the fixed TQTPPI sequence. The values of ATQ
and ASQ from the standard TQTPPI sequence were corrected to the optimal
evolution time as the evolution time for the fixed TQTPPI sequence was set to
the optimal delay determined form the standard TQTPPI measurement.
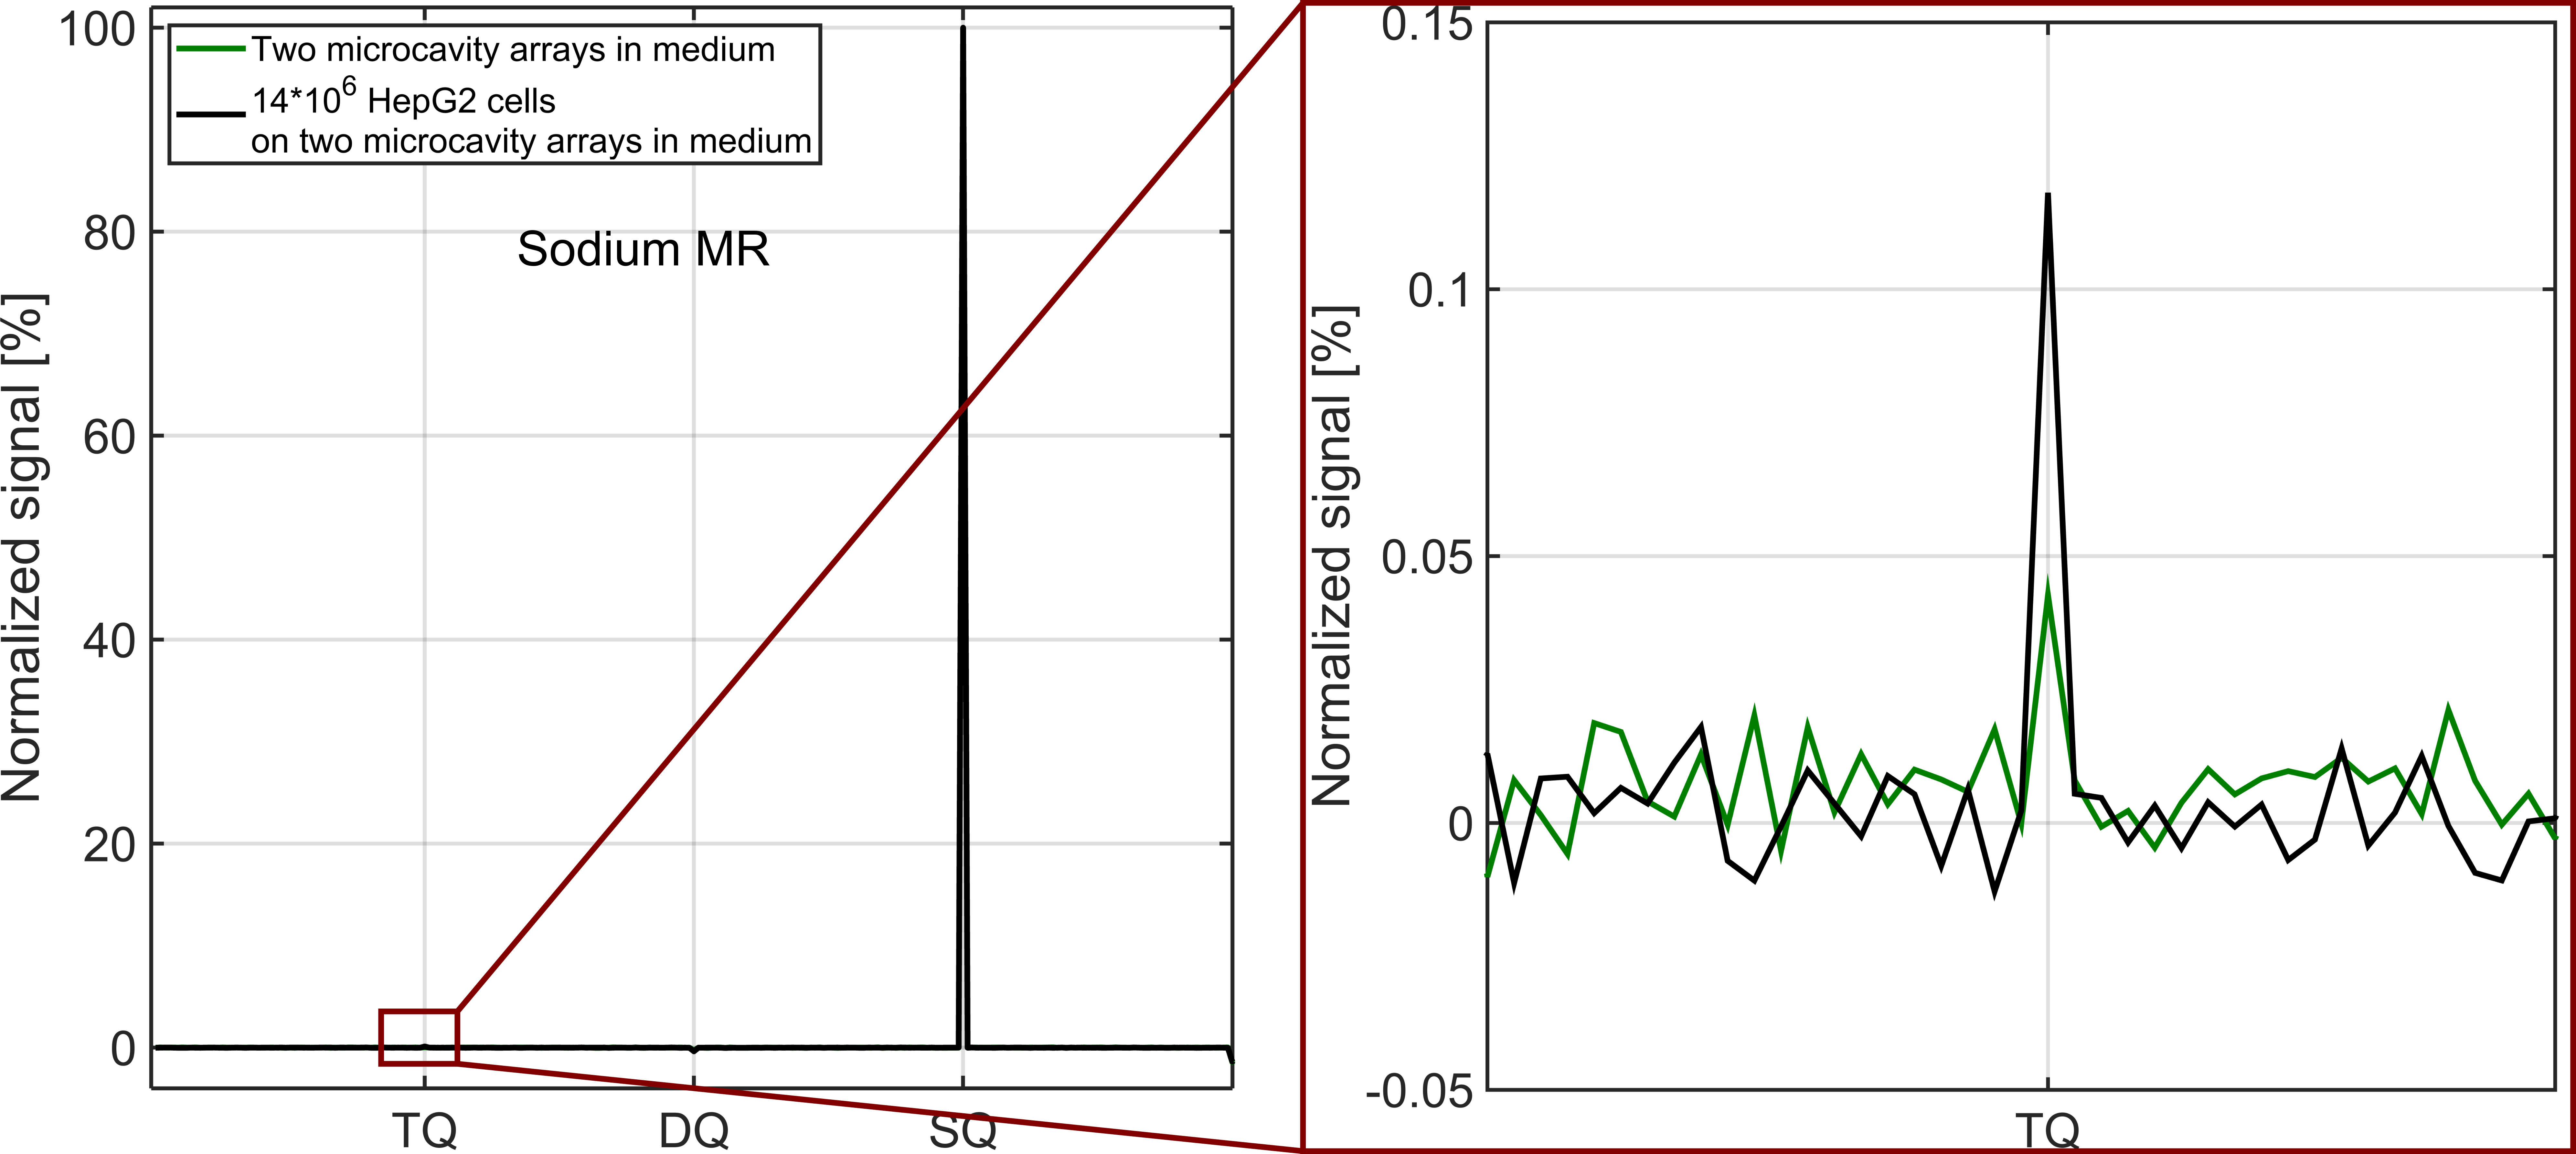
Fig.4: A
background sodium TQ signal of ATQ/ASQ=0.4±0.6‰ was
measured from two collagenized microcavity arrays in medium (green). For 14
million HepG2 cells on two collagenized microcavity arrays in medium, the total
TQ signal is ATQ/ASQ=1.2±0.7‰.
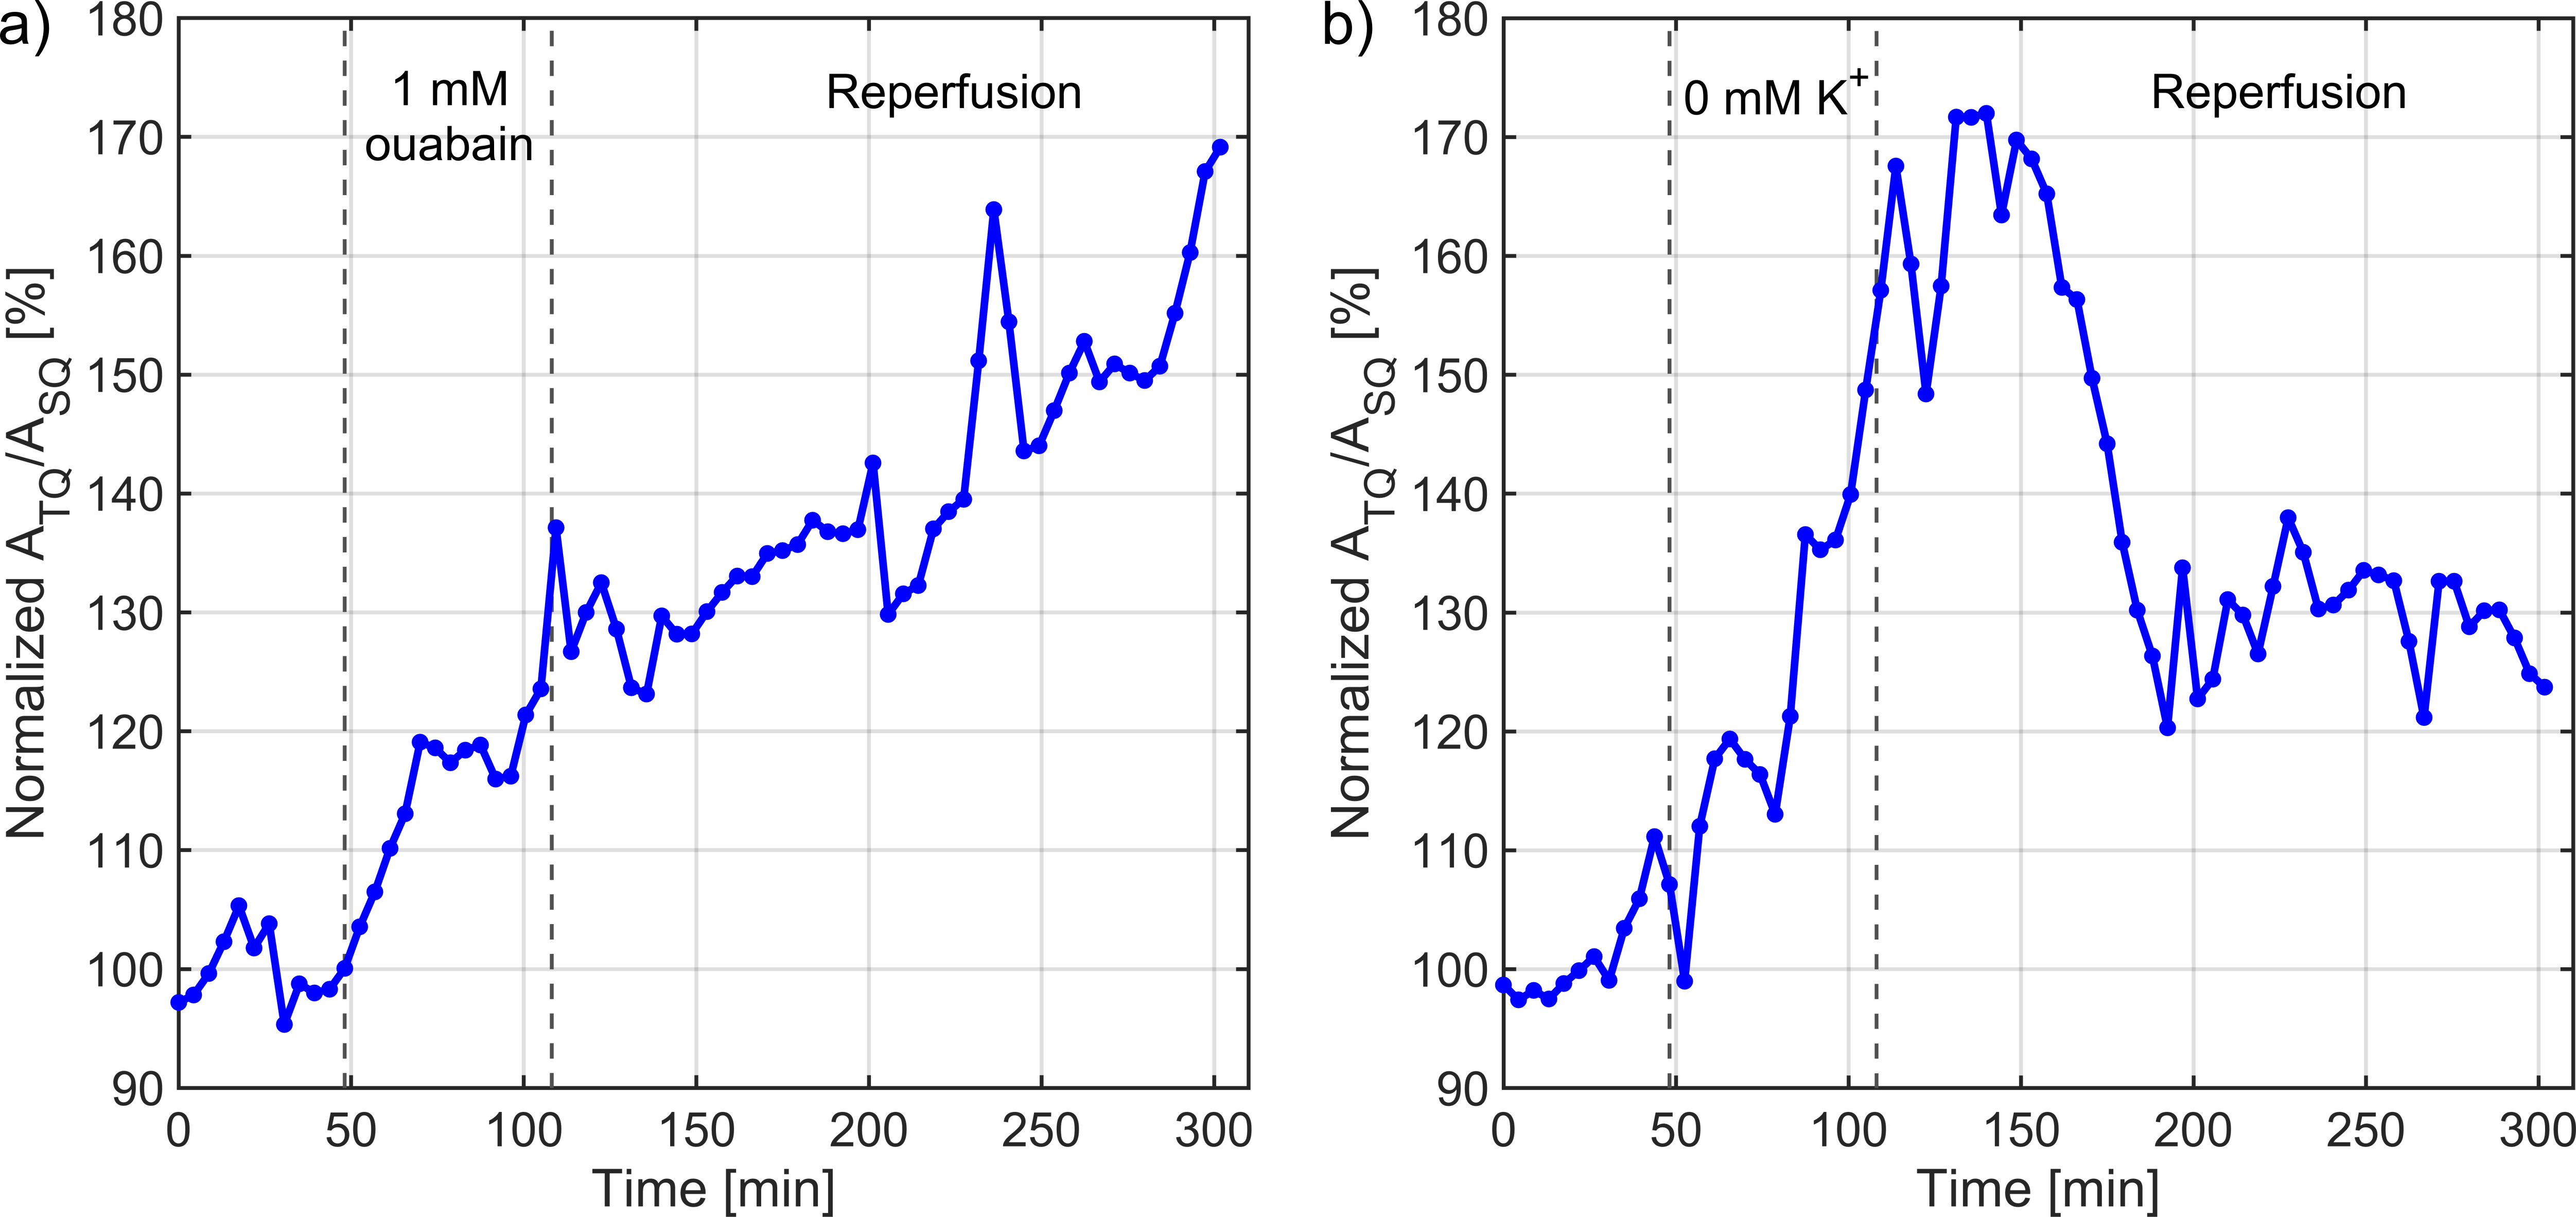
Fig.5: a) The exposure of HepG2 cells to 1mM ouabain led to
an increase of the TQ signal up to an intermediate plateau of 128.9±3.9%.
During reperfusion with medium, the TQ signal further increased which indicated
a loss of cell viability and loss of intracellular gradient. b) Exposure of
HepG2 cells to a K+-free medium resulted in a large TQ signal response
of 165.0±7.4%. During reperfusion, with an delay of 40min, the cancer cells
were capable to partial restore their intracellular gradient and,
correspondingly, the TQ signal decreased to 129.5±4.5% indicating a partial
cell viability.