2975
Therapeutic Efficacy of Stem Cell Donors for Stroke as Determined by 23Na MRI and 1H MRS at 21.1 T
Shannon Helsper1,2, Xuegang Yuan1,2, F. Andrew Bagdasarian1,2, and Samuel Colles Grant1,2
1National High Magnetic Field Laboratory, Florida State University, Tallahassee, FL, United States, 2Chemical & Biomedical Engineering, FAMU-FSU College of Engineering, Tallahassee, FL, United States
1National High Magnetic Field Laboratory, Florida State University, Tallahassee, FL, United States, 2Chemical & Biomedical Engineering, FAMU-FSU College of Engineering, Tallahassee, FL, United States
Synopsis
This study evaluates the therapeutic efficacy of human mesenchymal stem cells (hMSC) from different donors applied to an ischemic rat model. Biochemical markers of tissue recovery were measured longitudinally over 21 d using sodium chemical shift imaging, relaxation enhanced MR spectroscopy, and T2-weighted proton imaging at 21.1 T. Ultra-high field provided increased sensitivity, enabling insight into ionic and metabolic regulation while demonstrating differential recovery based on donor characteristics evident only after extended culture. With trophic and immunomodulation effects, hMSC hold promise for cell-based stroke therapy, but donor variance must be evaluated for translation. MR metrics classify donor quality and effectiveness.
Introduction
Trophic and immunomodulatory effects render human mesenchymal stem cells (hMSC) promising candidates for cell therapy in stroke treatment. Donor variance, however, could lead to clinical trial failure as in vitro quantification of preclinical hMSC properties is time consuming and sometimes misleading. Thus, investigation of donor variation is imperative for translational studies in stroke. Here, treatment efficacy is compared between two donors with different therapeutic potentials in a rat model of transient ischemia using aggregate-derived hMSC, which achieve enhanced therapeutic effects, increased resistance to ischemia and reduced cell size.1 Biochemical markers were measured longitudinally over 21 d using sodium (23Na) chemical shift imaging (CSI), relaxation enhanced MR spectroscopy (RE-MRS), and T2-weighted proton imaging. Ultra-high field (21.1 T) provided increased sensitivity, enabling insight into ionic and metabolic homeostasis that demonstrated differential tissue recovery reflecting donor metrics evident after only prolonged culture.Methods
Cell Culture: Two hMSC sources were acquired from Tulane Center for Stem Cell Research and Regenerative Medicine and characterized based on plastic adherence and surface markers.1 Evaluations of hMSC included population doubling time, colony forming ability, immunomodulation and replicative senescence during extended culture expansion. In brief, the two sources were cultured to passage 4-8 (P4-8) to compare in vitro senescence and therapeutic potentials. For in vivo transplantation, hMSC were cultured on ultra-low attachment surface for 2 d with aggregation induced on P5, followed by dissociation to single cells and replating on tissue culture plates for 2 d. hMSC then were exposed to 7.47-µg Fe/mL micron-sized particles of iron oxide for 12 h and washed just prior to injection.Animal Model: A transient middle cerebral artery occlusion model2 was instituted in Sprague-Dawley rats (200–250 g) for 1 h, inducing striatal ischemia, followed by immediate arterial injection of ~1 mil hMSC from Donor 1 (n=6) or Donor 2 (n=6) in 50-µL saline or saline only (n=8). Behavioral characterization was conducted concurrently with MR scanning to 21-d post-ischemia.
MR Acquisitions: Data were acquired using the 21.1-T, 900-MHz vertical magnet at the NHMFL with a linear birdcage double-tuned 23Na/1H radio frequency coil on 1, 3, 7 and 21 d post-ischemia to assess tissue recovery and treatment efficacy. Cell administration was confirmed with gradient recalled echo images (50x50-µm in-plane resolution). 3D 23Na CSI was acquired at 1-mm isotropic resolution. 1H T2W images were acquired with a 1H fast spin echo sequence (100x100-µm in-plane resolution) (Fig. 1). RE-MRS3 evaluated metabolites in both ischemic and contralateral hemispheres. Selective bandwidth excitation pulses targeted lactate, creatine, choline and N-acetyl aspartate, while avoiding water, with spatial selectivity imparted by adiabatic selective refocusing (LASER)3 pulses. T2W images enabled anatomical reference to the ischemic lesion and contralateral alignment.
Analysis: CSI data reconstructed in MATLAB was zero-filled to 0.5-mm isotropic resolution for volumetric and signal analysis in Amira 3D Visualization Software. A signal threshold generated from the contralateral hemisphere was used to define the ischemic lesion for 23Na and 1H data. RE-MRS data were reconstructed in JMRUI using Linear Prediction Singular Value Decomposition to select components with peaks assigned according to previous literature (NAA 2.0 ppm, Lac 1.31 ppm, Cre 3.0 ppm, Cho 3.2 ppm)4, referencing water at 4.7 ppm. Metabolite ratios to choline were used to track metabolic signals longitudinally. Statistical significance is shown according to a Student’s T-test and all graphs are mean ± SD.
Results
23Na/1H lesion volume and signal as well as metabolite concentrations reflect compromised tissue recovery via Donor 1 when implanted at P5. Though population doubling time, colony forming and immunomodulatory potentials were comparable between donors at P5, Donor 1 demonstrated increased senescence when culture-expanded to P8 and reduced immunomodulation compared to Donor 2 (Fig. 2).Sodium volume and signal were reduced for Donor 2 compared to saline (p<0.05) and Donor 1 (p<0.05, signal only) on 3 d demonstrating an immediate decrease, which contrasts the typically elevated sodium levels occurring from day 1-3 (Fig. 3). Additionally, 1H lesion volume and percent volume change are significantly reduced for Donor 2 compared to control (p<0.05) on 3 d (Fig. 4). Longitudinal decreases in both 23Na and 1H volume and signal vary between groups. RE-MRS results support MRI findings with reduced Lac:Cho levels on 3 d for Donor 2 only (Fig. 5).
Discussion & Conclusion
In vitro cellular assays suggest normal metabolism and growth through P5, corresponding to the point of implantation; however, MR indicates significant changes in efficacy prior to the extended senescence, which significantly increased at P8 for Donor 1. Differential MR metrics between donor implants become noticeable as early as 1 d, with achieved significance by 3 d. Early restoration of ATPase functionality is significant for Donor 2 as measured by reduced 23Na levels and decreased lactate as well as lesion reduction in T2W images on 3 d. Therefore, MR is capable of distinguishing protective or early regenerative effects between otherwise “healthy” but compromised cells.Determining the efficacy of hMSC lines using MR in conjunction with traditional cell assays provides valuable feedback in assessing compromised cells, which can be identified via high field 23Na MRI and 1H RE-MRS as early as 1 d post-injection.
Acknowledgements
All work has been conducted in accordance with the FSU Animal Care and Use Committee. This work was supported by the NIH (RO1-NS102395). The National High Magnetic Field Laboratory is funded by the NSF (DMR-1644779) and the State of Florida.References
- Yuan, X, et al. Aggregation Preconditioning Enhances Survival and Efficacy of Human Mesenchymal Stem Cells in Stroke Treatment. Cytotherapy. 2019;21(10):1033-1048.
- Longa, EZ, et al. Reversible middle cerebral artery occlusion without cranectomy in rats. Stroke. 1989;20(1):84-91.
- Shemesh, N, et al. Metabolic properties in stroked rats revealed by relaxation-enhanced magnetic resonance spectroscopy at ultrahigh fields. Nat. Commun. 2014;5:4958.
- Govindaraju, V, et al. Proton NMR chemical shifts and coupling constants for brain metabolites. NMR Biomed. 2000;13:129-153.
Figures
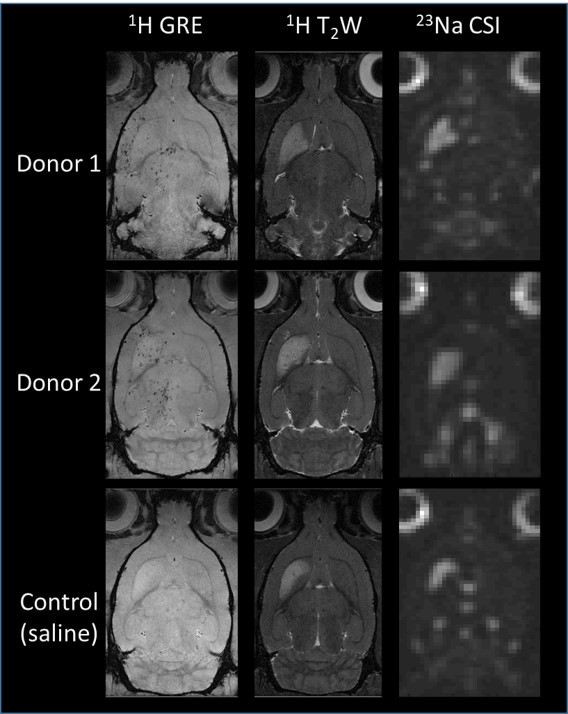
Fig 1.
Representative 1H gradient recalled echo (GRE) images for hMSC
localization as well as 1H T2W and 23Na CSI
images for ischemic lesion assessment, corresponding to the hyper-intense regions, is demonstrated from all three groups on day 1
post-ischemia.
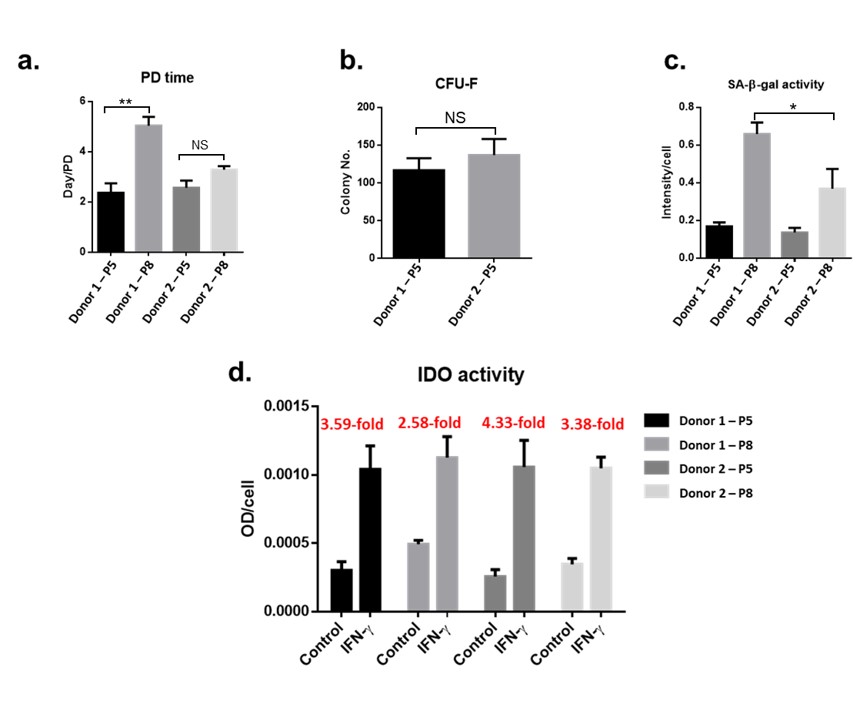
Fig 2.
a) Population
doubling (PD) time is significantly increased for Donor 1 P5 to P8 but remains
comparable between both donors at P5. Donor 2 remains stable at further
expansion. b) Colony forming ability
(CFU-F) is comparable at P5. c)
Senescence-associated beta-galactosidase (SA-β-gal) activity is significantly
elevated in Donor 1 at P8 compared to Donor 2 while comparable at P5. d) Indoleamine 2,3-dioxygenase (IDO),
an enzyme marker for immunomodulation, is increased for Donor 2 under stress
compared to Donor 1.
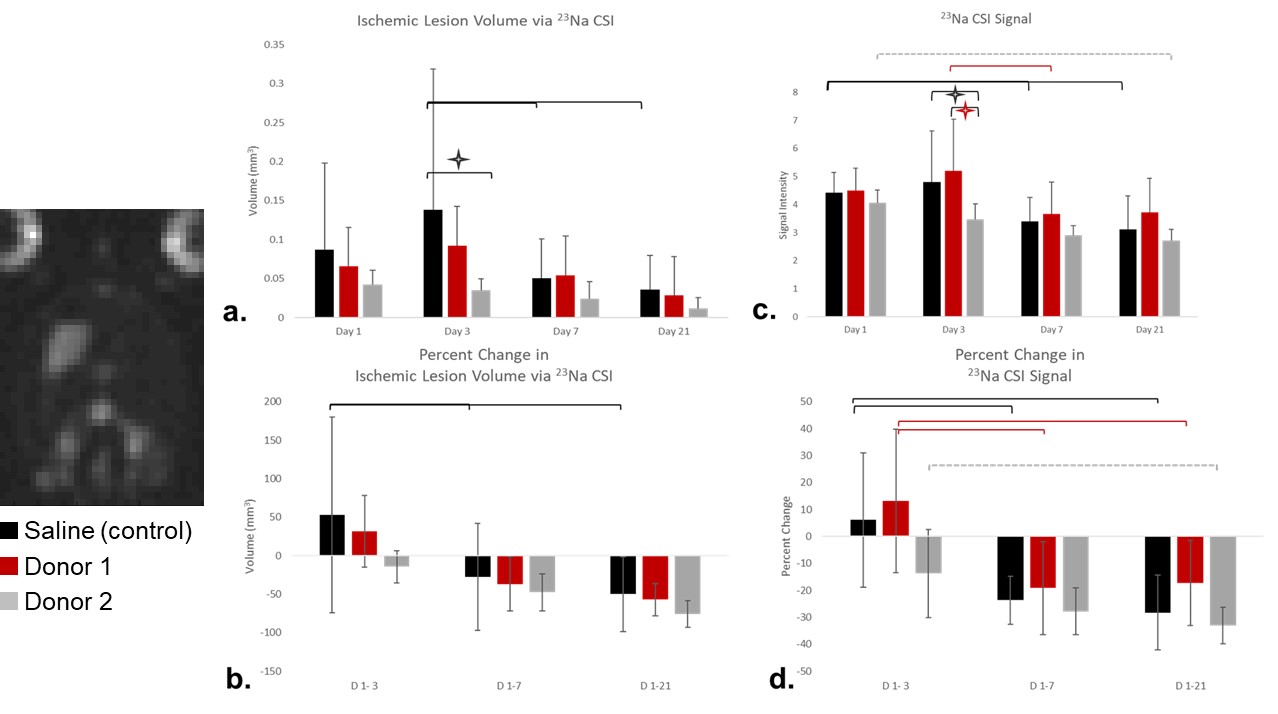
Fig
3. 23Na CSI assessment is demonstrated. a) Sodium lesion volume is
significantly reduced on day 3 for Donor 2 compared to control (p<0.05)
while longitudinal decreases are seen only for control at later time points
(p<0.05) with similar longitudinal changes in b) percent change metrics. c)
Significant changes in signal are seen on day 3 between Donor 2 and both Donor
1 and controls when the ischemic region is superimposed from day 1. d) Percent change in signal levels
demonstrate only longitudinal changes.
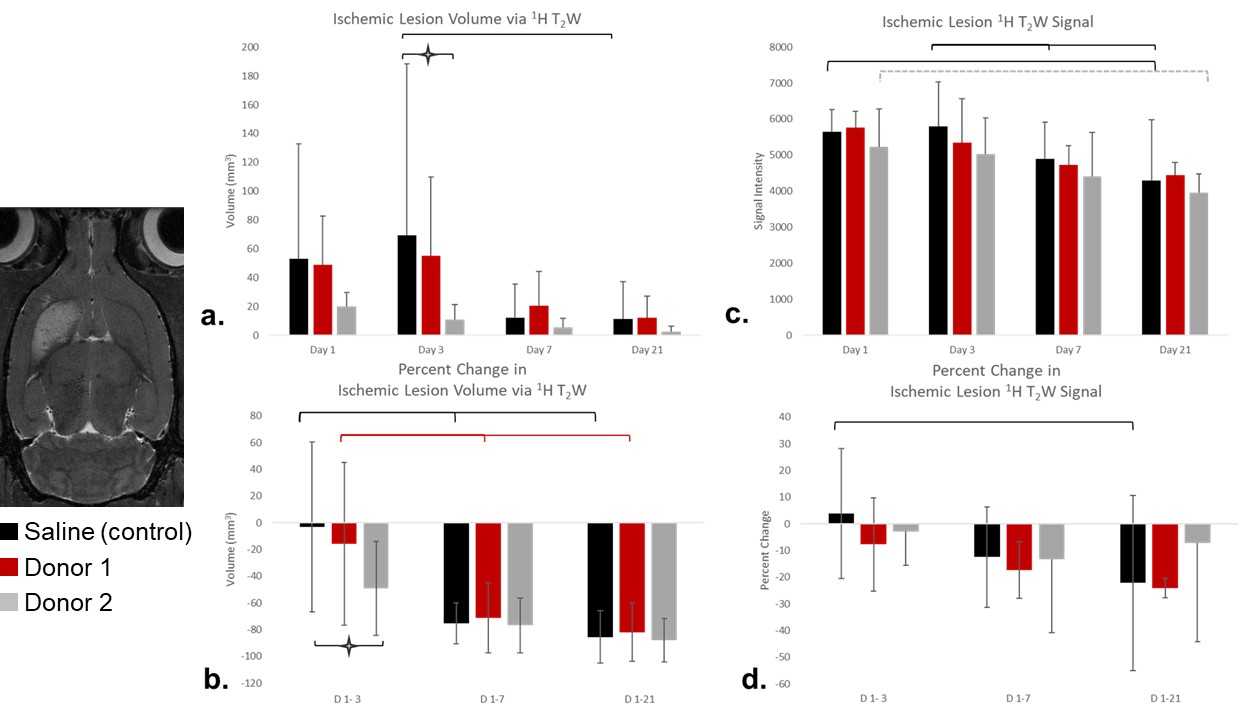
Fig
4. 1H T2W assessment is
demonstrated. a) Donor 2 results in
significantly smaller ischemic volume compared to control (p<0.05) with b) corresponding percent change from
day 1-3. 1H signal measured from day 1 ischemic lesion superimposed
on to later days demonstrates only longitudinal changes from both c) signal and d) percent change in signal.
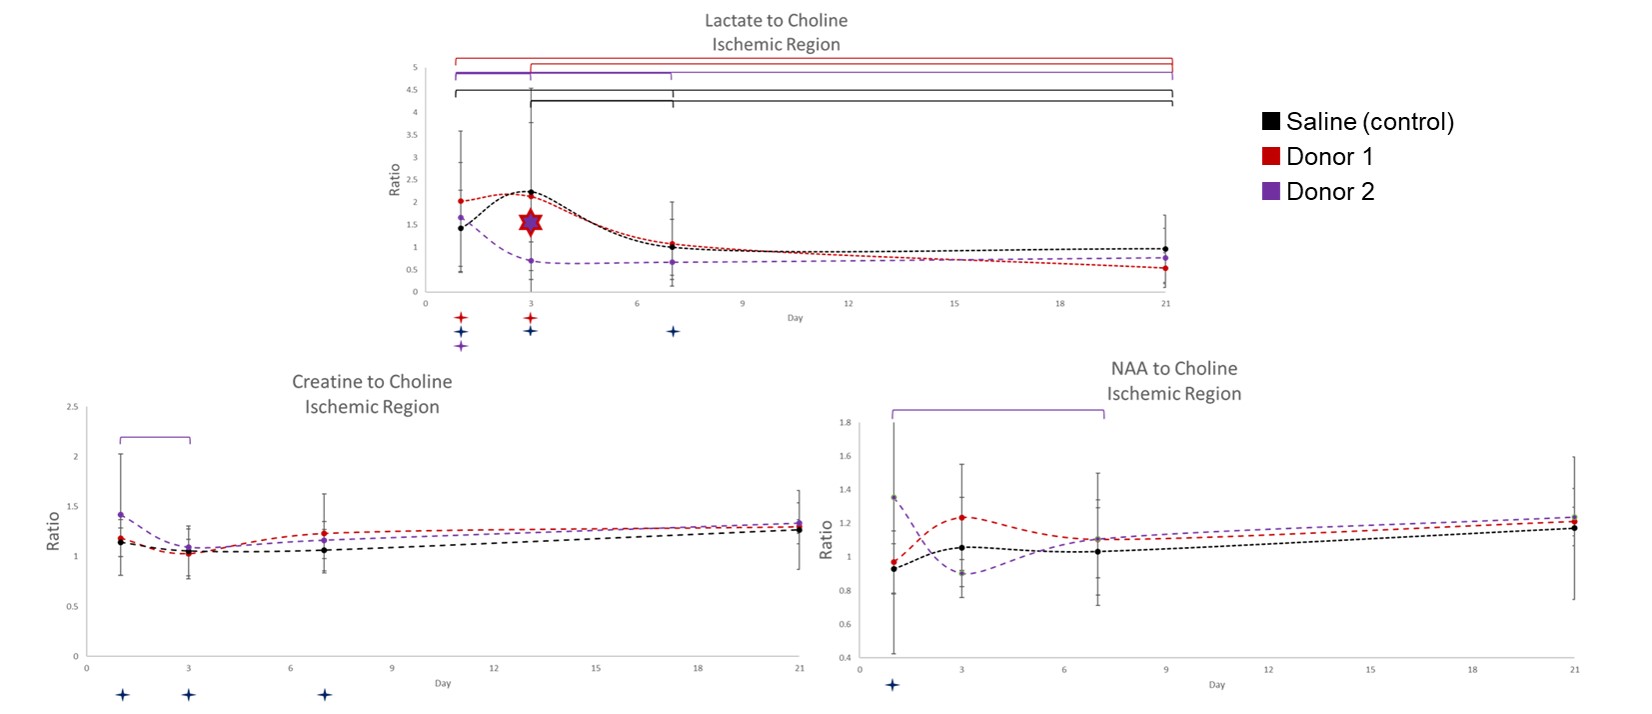
Fig
5. Ipsilateral
RE-MRS for Lac-, Cre-, and NAA-Cho ratios. Donor 2 displays a significant
decrease in Lac levels on 3 d from Donor 1 (p<0.05) with similar trend from
control. An immediate drop in Lac is indicative of tissue recovery.
Longitudinal changes are evident for all groups in Lac levels by 21 d. Cre- and
NAA-Cho ratios only indicate longitudinal changes for Donor 2.