2974
Fast 31P-MRSI of the brain at 3T using concentric ring (CONCEPT) MRSI1Wellcome Centre for Integrative Neuroimaging, NDCN, University of Oxford, Oxford, United Kingdom, 2High-field MR Centre, Department of Biomedical Imaging and Image-guided Therapy, Medical University of Vienna, Vienna, Austria, 3Wolfson Brain Imaging Centre, Department of Clinical Neurosciences, University of Cambridge, Cambridge, United Kingdom, 4Oxford Centre for Clinical Magnetic Resonance Research, Radcliffe Department of Medicine, University of Oxford, Oxford, United Kingdom, 5Department of Imaging Methods, Institute of Measurement Science, Slovak Academy of Sciences, Bratislava, Slovakia
Synopsis
A density-weighted concentric ring trajectory MRSI sequence is created for 31P-MRSI of the human brain at 3T. The sequence is assessed in three subjects at five different acquisition times (7:28 – 1:07 minutes) and compared against resolution and time-matched 3D cartesian CSI sequences. The proposed CONCEPT MRSI sequences robustly measure 3D localised PCr/ATP ratios of the human brain 1.5 times faster than the minimum possible with CSI at a matched repetition time. This opens the possibility of fast dynamic measurements of PCr/ATP in whole human cerebrum at 3T.
Introduction
Phosphorous magnetic resonance spectroscopy (31P-MRS) is able to quantify the brain’s energy usage through measurements of high-energy phosphate metabolism (1). Dynamic measurements could monitor changing energy usage during temporally modulating external stimuli such as tDCS (2,3). It is therefore desirable to be able to localise signal to multiple brain regions simultaneously in a short timeframe.Typically, 31P-MRS has been conducted using cartesian 3D-CSI sequences (4). Though 3D-CSI offers optimal SNR for a particular acquisition time, the minimum acquisition time for a certain resolution and repetition time is undesirably long (5). Concentric ring MRSI (CONCEPT) has recently been shown to be an effective pulse-sequence for high-resolution 1H-MRSI of the brain, permitting fast coverage of k-space per unit scan-time (6,7).
In this work we demonstrate a 31P density-weighted CONCEPT sequence for fast MRSI of the human motor cortex and cerebrum at 3T (8). The proposed sequence is compared against an acquisition-weighted cartesian sampled CSI sequence for reduced minimum acquisition time (9).
Methods
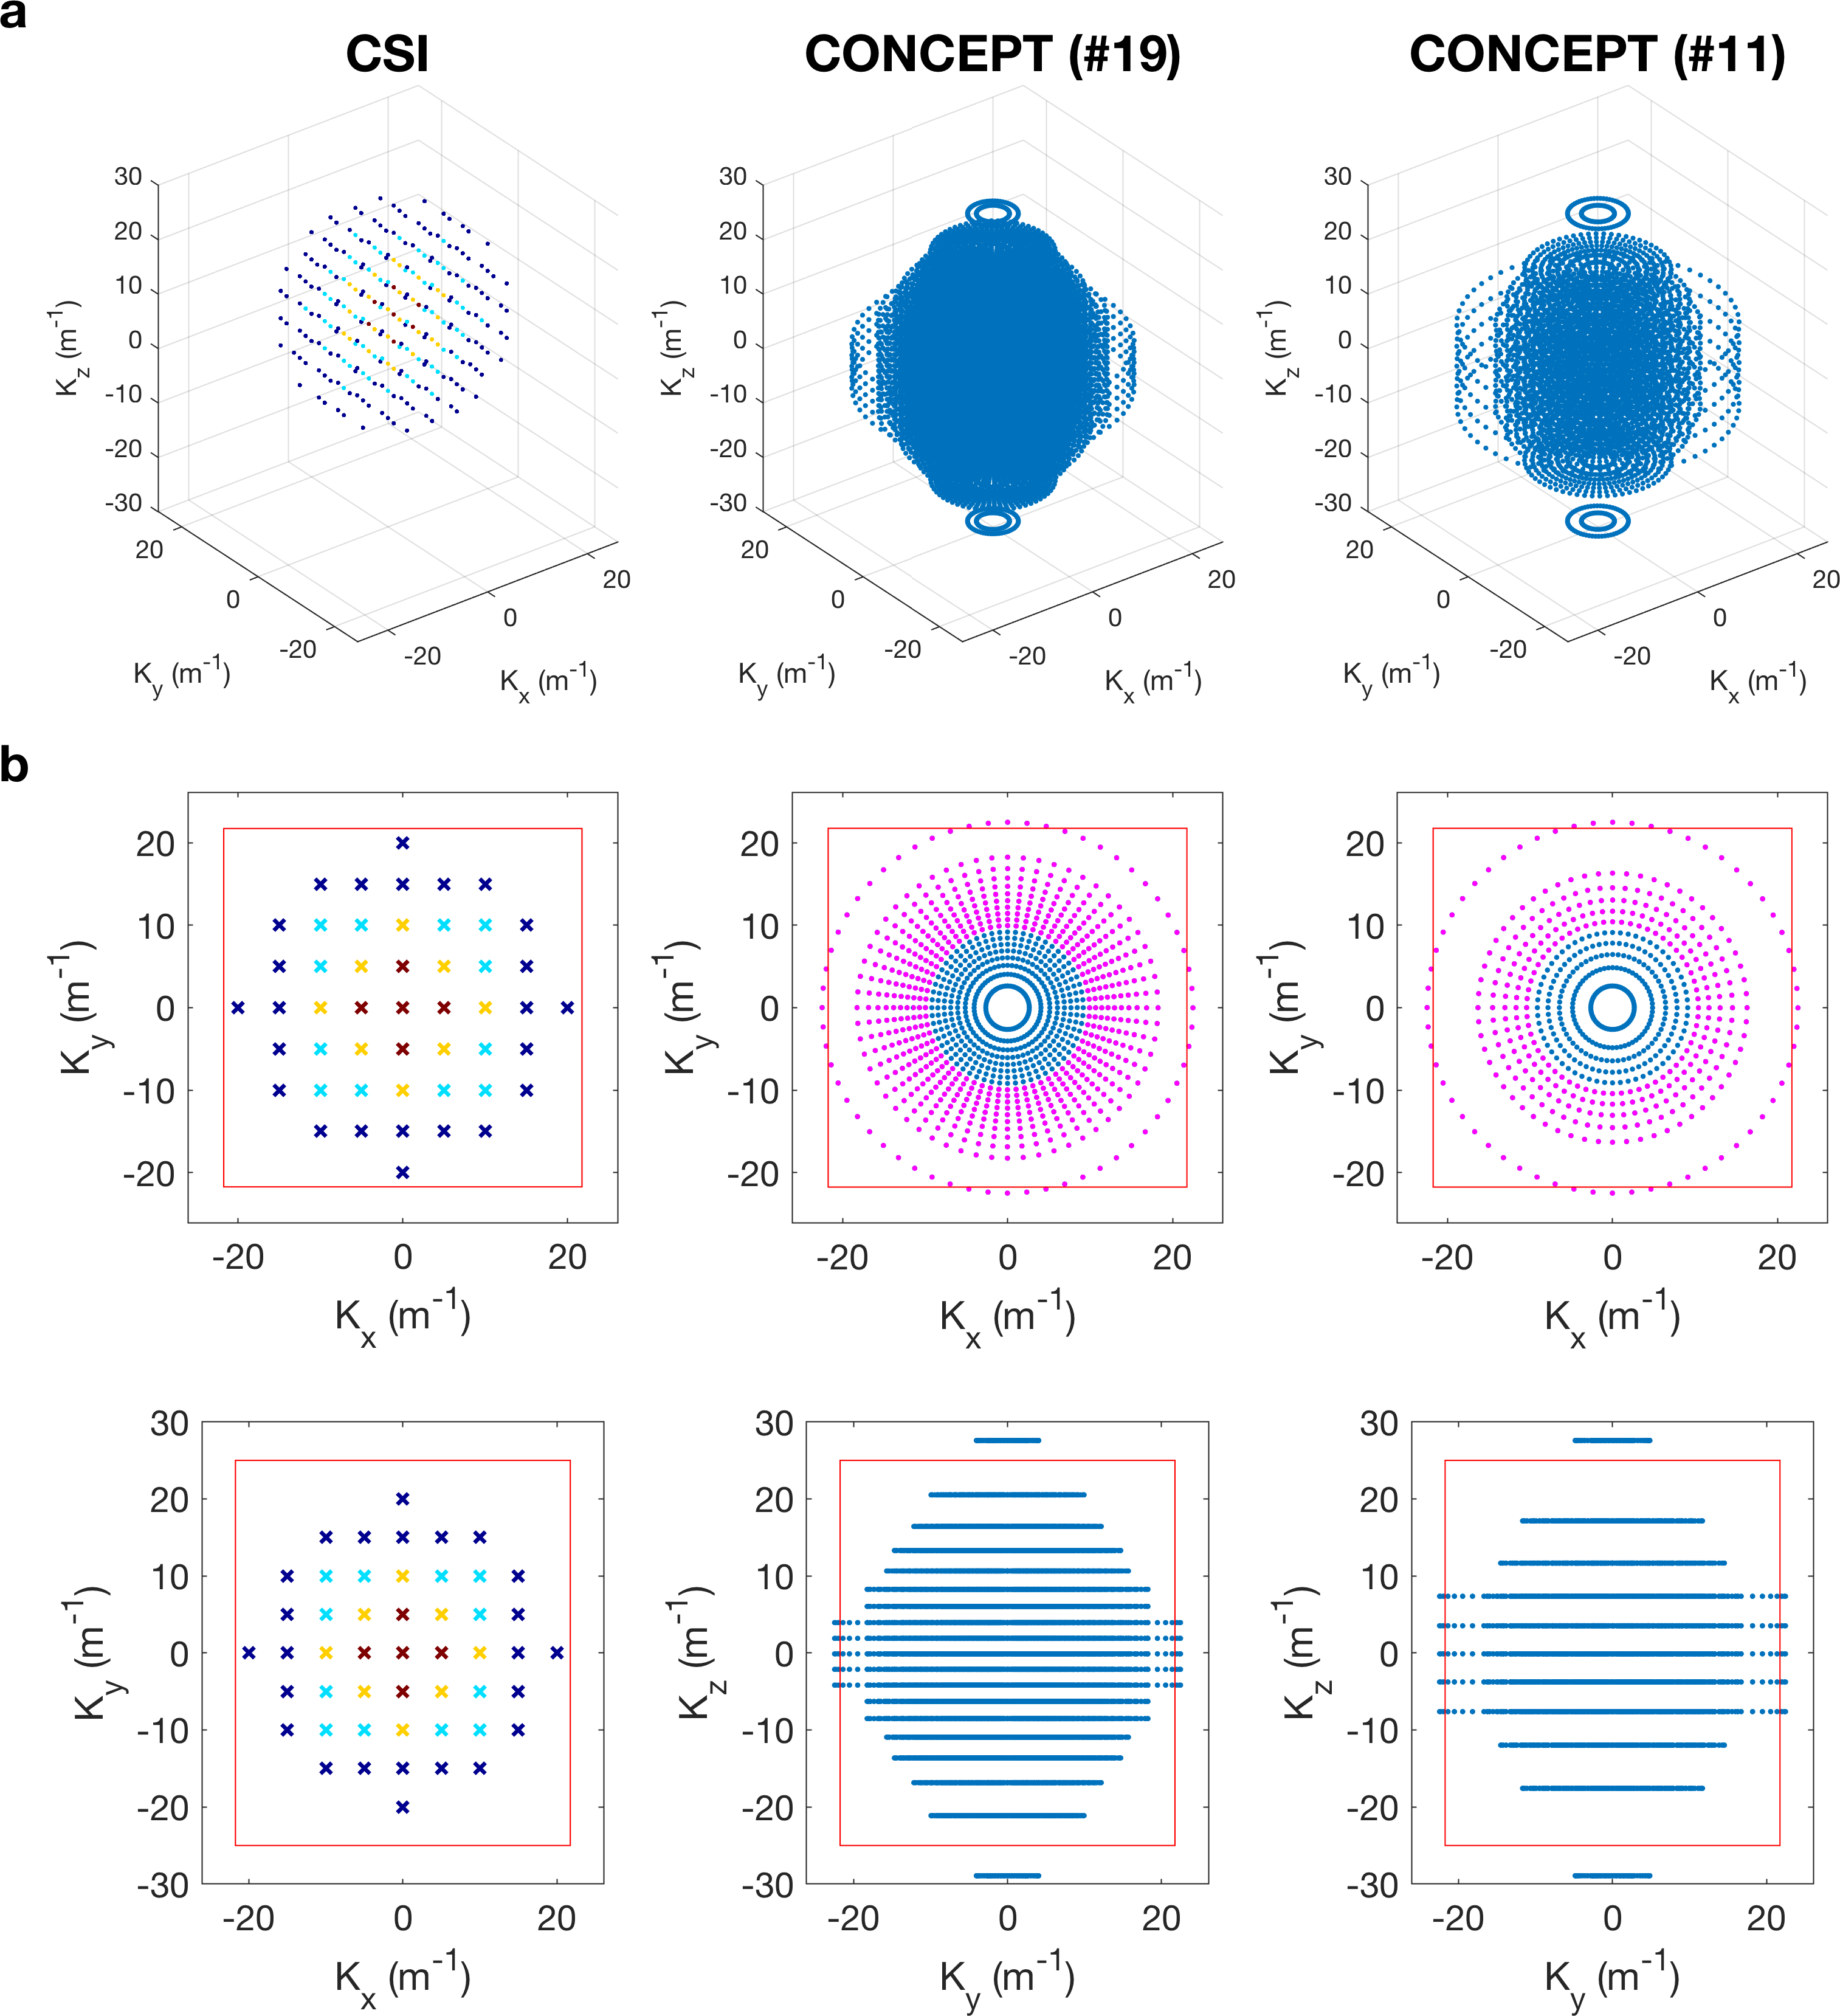
A previously published equidistant ring 3D CONCEPT sequence was modified by introducing Hamming window density-weighting in all spatial dimensions (10). Density was described in the kxy-plane by placing rings at given radii and in the kz-direction by changing inter-plane separation (Fig 1). The number of rings in each plane was reduced to elliptically sample k-space in the kz-direction. The number of points in each ring was constant. By varying the number of rings and z-direction partitions while keeping the maximum k-space coverage identical, total acquisition time could be modulated. Excitation was achieved using a 2.4 ms shaped constant-phase pulse placed at 250 Hz (i.e., 5.0 ppm) relative to phosphocreatine (PCr) to ensure a uniform flip angle from phosphoethanolamine (PE) (at ∼6 ppm) to β‐ATP (at ∼−16 ppm).Three subjects (3M, 25±4 years, 75±14 kg) were scanned using a Siemens 3T Trio (Erlangen, Germany) equipped with a dual tuned 31P/1H birdcage head coil (Rapid Biomedical GmbH, Rimpar, Germany). Each subject was scanned using a previously described CSI sequence (9) with a matrix size 10x10x10 (5&1 averages, 7:38 min & 4:18 min). Then the CONCEPT sequence was repeated five times with a matched matrix (20, 16, 14, 12 and 10 rings/partitions; 7:25, 4:21, 3:01, 2:00 and 1:07 mins). FoV was 230x230x200 mm3, TR was 1 s, and the bandwidth was 4000 Hz with 1024 time-samples for the CSI and 2000 Hz with 522 samples for the CONCEPT. After 1H localisation scans and before the 31P MRSI scans, B0 shimming was conducted placing the shim volume over the parietal lobe, i.e. targeting the sensorimotor cortex in the first subject and over the whole cerebrum in subjects two and three.
CSI reconstruction was performed online in ICE, CONCEPT data were reconstructed offline using the non‐uniform FFT (NUFFT) toolbox with min‐max Kaiser‐Bessel kernel interpolation and twofold oversampling (11) in MATLAB (MathWorks, Natick, MA, USA). No density compensation is required. Final CSI/MRSI data fitting was performed using the OXSA toolbox (12).
Sequences were compared based on (saturation un-corrected) PCr/ATP ratios and pH measurements calculated from the Pi to PCr chemical shift. The first subject’s scan data was masked to include only voxels from the shimmed area, i.e. sensory-motor cortex. The second and third subjects’ data was masked using FSL Bet (13).
Results
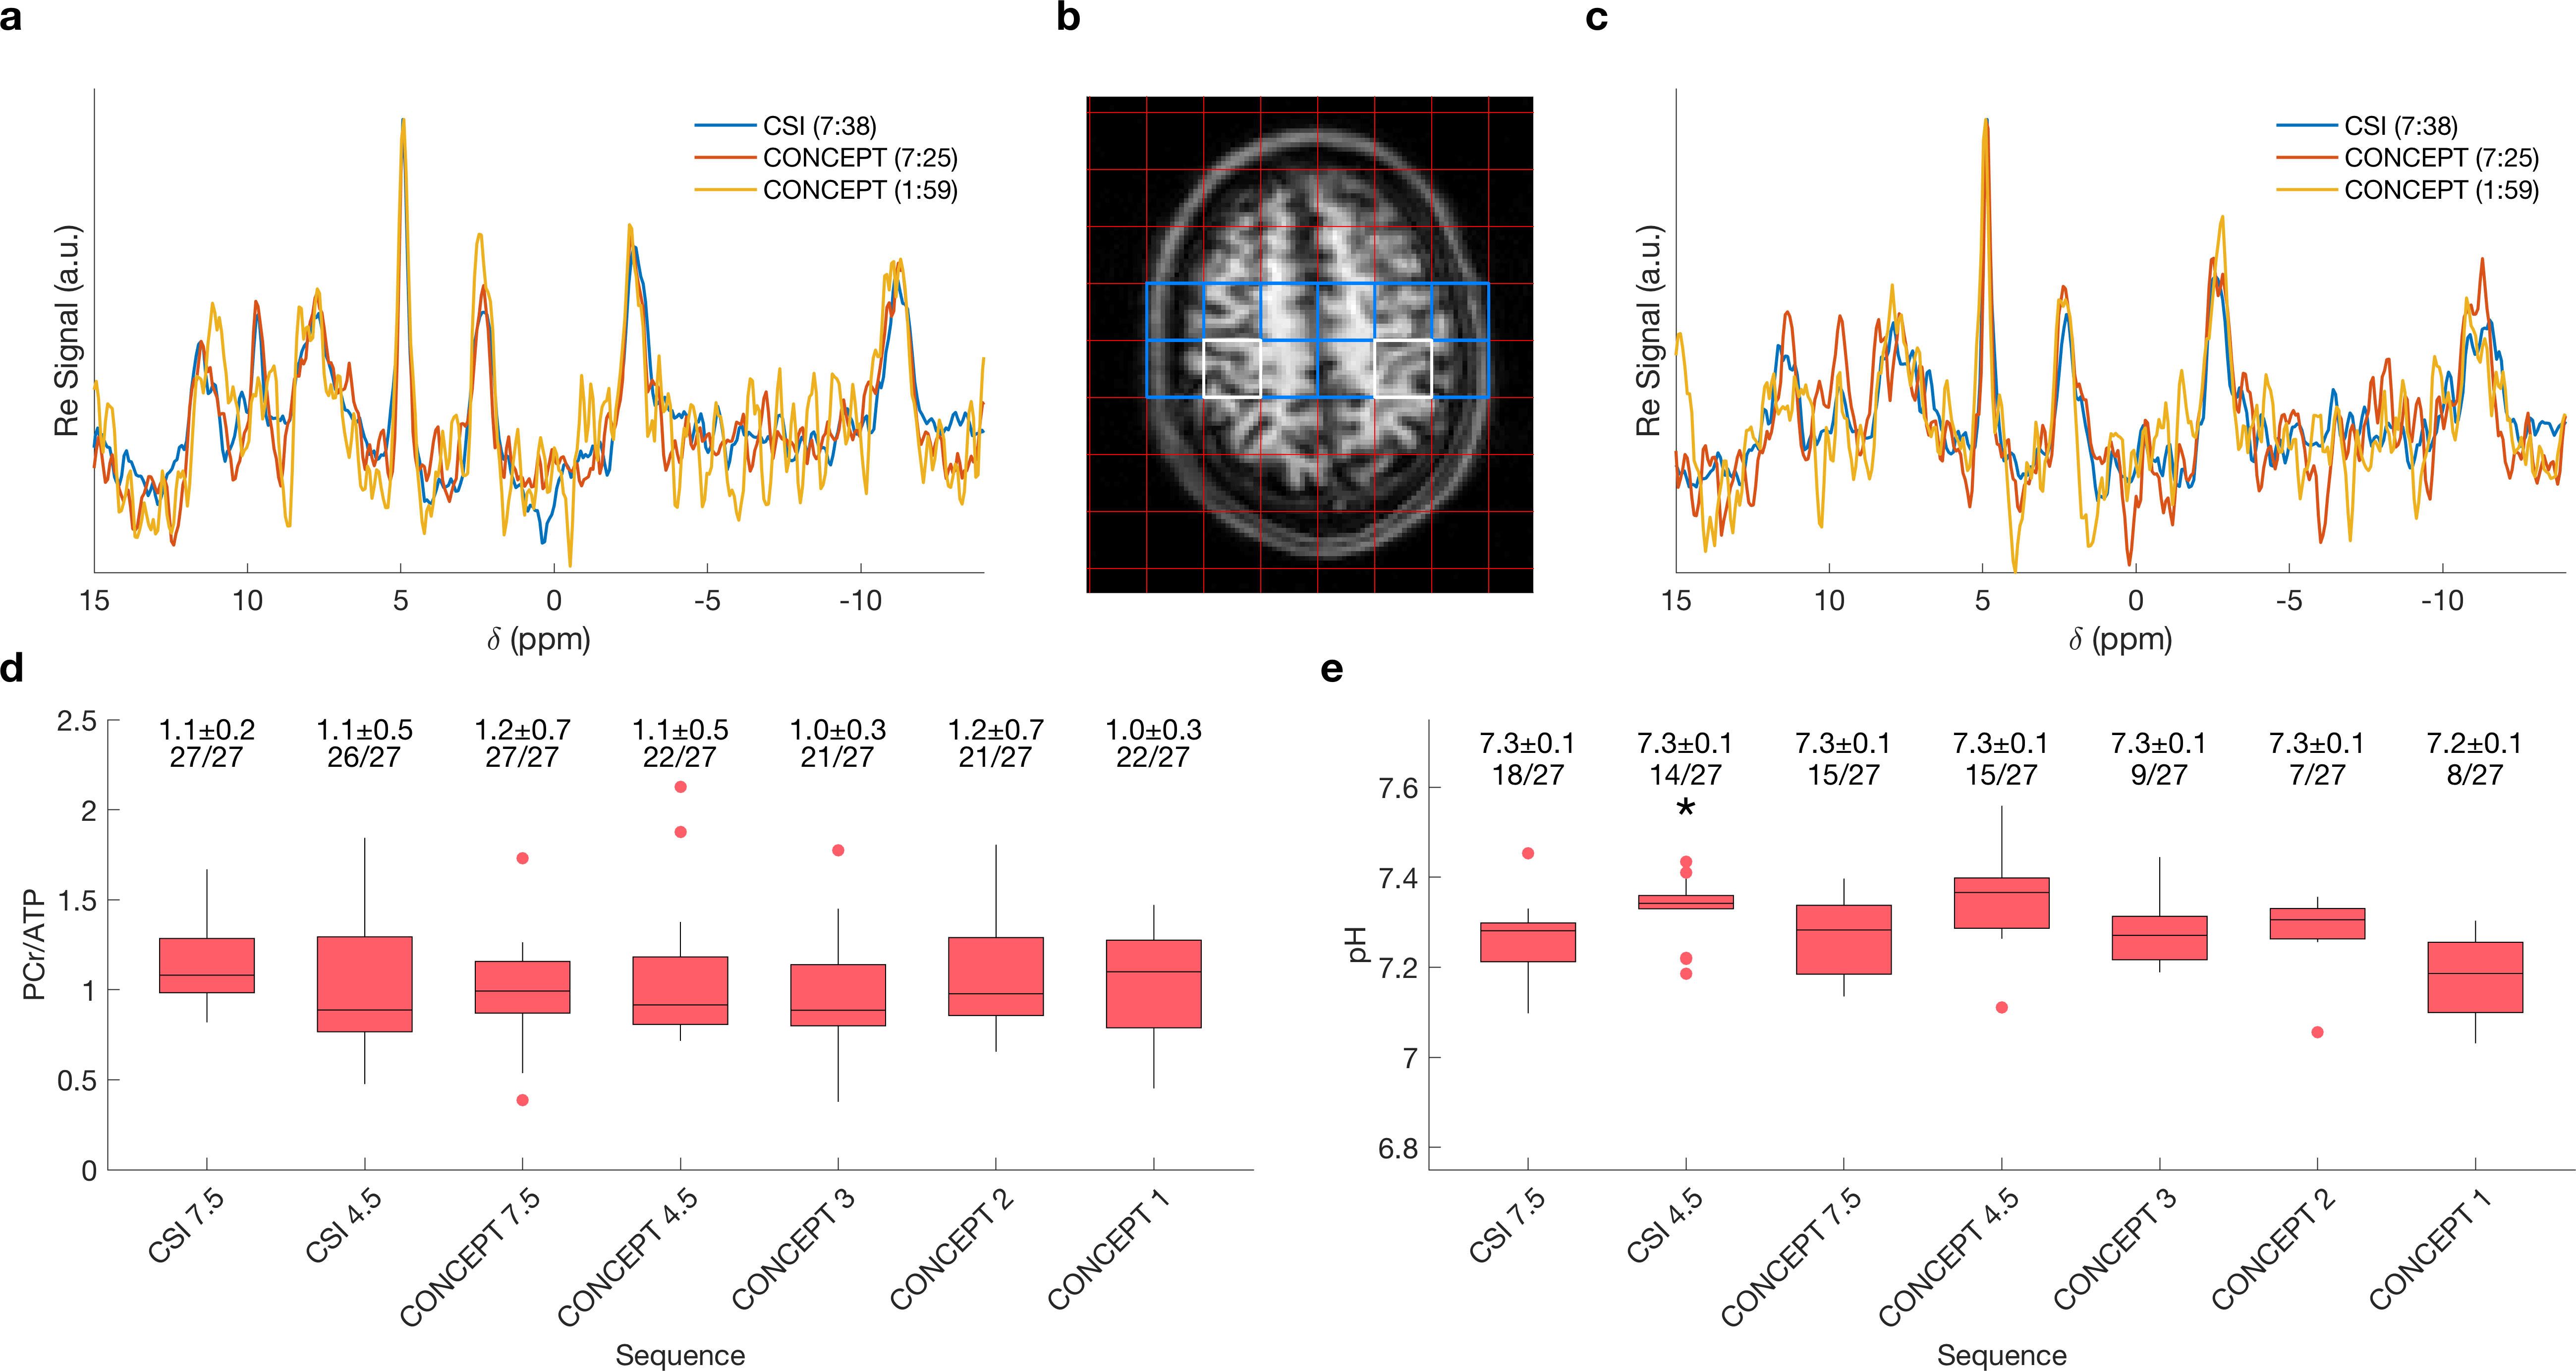
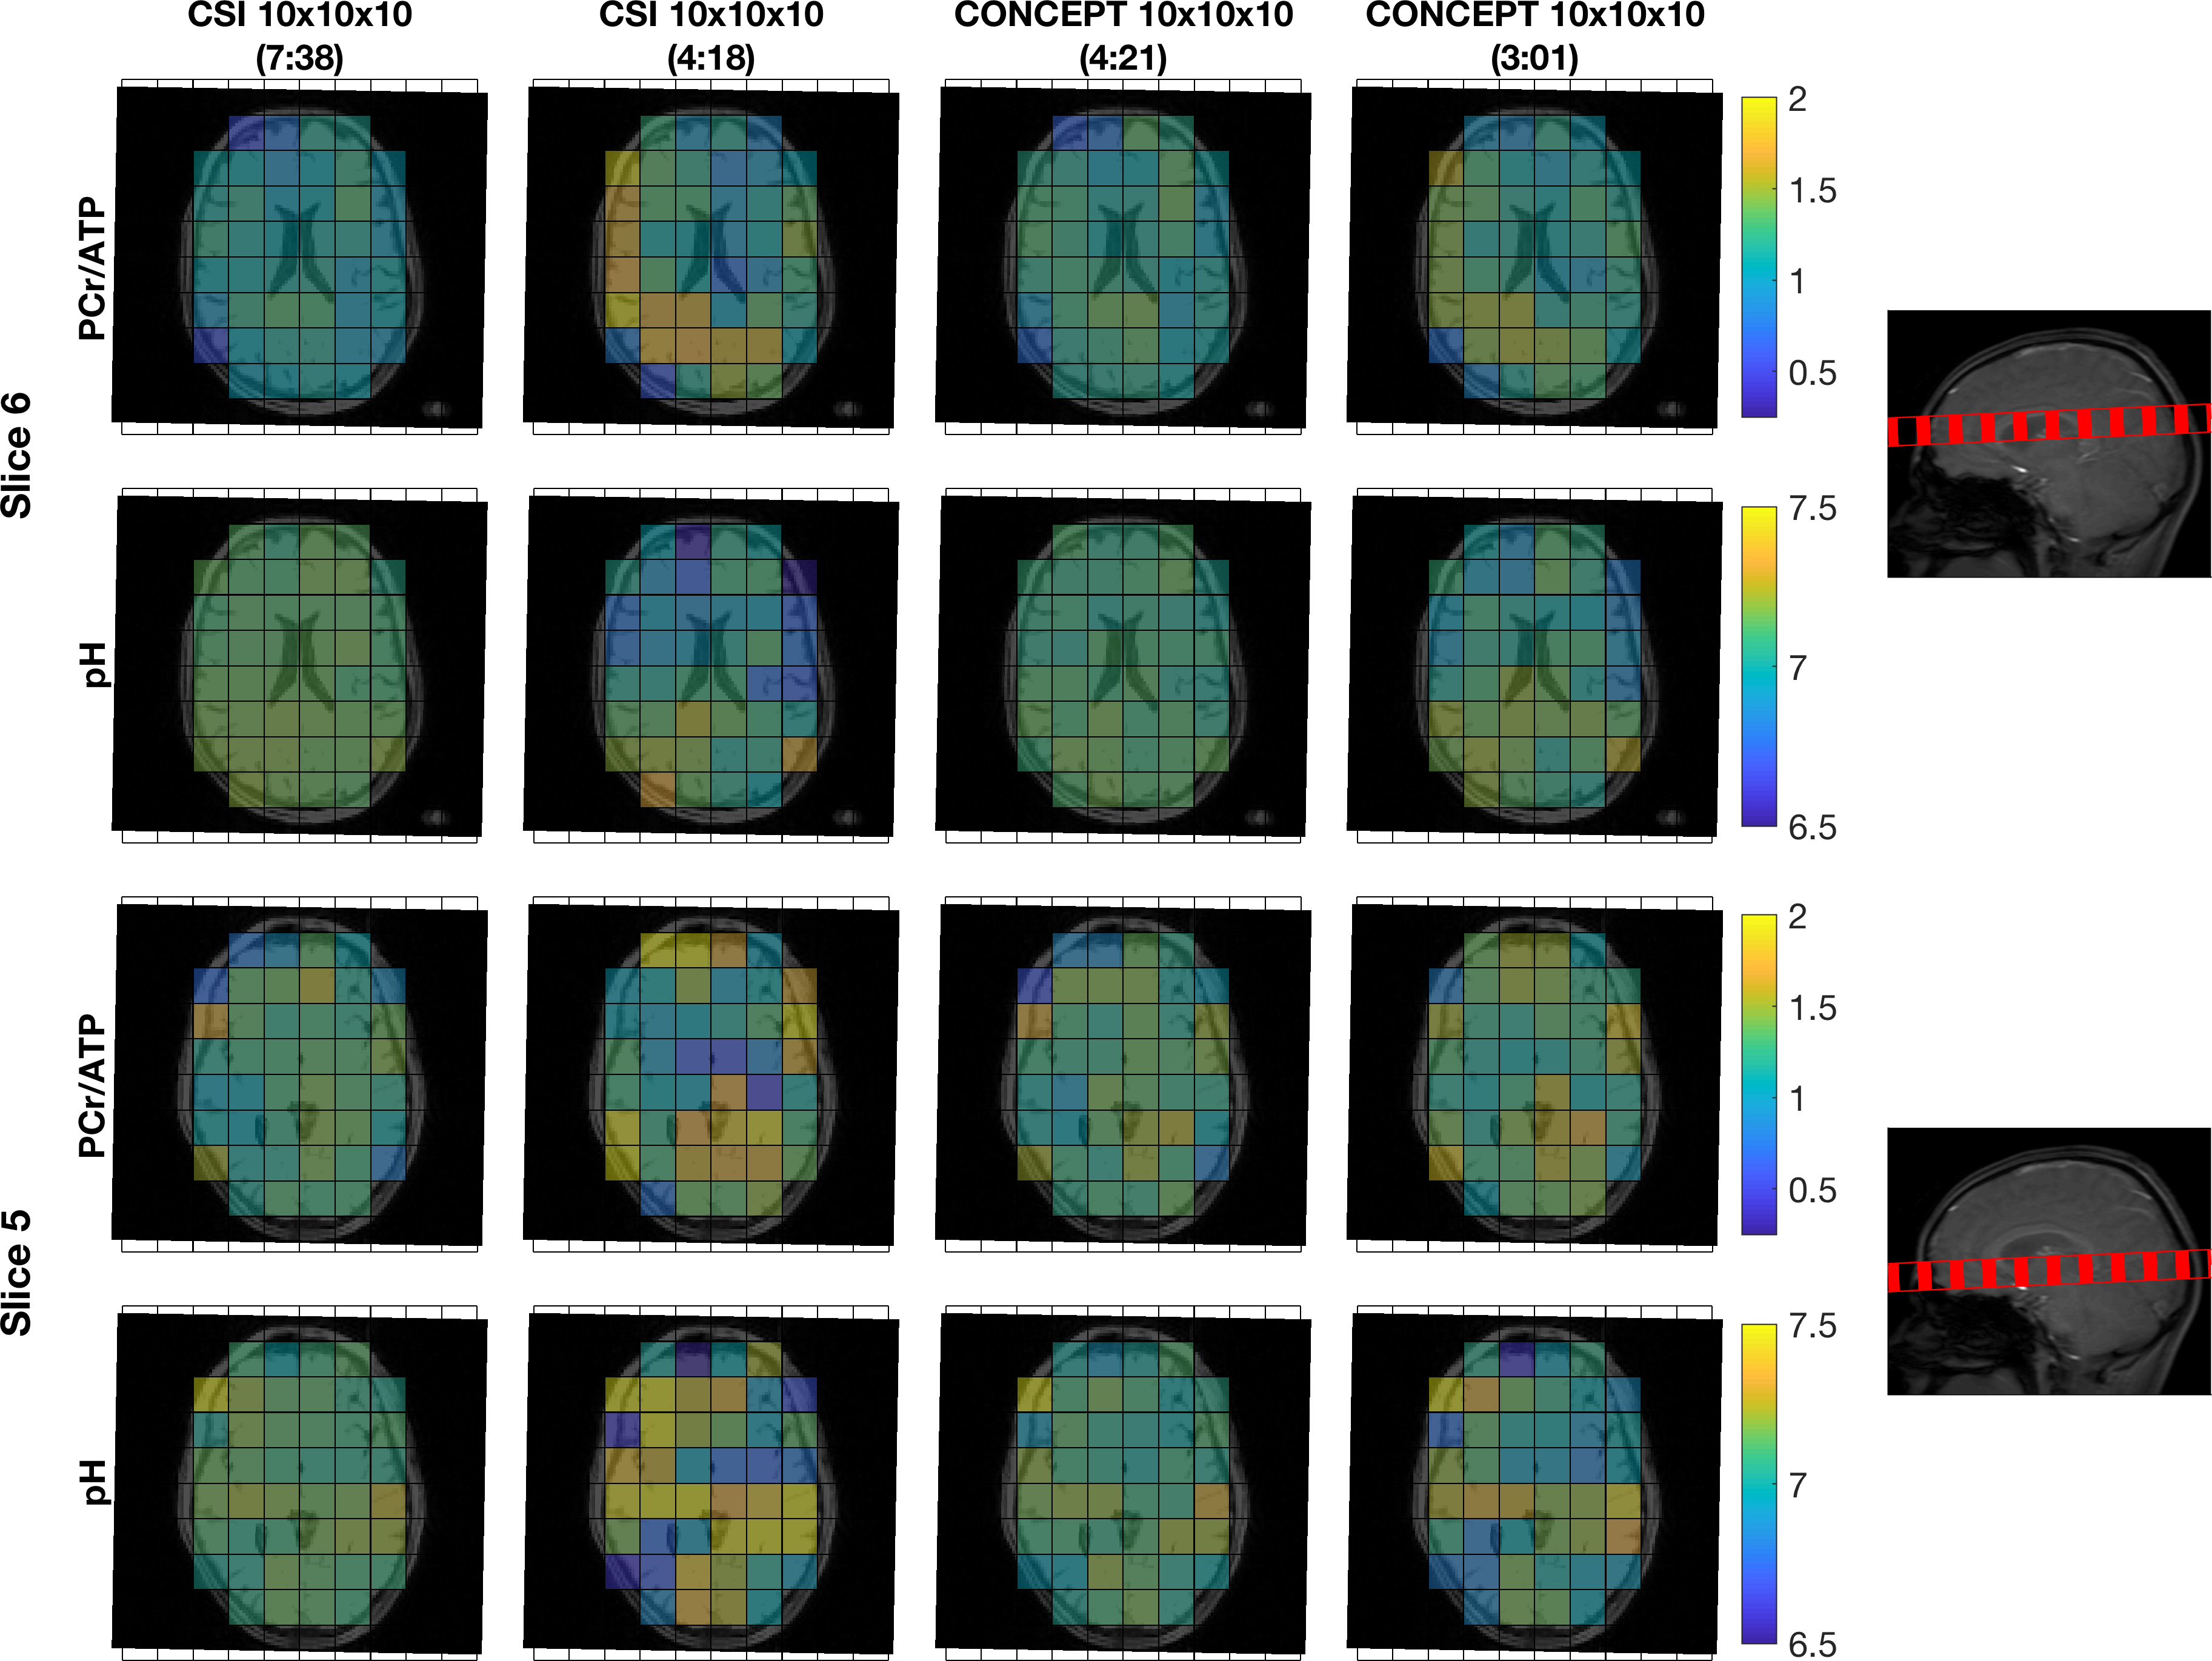
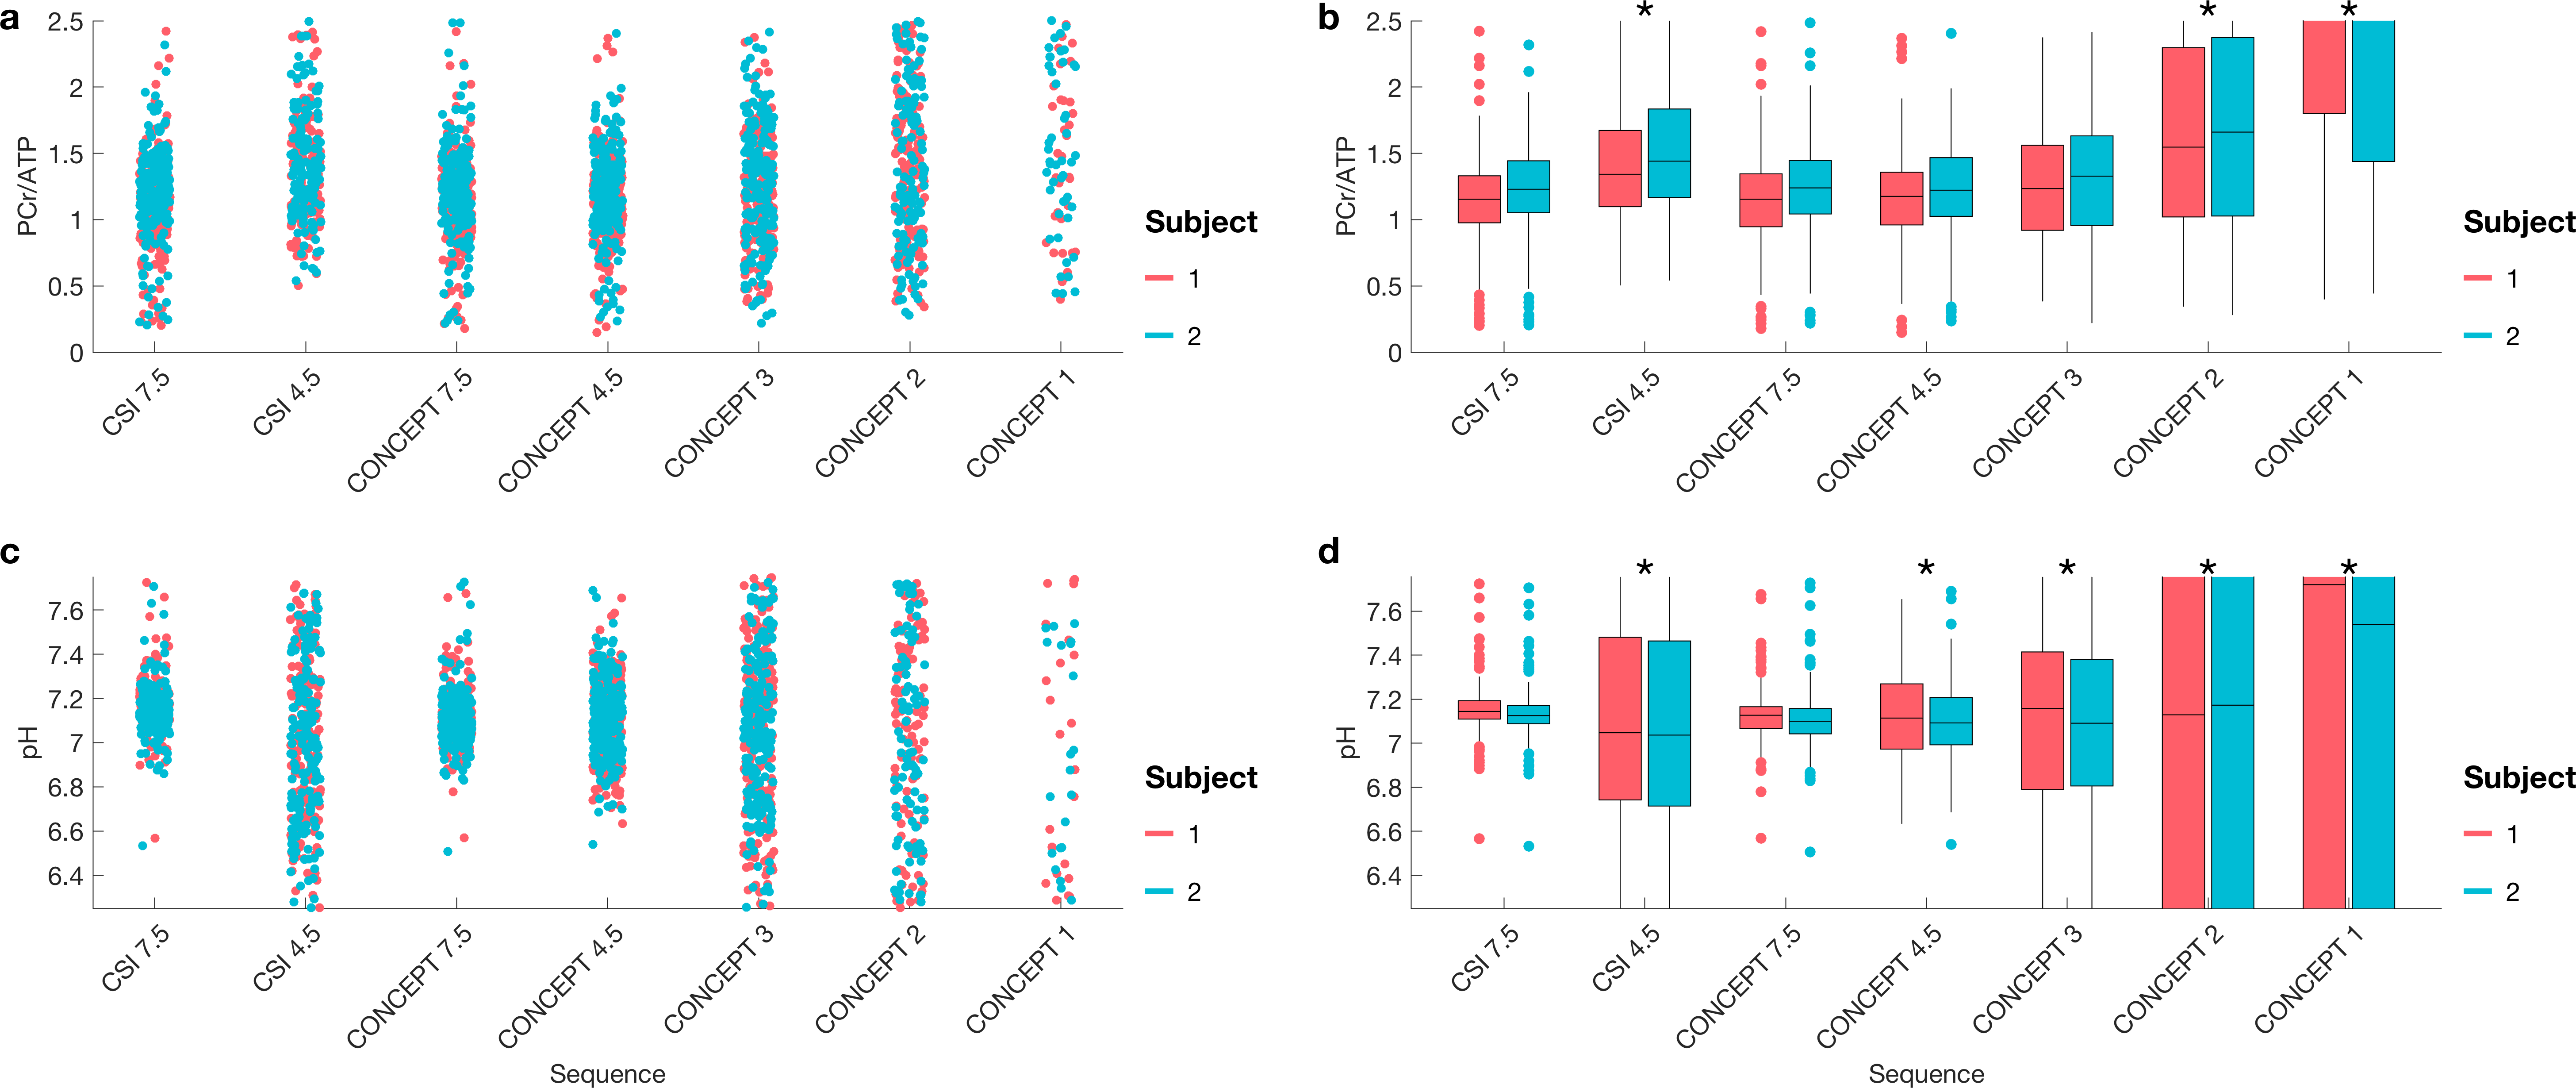
In the first subject, the distribution of PCr/ATP ratios measured in sensorimotor cortex voxels (Fig 2b) by any duration CONCEPT sequence did not significantly (Wilcoxon Signed Rank test, p>0.09) diverge from the reference values of the 7:38 minute CSI. In the shorter sequences (≤3min) the variance increased, and number of voxels excluded due to CRLB >30% was higher (Fig 2d). Though the distribution of pH measurements never significantly differed from the reference measurements at any duration, more than half of the voxels were excluded at ≤3min (Fig 2e).In the second and third subjects PCr/ATP ratio and pH maps from 4:21 minute and 3:01 minute CONCEPT appeared qualitatively comparable, unlike the 4:18 minute CSI, to the 7:38 minute CSI (Fig 3). Comparing whole brain PCr/ATP and pH distributions to the 7:38-minute CSI reference, CONCEPT showed no significant difference in PCr/ATP ratios at 7:25, 4:21 & 3:01 min, but only reproduced pH measurement with a matched time measurement (7:25 min).
Discussion
Density-weighted CONCEPT MRSI has been demonstrated for fast (4:21 & 3:01 min) 3D localised 31P-MRS of the brain at 3T using a single channel volume coil. This demonstrates that CONCEPT achieves the same quality of data in only 56% of the total scan time of a CSI sequence with matched voxel size. The performance of a matched time (4:21 min) CONCEPT sequence significantly exceeds that of the shortest possible CSI scan for a given TR. One-average CSI incurs an SNR penalty due to post-acquisition reweighting of k-space to reduce point-spread-function ripple.Either a 3:01 or 4:21-minute acquisition is short enough to apply repeatedly to monitor changes in energy metabolism in a dynamic stimulation experiment. Reproducibility of measurements will be assessed in future work.
Conclusion
A CONCEPT MRSI sequence is able to achieve measurements of the PCr/ATP ratio in the human brain in 3:01 minutes with a nominal voxel size of 10.6 mL at 3T.Acknowledgements
CTR and LV are funded by a Sir Henry Dale Fellowship from the Wellcome Trust [098436/Z/12/B]. The support of the Slovak Grant Agencies VEGA [2/0001/17] and APVV [#15–0029] is also gratefully acknowledged. The Wellcome Centre for Integrative Neuroimaging is supported by core funding from the Wellcome Trust (203139/Z/16/Z).References
1. Zhu XH, Qiao H, Du F, Xiong Q, Liu X, Zhang X, Ugurbil K, Chen W. Quantitative imaging of energy expenditure in human brain. Neuroimage 2012;60(4):2107-2117.
2. Stagg CJ, Nitsche MA. Physiological basis of transcranial direct current stimulation. Neuroscientist 2011;17(1):37-53.
3. Rae CD, Lee VH, Ordidge RJ, Alonzo A, Loo C. Anodal transcranial direct current stimulation increases brain intracellular pH and modulates bioenergetics. Int J Neuropsychopharmacol 2013;16(8):1695-1706.
4. Zhu XH, Lu M, Chen W. Quantitative imaging of brain energy metabolisms and neuroenergetics using in vivo X-nuclear (2)H, (17)O and (31)P MRS at ultra-high field. J Magn Reson 2018;292:155-170.
5. Pohmann R, von Kienlin M, Haase A. Theoretical evaluation and comparison of fast chemical shift imaging methods. J Magn Reson 1997;129(2):145-160.
6. Chiew M, Jiang W, Burns B, Larson P, Steel A, Jezzard P, Albert Thomas M, Emir UE. Density-weighted concentric rings k-space trajectory for (1) H magnetic resonance spectroscopic imaging at 7 T. NMR Biomed 2018;31(1).
7. Hingerl L, Bogner W, Moser P, Povazan M, Hangel G, Heckova E, Gruber S, Trattnig S, Strasser B. Density-weighted concentric circle trajectories for high resolution brain magnetic resonance spectroscopic imaging at 7T. Magn Reson Med 2018;79(6):2874-2885.
8. Greiser A, von Kienlin M. Efficient k-space sampling by density-weighted phase-encoding. Magn Reson Med 2003;50(6):1266-1275.
9. Robson MD, Tyler DJ, Neubauer S. Ultrashort TE chemical shift imaging (UTE-CSI). Magn Reson Med 2005;53(2):267-274.
10. Hingerl L, Strasser B, Moser P, Považan M, Hangel G, Heckova E, Gruber S, Trattnig S, Bogner W. Towards Full-Brain FID-MRSI At 7T With 3D Concentric Circle Readout Trajectories. 2018; Proc. Intl. Soc. Mag. Reson. Med. 26, Paris. p 618.
11. Fessler JA, Sutton BP. Nonuniform fast Fourier transforms using min-max interpolation. Ieee T Signal Proces 2003;51(2):560-574.
12. Purvis LAB, Clarke WT, Biasiolli L, Valkovic L, Robson MD, Rodgers CT. OXSA: An open-source magnetic resonance spectroscopy analysis toolbox in MATLAB. PLoS One 2017;12(9):e0185356.
13. Smith SM. Fast robust automated brain extraction. Hum Brain Mapp 2002;17(3):143-155.
Figures