2972
Probing Creatine Phosphorylation in Human Brain by Combining Phosphorus and Proton MRS
Shizhe Li1, Jan Willem van der Veen1, JoEllyn Stolinski1, Christopher Johnson1, Maria Ferraris-Araneta1, Milalynn Victorino1, and Jun Shen1
1National Institutes of Health, Bethesda, MD, United States
1National Institutes of Health, Bethesda, MD, United States
Synopsis
Cerebral creatine is affected by many CNS disorders. Combining phosphorus and proton MRS to evaluate both phosphocreatine and creatine may provide important insight into brain energetics associated with abnormal creatine levels as the creatine kinase reaction is strongly coupled to energy metabolism in the CNS. Here we show that the PCr to total phosphate ratio is highly immune to T1 saturation effect. By combining phosphorus and proton MRS of healthy subjects we demonstrate that it is feasible to characterize creatine phosphorylation with high immunity to T1 saturation.
INTRODUCTION
Cerebral creatine is affected by many CNS disorders including cerebral creatine deficiencies1 and many age-related neurological diseases such as Parkinson's disease and amyotrophic lateral sclerosis2. Since creatine and its phosphorylation play a central role in CNS energy metabolism combining phosphorus and proton MRS to measure both phosphocreatine and creatine may provide important insights into phosphorylation and functional energetics in brain disorders. For phosphorus MRS, a phosphorus transceiver coil is often necessary to obtain optimal SNR, which, however, complicates quantification of phosphocreatine due to the large B1 inhomogeneity of the surface transceiver coil. Although metabolites in proton MRS have almost uniform T1s3 there is a wide dispersion in T1s across phosphorus MRS signals4. In this study we aim to evaluate the T1-dependence of ratiometric parameters involving PCr and to establish optimal experimental parameters for studying phosphorylation of creatine in many brain disorders involving abnormal creatine levels such as creatine transporter deficiency5.METHODS
Hardware: The study was performed on a Siemens 3T scanner. 31P MRS was performed using a home-built coil assembly with a quadrature half-volume 1H coil and a 7-cm 31P surface coil. 1H MRS was acquired using a Siemens 20-channel volume head coil.31P MRS: B0 field was shimmed over a voxel of 4 x 4 x 4 cm3 in the occipital lobe anterior to the 31P coil. Typical water linewidth (full width half maximum) from the 64 cm3 cubical voxel was 15-17 Hz. A Siemens FID sequence was used to acquire 31P spectra with a hard pulse length = 500 μs, SW = 5 kHz, data points = 1024, NA = 128 when TR was set to 2 s, and NA = 64 when TR was set to 25 s. No nuclear Overhauser enhancement or 1H decoupling was applied.
1H MRS: B0 field shimming for 1H MRS was performed in the same 4 x 4 x 4 cm3 voxel as that selected for 31P MRS in the occipital lobe. Localized 1H spectra were acquired from an occipital lobe voxel of 2 x 2 x 2 cm3 at the center of the shim voxel. TR = 2 s, SW = 2 kHz, data points = 2048, NA = 128. Spectra were acquired at TE = 30 ms and 135 ms, respectively.
Data processing: The 31P spectra were fitted with jMRUI6 with additional prior knowledge of 31P metabolites7. Total ATP (tATP) and total phosphate (t31P) were calculated by summing the peak intensity of all ATP peaks and all phosphate components, respectively. The ratio of PCr to total ATP (PCr/tATP) and the ratio of PCr to total phosphate (PCr/t31P) were evaluated. The 1H data were fitted using LCModel 6.3-1J8 for the data acquired at 30 ms echo time. With the fitted 1H data the ratio of total creatine to NAA (tCr/NAA) was calculated. To evaluate T1 saturation of phosphocreatine at our experimental settings phosphorus signals acquired at TR = 2 s and TR = 25 s were compared quantitatively.
RESULTS
Fig. 1 demonstrates the T1 saturation effect of 31P spectra acquired from a healthy subject at TR = 2 s (A) and 25 s (B). The signal intensity of most metabolites was significantly enhanced at the longer TR. The increase in PE, GPE and PCr is very prominent. Localized 1H spectra are shown in Fig. 2 at TE = 135 ms (A) and 30 ms (B).The ratio of PCr to total ATP (PCr/tATP) and the ratio of PCr to total phosphate (PCr/t31P) measured from healthy subjects are summarized in Table 1. The ratios of PCr/tATP and PCr/t31P in Table 1 are in good agreement with literature reports9. By measurements at TR = 2 s and 25 s the PCr/t31P ratio was found to be less affected by T1 saturation than that of PCr/tATP. Because the T1 of creatine and NAA at 3T are nearly identical3, the T1 saturation effect is not expected to affect the tCr/NAA ratio. Therefore, by combining phosphorus and proton MRS the ratiometric parameter (PCr/t31P)/(tCr/NAA) and/or (PCr/t31P)/(tCr/H2O) can be used to assess creatine phosphorylation in, for example, cerebral creatine deficiencies which are characterized by a large decrease in the tCr/NAA ratio10. Values of the (PCr/t31P)/(tCr/NAA) ratio for healthy subjects are listed in Table 2.
DISCUSSION
For brain disorders involving abnormal creatine levels the concentration of ATP is not an ideal reference as ATP and PCr are linked by the creatine kinase equilibrium and a reduction in tCr and/or PCr is expected to shift the equilibrium. Therefore, total phosphate (t31P) that includes both PCr and ATP should serve as a more stable internal reference for evaluation of changes in PCr.In summary, the combination of large spatial B1 inhommogeneity generated by a 31P surface transceiver coil and the large T1 heterogeneity across 31P signals makes it essential to identify a robust ratiometric parameter to characterize creatine phosphorylation which is strongly coupled to brain energetics. In this report we found that the (PCr/t31P)/(tCr/NAA) ratio is highly immune to T1 saturation effects and may serve as a surrogate marker for characterizing creatine phosphorylation in brain disorders involving abnormal creatine levels such as cerebral creatine deficiencies.
Acknowledgements
The authors gratefully acknowledge the support of the Intramural Research Program of the National Institute of Mental Health, National Institutes of Health.References
- Clark JF, Cecil KM. Diagnostic methods and recommendations for the cerebral creatine deficiency syndromes. Pediatr Res. 2015;77:398-405.
- Smith RN, et al. A review of creatine supplementation in age-related diseases: more than a supplement for athletes. F1000Res. 2014;3:222-232.
- Knight-Scott J, et al. Effect of repetition time on metabolite quantification in the human brain in 1H MR spectroscopy at 3 Tesla. J Magn Reson Imaging. 2017;45:710-721.
- Hattingen E, et al. Combined 1H and 31P spectroscopy provided new insights into the pathobiochemistry of brain damage in multiple sclerosis. NMR Biomid. 2010;24:536-546.
- Cecil KM, et al. Irreversible brain creatine deficiency with elevated serum and urine creatine: a creatine transporter defect? Ann Neurol. 2001;49:401-404.
- Naressi A, et al. Java-based graphical user interface for the MRUI quantitation package. MAGMA. 2001;12:141-153.
- Deelchand DK, et al. Quantification of in vivo 31P NMR brain spectra using LCModel. NMR Biomed. 2015;28:633-641.
- Provencher SW. Estimation of metabolite concentrations from localized in vivo proton NMR spectra. Magn Reson Med. 1993;30:672-679.
- Jensen JE, et al. In vivo brain 31P-MRS: measuring the phospholipid resonances at 4 Tesla from small voxels. NMR Biomed. 2002;15:338-347.
- Mencarelli MA, et al. Creatine transporter defect diagnosed by proton NMR spectroscopy in males with intellectual disability. Am J Med Genet. Part A 2011;155:2446-2452.
Figures
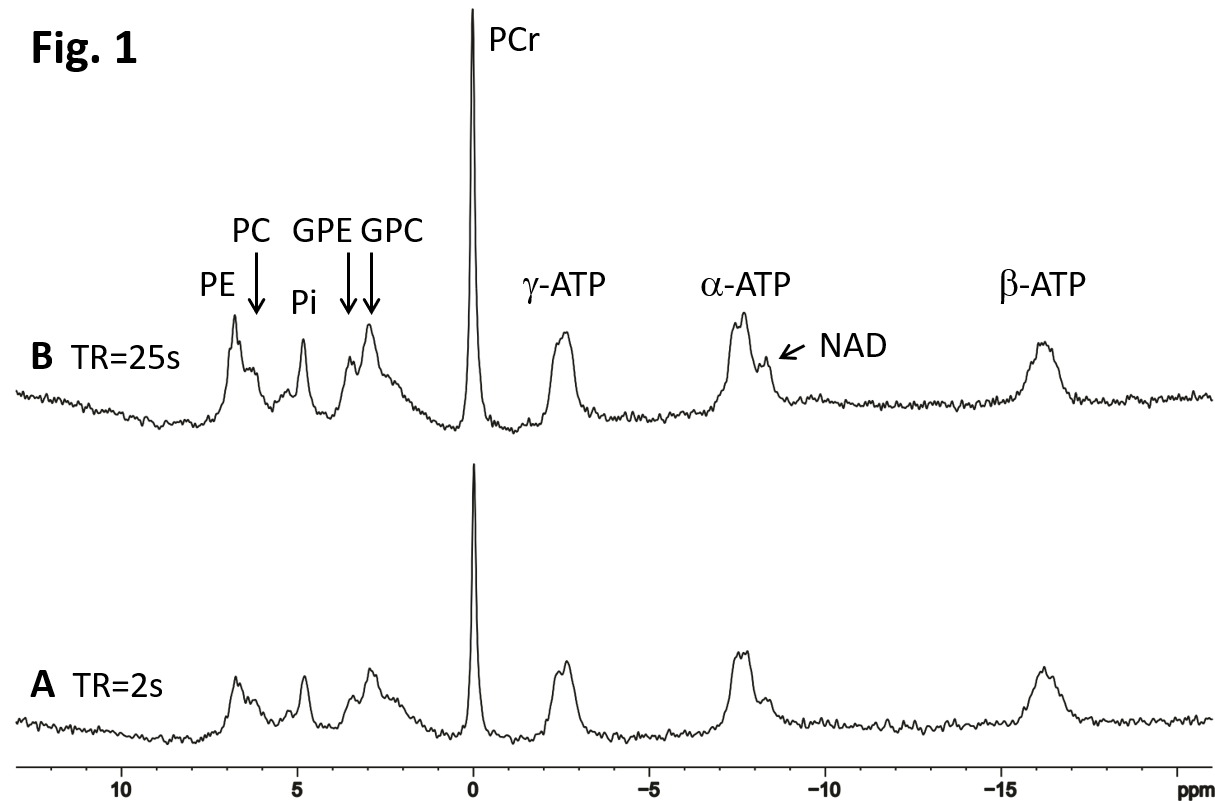
Fig. 1. Comparison of 31P MRS acquired in the occipital
lobe of a healthy subject at TR = 2 s (A), and TR = 25 s (B). NA = 128 for both
spectra. Signal intensity of metabolites in the unsaturated spectrum (B) is
generally higher than that in the partially saturated spectrum (A). The signal intensity
of GPE, PE and PCr is most affected by T1 saturation.
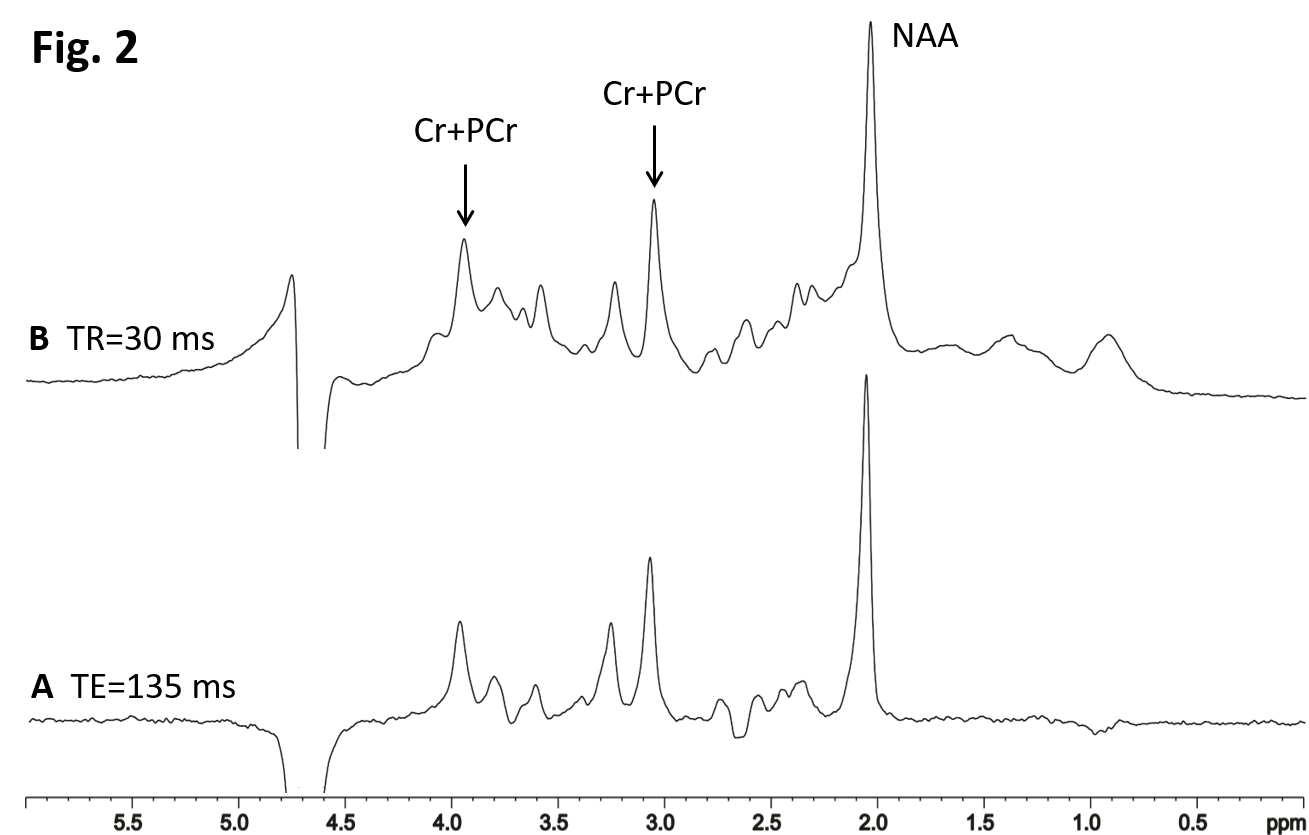
Fig. 2. Localized 1H spectra from a 2 x 2 x 2 cm3
voxel in the occipital lobe of a healthy volunteer at NA = 128, TR = 2 s, TE =
135 ms (A) and 30 ms (B). Signals from macromolecules were largely reduced at the
longer TE of 135 ms.

Table 1. The ratios of PCr/tATP and PCr/t31P
calculated from the fitted 31P spectra at TR = 2 s and 25 s, and the
ratio of tCr/NAA calculated from the fitted 1H spectra at TE = 30
ms.
* SD, standard deviation; ** The T1 saturation
factor (η) is defined as a ratio at TR = 25 s divided by the same
ratio at TR = 2 s.

Table 2. Ratios of
(PCr/tATP)/(tCr/NAA) and (PCr/t31P)/(tCr/NAA) calculated using the 31P
data obtained at TR = 2 s and 25 s.