2971
Neurodegenerative changes in the brain of Alzheimer’s mice investigated by high-field 1H-31P MRS and segmentation on high-resolution MRI1The Catholic University of Korea, Seoul, Republic of Korea, 2Gacheon University, Incheon, Republic of Korea
Synopsis
The aim of this study was to investigate morphological and metabolic changes in the brain of model mice with AD by using combined 1H-31P MRS and 3D T2 MRI in an integrated way. To investigate the AD-related metabolic changes, mean concentrations and /PCr relative ratios were compared between the groups for all major metabolites. In addition, a volumetric analysis was conducted on the volume of hippocampus, entorhinal cortex, and PFC between the groups. The AD-related changes in brain can be investigated by high-field and short-TE 1H MRS and high-resolution T2-weighted MRI in conjugate with the altas-based automatic brain segmentation.
Introduction
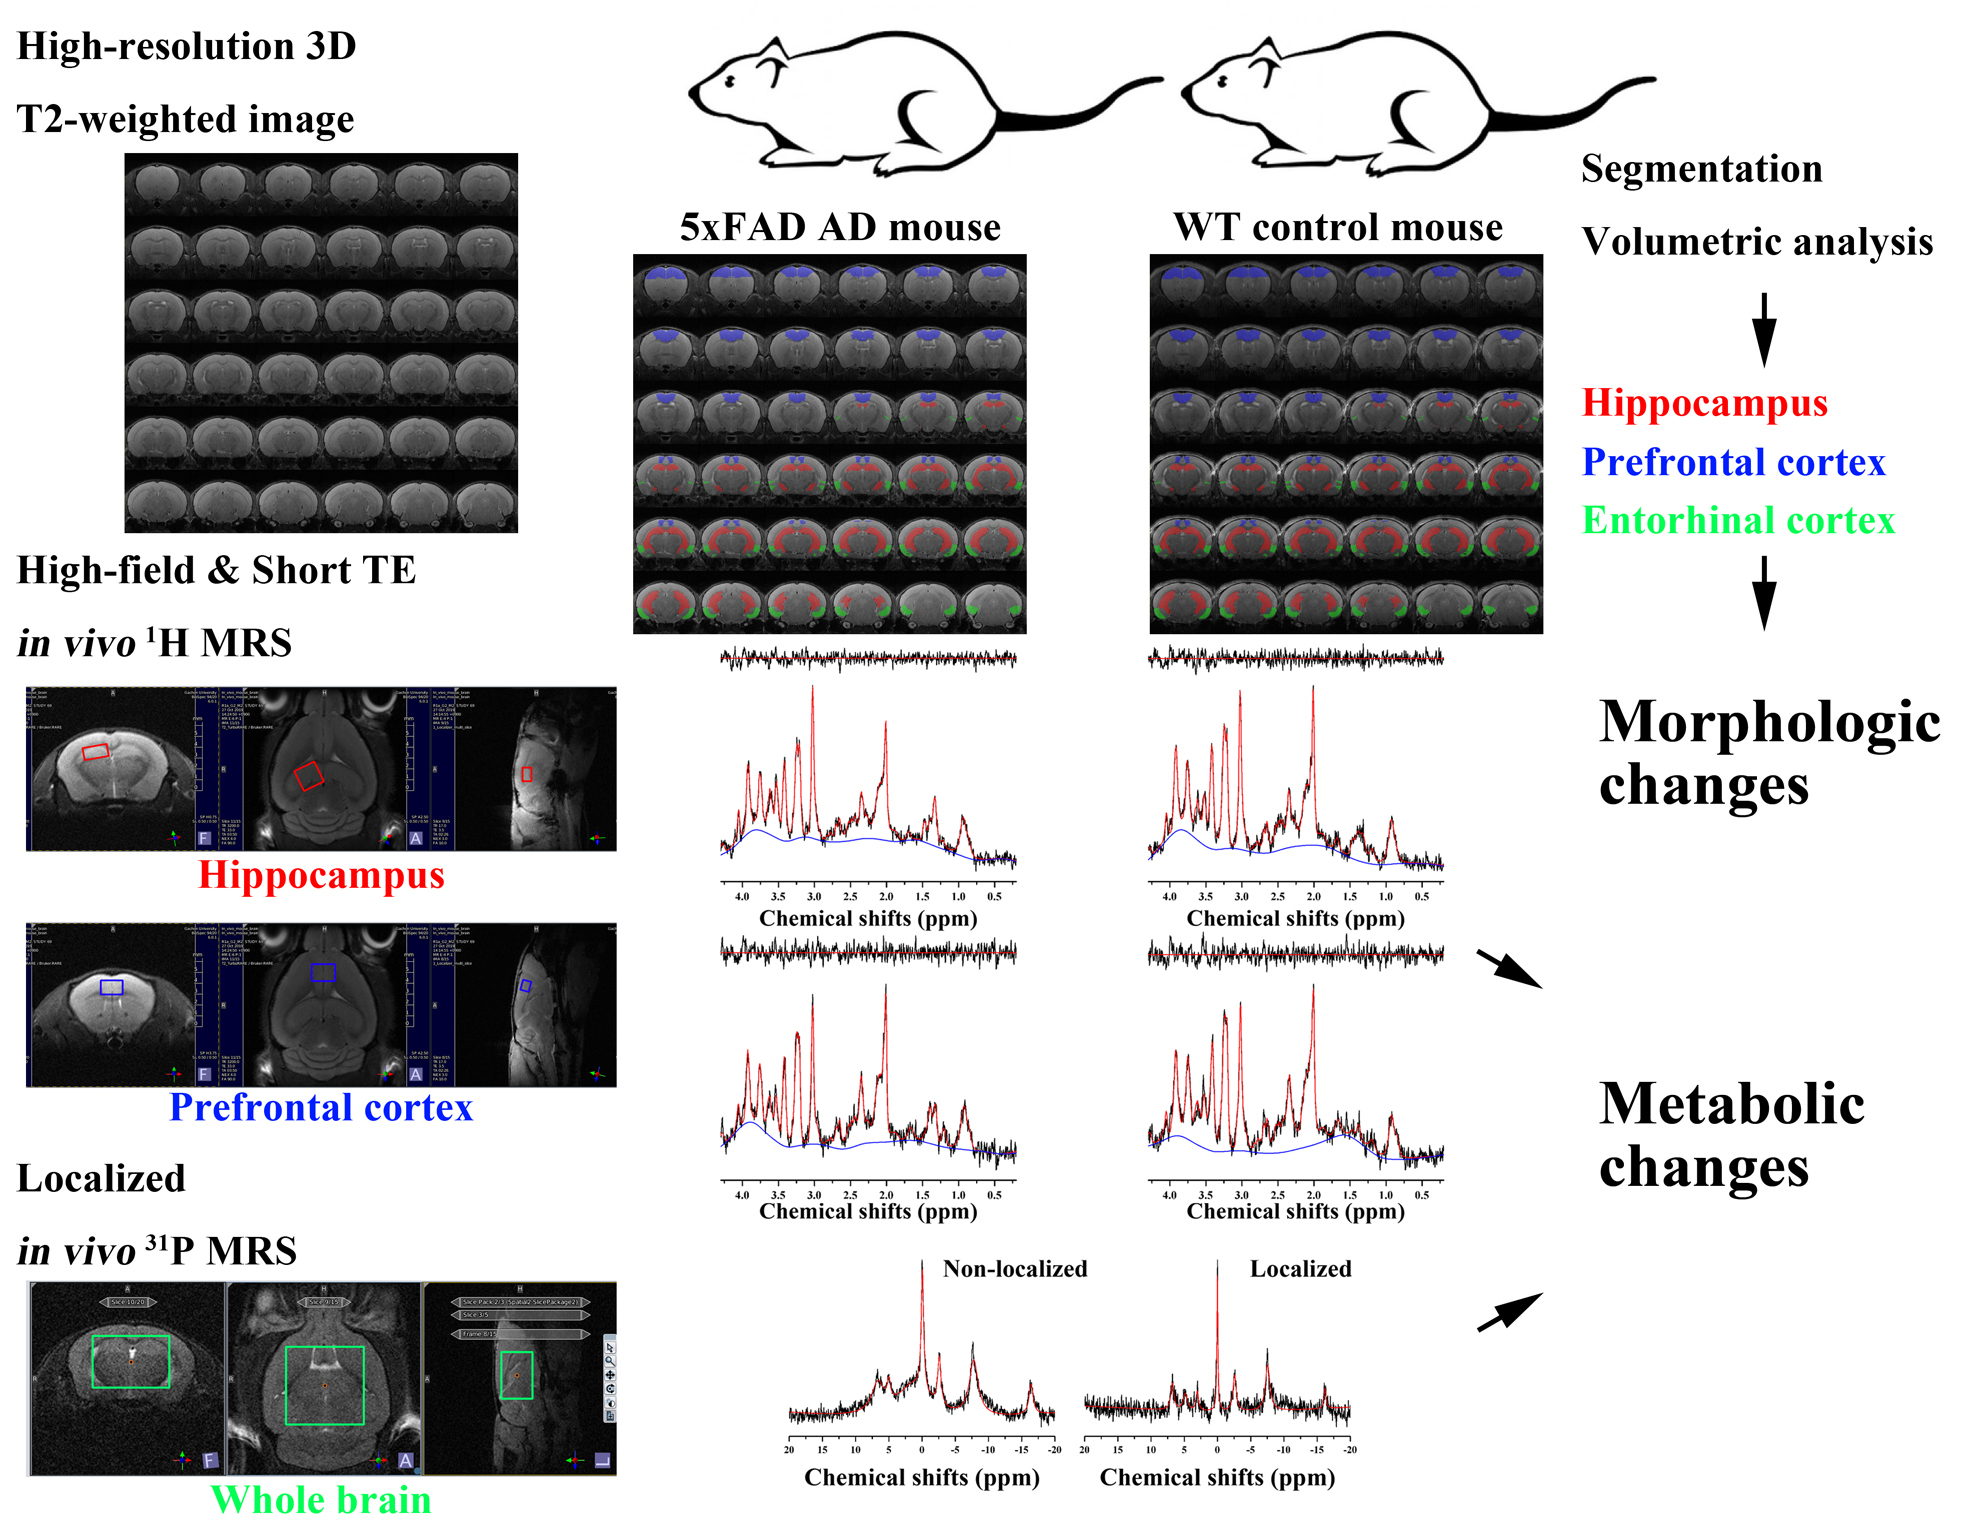
Previously, numerous studies have investigated disease-related changes in the brain of Alzheimer’s disease (AD) model animal using MRI and MRS. However, due to methodological differences between the studies, insights into neurodegenerative changes with respect to AD were challenging to be integrated from the results of separate studies. The aim of this study was to investigate morphological and metabolic changes in the brain of model mice with AD by using combined 1H-31P MRS and 3D T2 MRI in an integrated way. High-field and short-TE 1H MRS and localized 31P MRS were used for metabolic investigation, and high-resolution T2-weighted MRI in conjugate with the altas-based automatic brain segmentation were used for the morphologic investigation. By integrating quantification of metabolites with multi-nuclei MRS and volumetric analysis, pathophysiological insights into AD-related changes were expected to be clearly elucidated.Materials and Methods
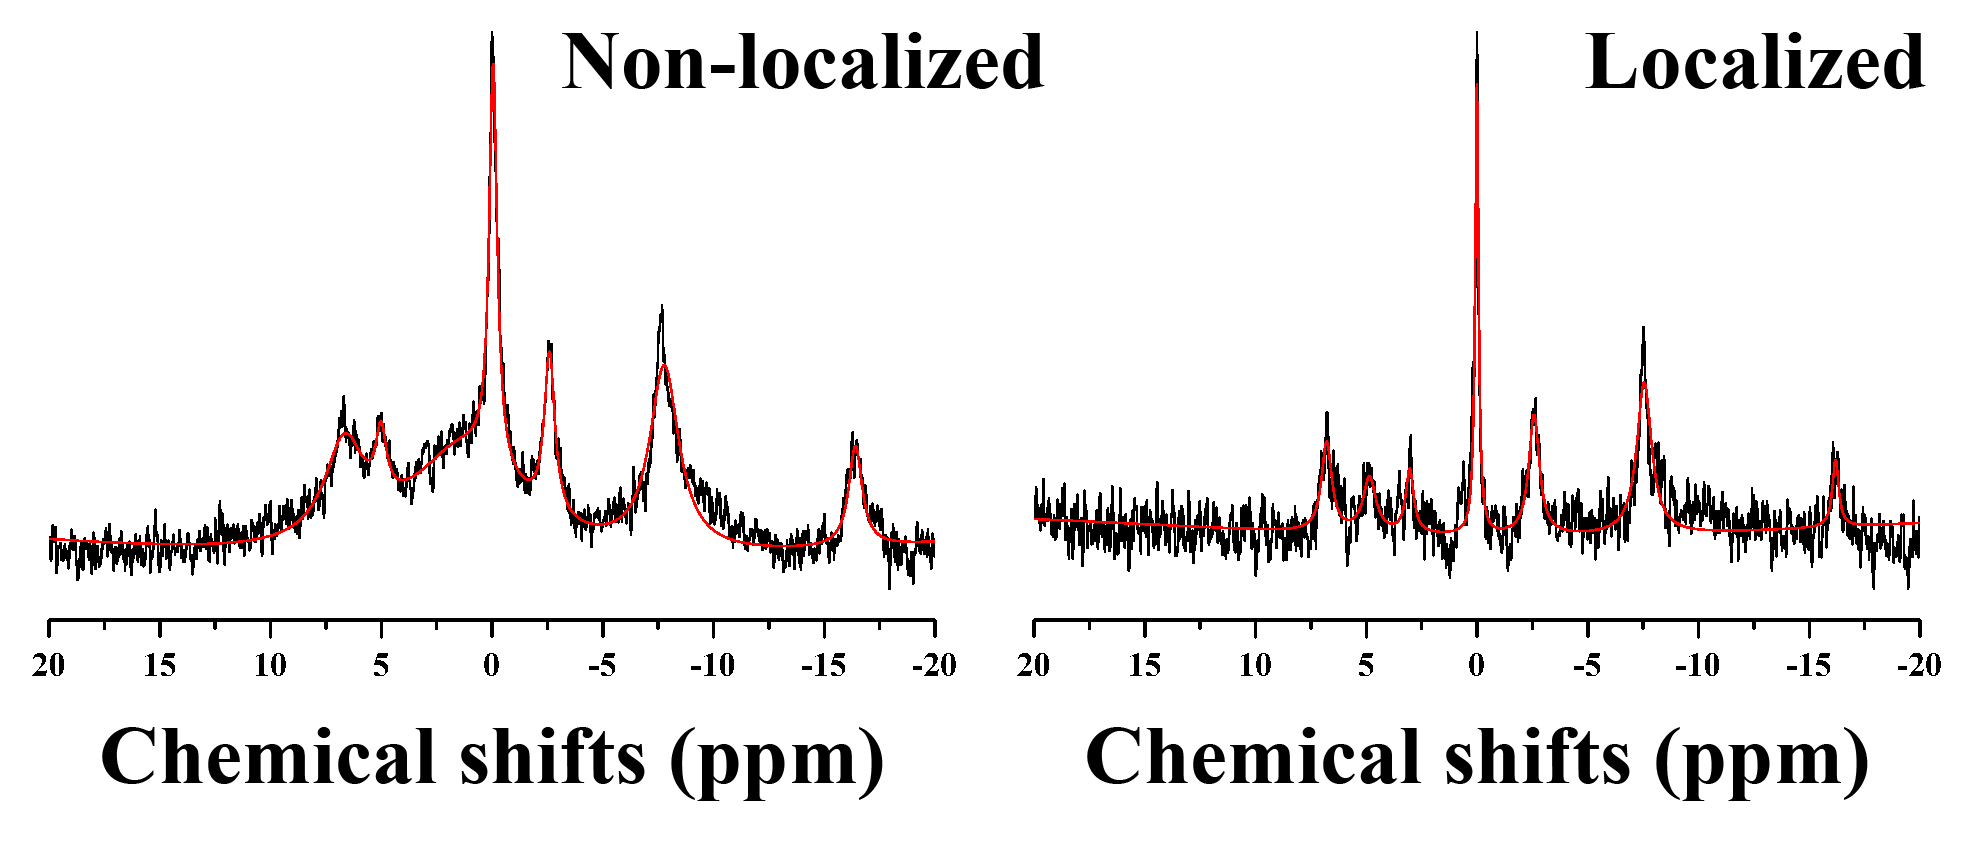
All MRI/MRS scans of WT control mice (n = 9) and 5xFAD AD-model mice (n = 6) with age of 9 months were acquired with Bruker BioSpec® 94/20 scanner with a 72-mm linear transmit coil, and 4-channel phased-array surface coil. For in vivo 1H MRS, voxels of the MRS were located mainly in the PFC (2.0 × 1.5 × 1.2 mm3), right hippocampus (2.0 × 1.2 × 2.0 mm3), and automatically shimmed with the Localized_shim protocol to achieve an unsuppressed water linewidth to 11–15 Hz. PRESS sequence with a sinc3-90° excitation pulse (12420 Hz; 0.5 ms) and sinc3-180° refocusing pulses (4650 Hz; 1.0 ms) were used with the followings: TR/TE: 4000/15.016 ms; complex data points: 2048; average: 16 × 20; spectral BW: 5000 Hz. Before the quantification, an apodization with 2 Hz exponential filter was applied to each FIDs of the MRS spectra, and a time-domain spectral registration was applied to the 40 sets of the apodized FIDs by using the FID Appliance (FID-A) open-source software package. The processed spectrum with total 640 averages was quantified by the LCModel with a parametrically matched basis-set simulated by the FID-A. For in vivo 31P MRS, a voxel was located in the whole brain region (6.0 × 4.0 × 6.0 mm3), and automatically shimmed with the Localized_shim protocol using 1H signal. ISIS sequence with a bp32 excitation pulse (16000 Hz; 0.08 ms; 20 W) and calculated-180° inversion pulses were used with the followings: TR = 4000 ms; complex data points = 4096; average = 128; spectral BW = 16025.64 Hz. For quantification of 31P MRS, jMRUI software with QUEST algorithm was used to calculated /PCr relative ratios for γ-, α-, β-ATP, and inorganic phosphate, PME and PDE, respectively. High-resolution 3D T2-weighted images were acquired using TurboRARE sequence with the following parameters: TR/TEeff = 2000/33 ms; RARE factor = 16; averages = 2; field of view = 12 × 12 × 15.6 mm²; matrix size = 120 ×120 × 156; resolution = isotropic 100 μm. For the brain tissue compartmentalization, the Atlas Normalization Toolbox using ELASTIX (ANTX)-toolbox was used with the acquired MRI. To investigate the AD-related metabolic changes, mean concentrations and /PCr relative ratios were compared between the groups for all major metabolites. In addition, a volumetric analysis was conducted on the volume of hippocampus, entorhinal cortex, and PFC between the groups.Results
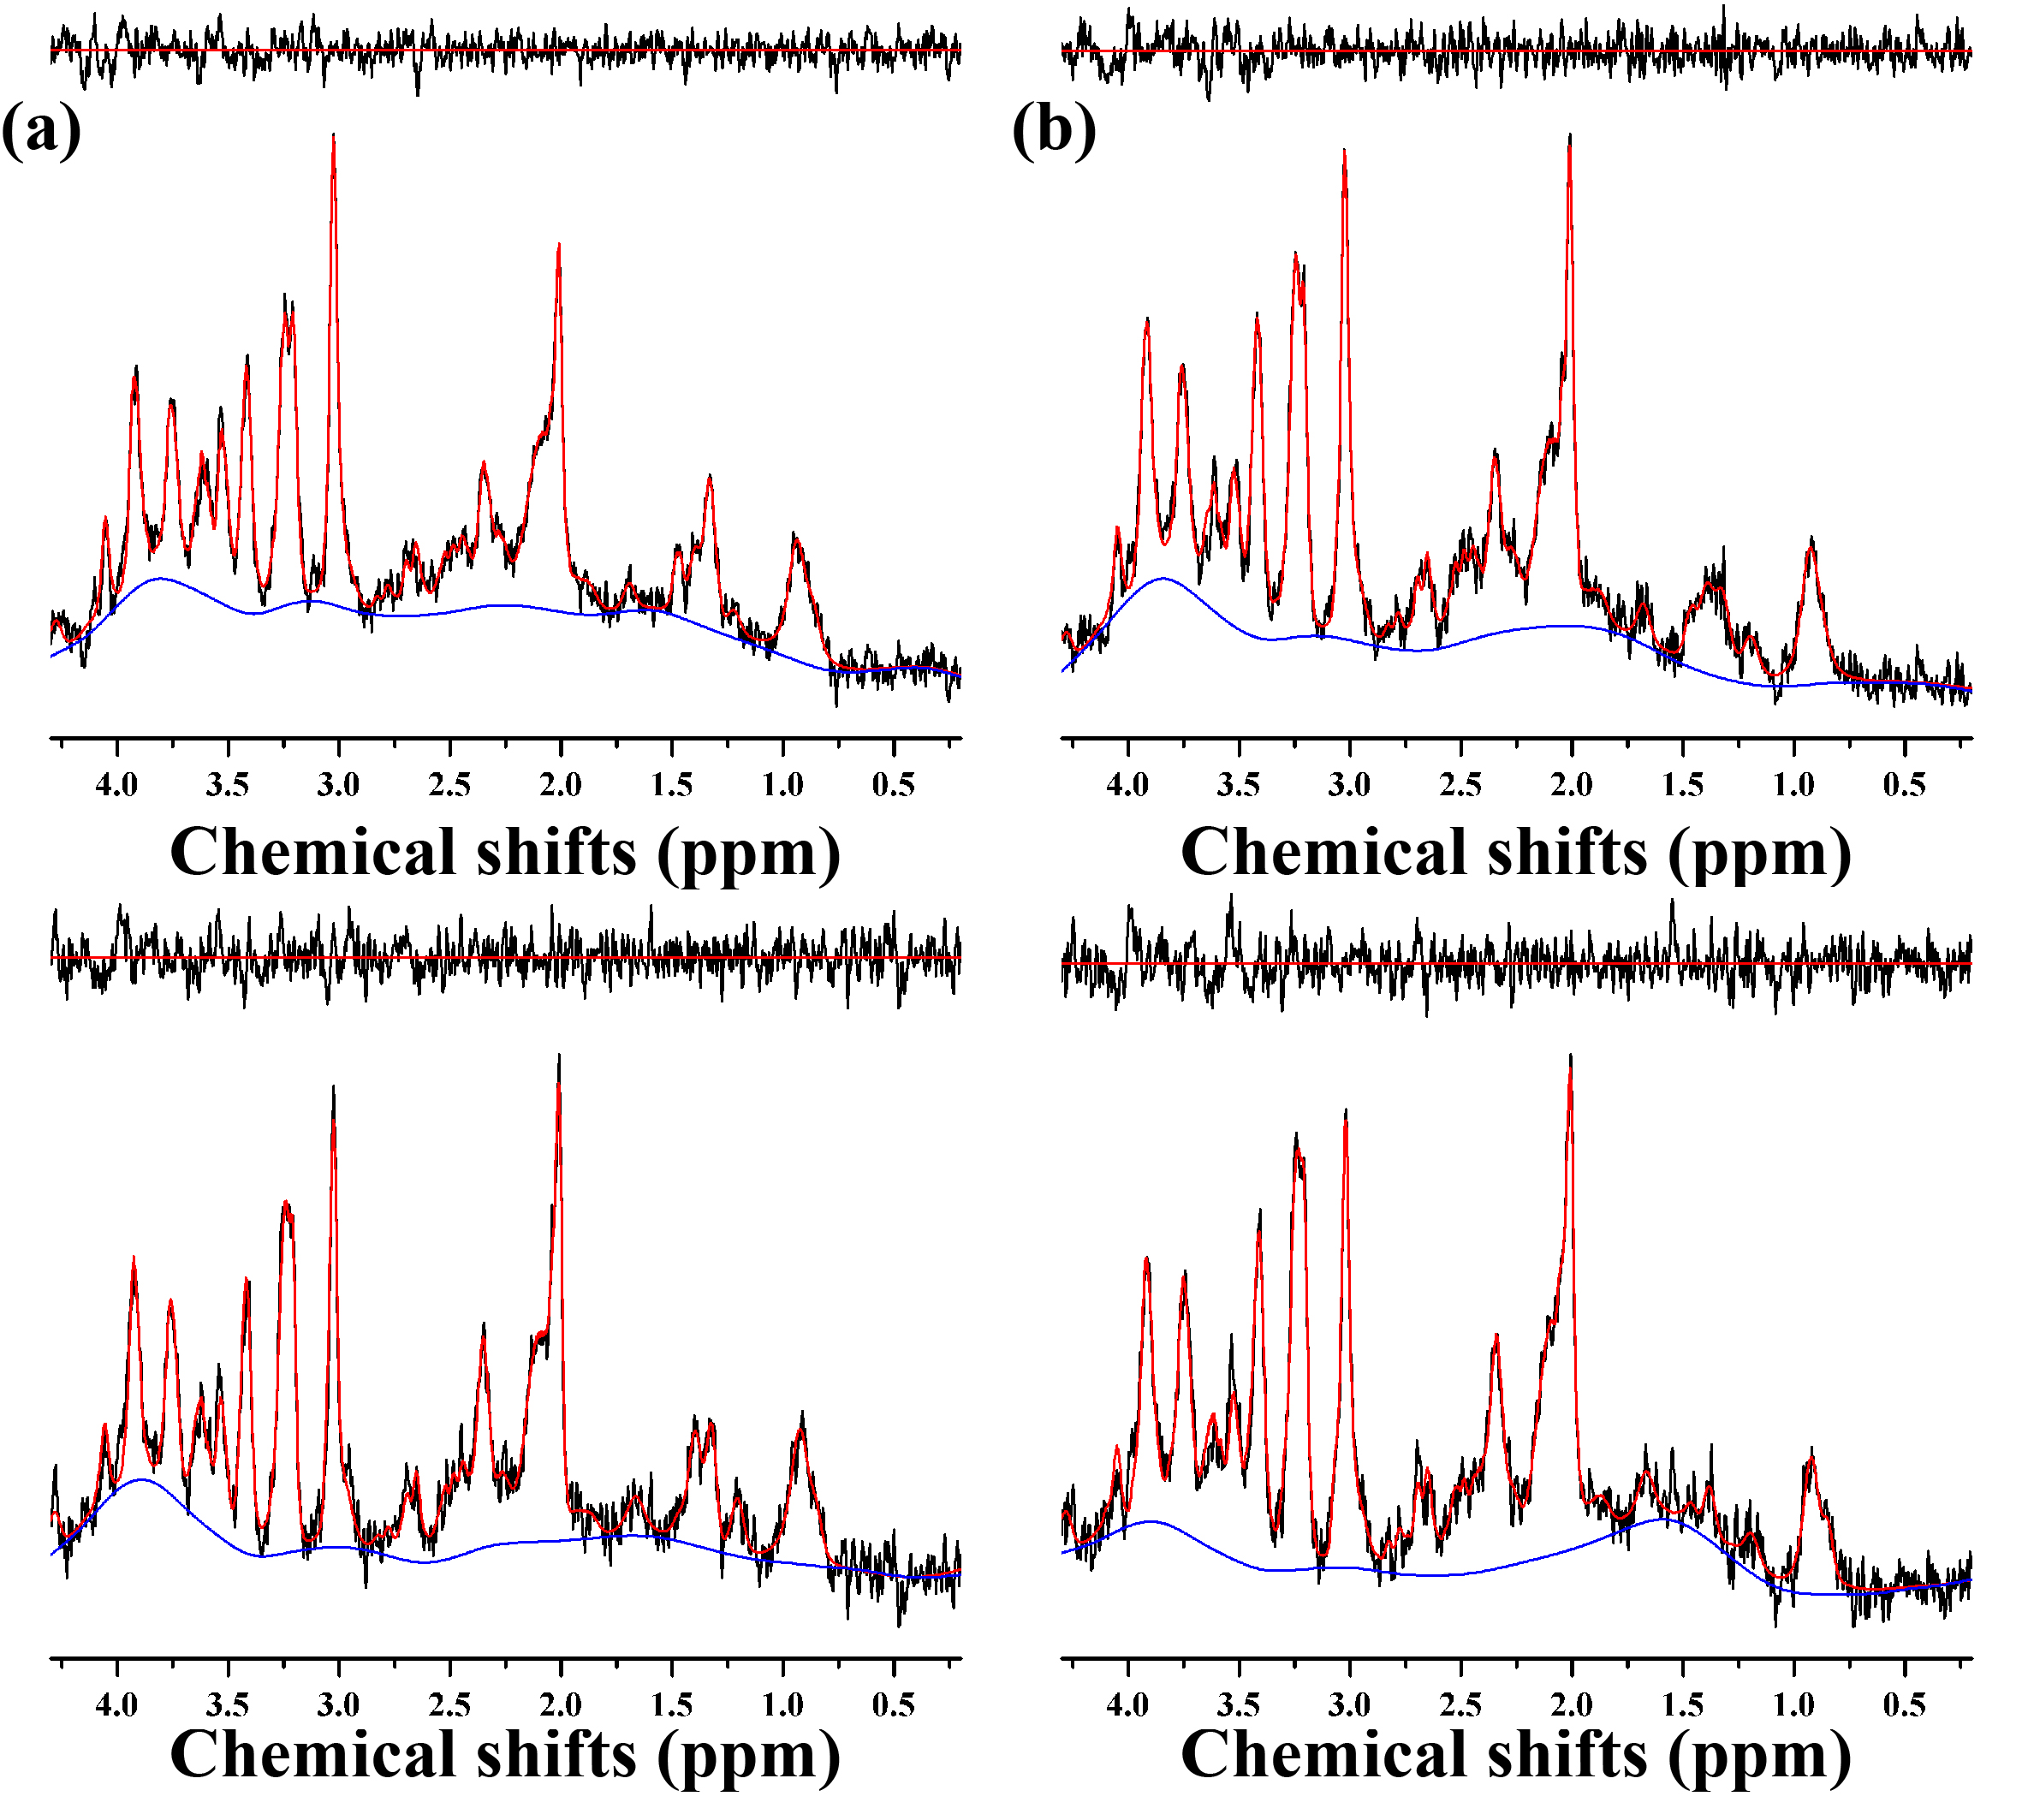
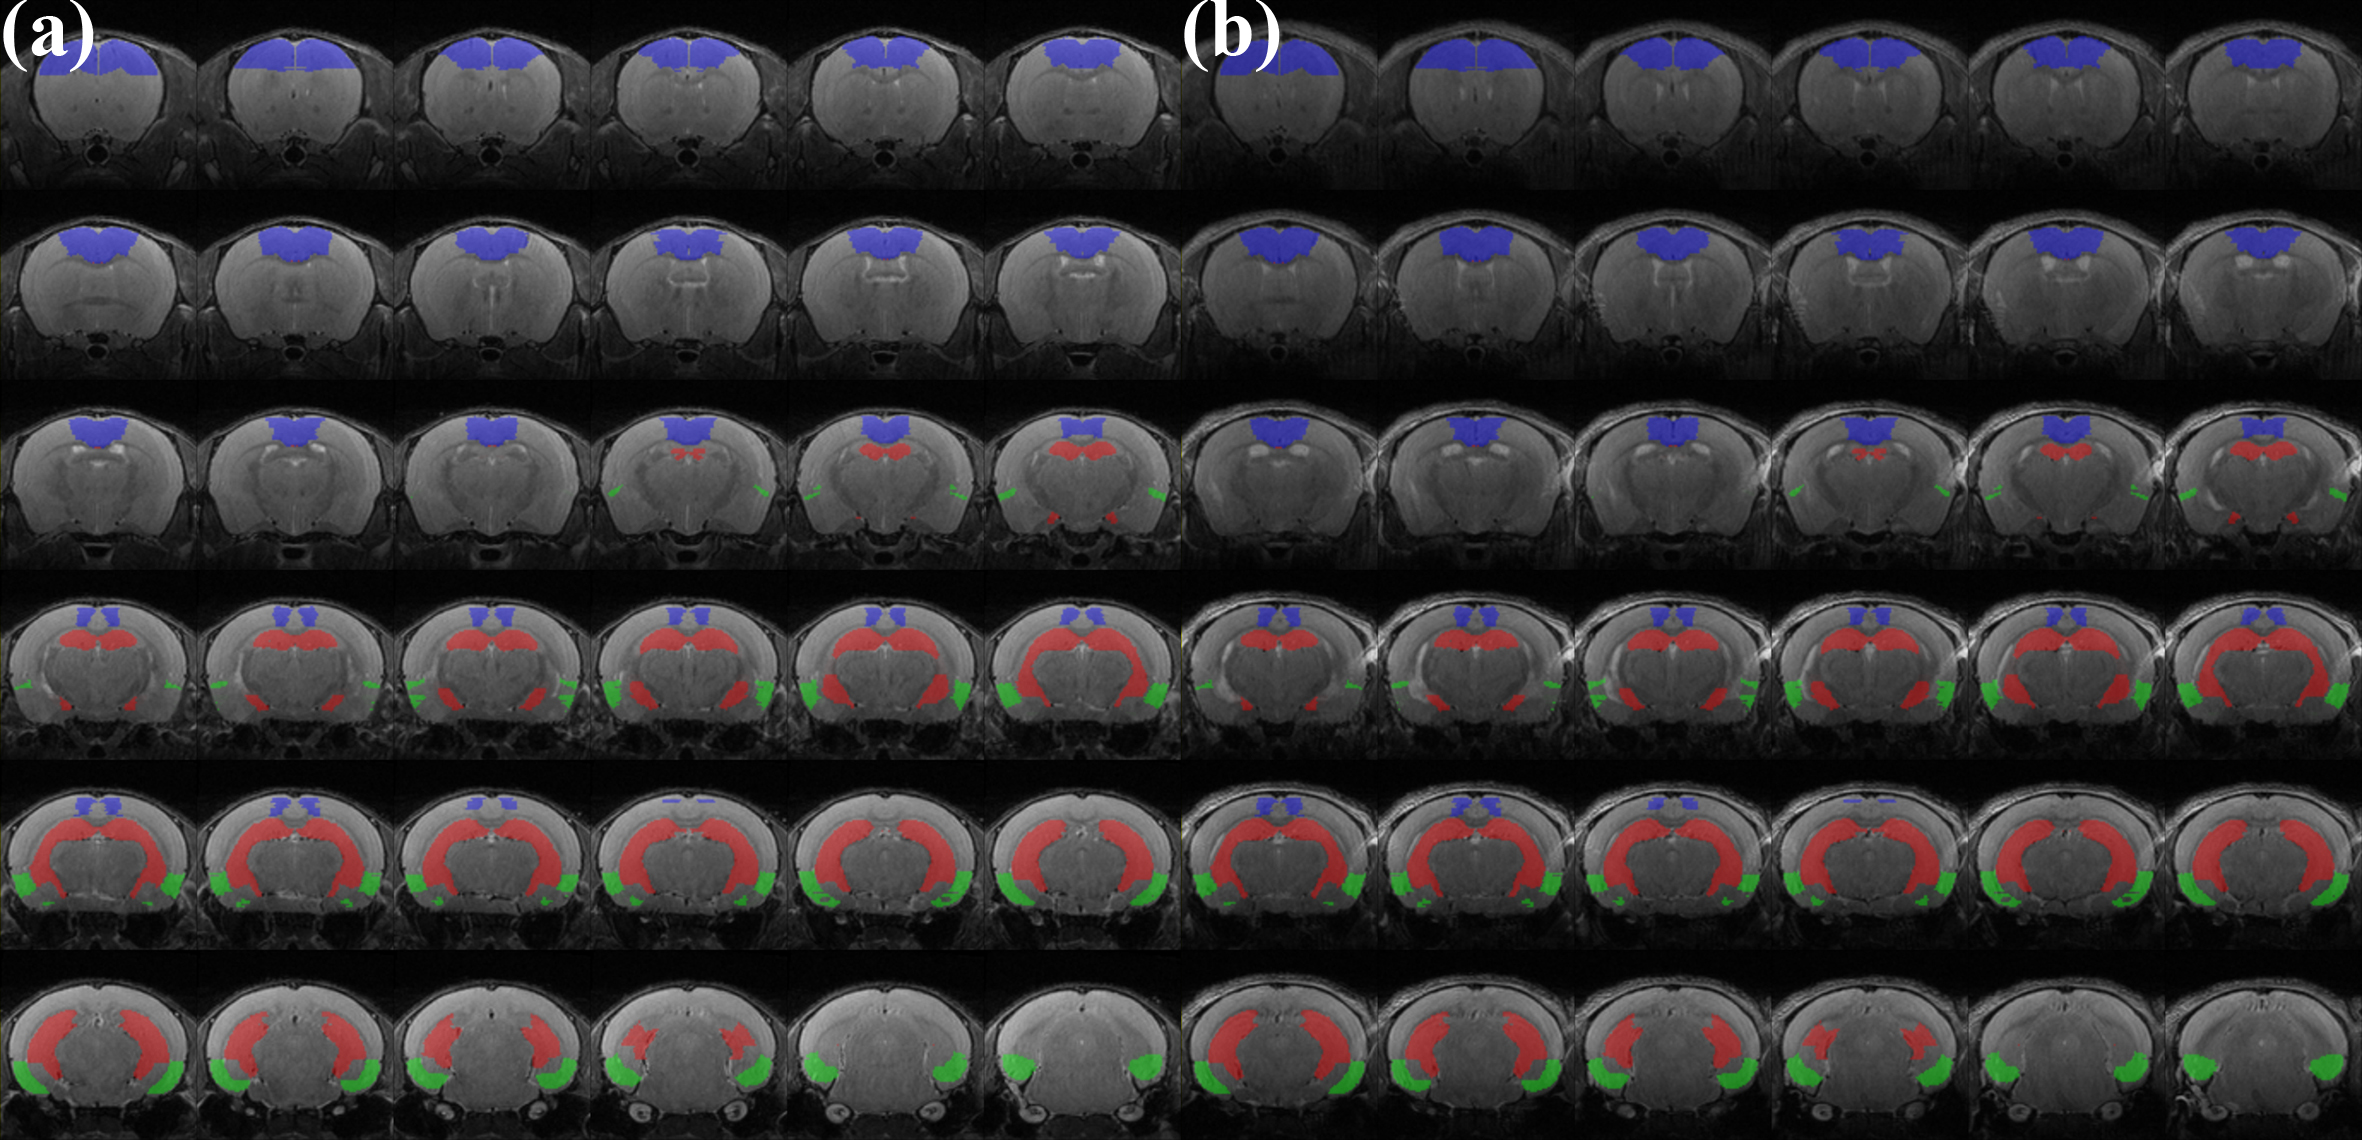
Figure 1 illustrates the experiment protocols of this study. Figure 2 illustrates representative 1H MRS scans obtained in the hippocampus (top) and PFC (bottom) of the (a) 5xFAD AD-model mouse and (b) WT control mouse, respectively. Table 1 lists the mean concentrations and CRLB values. The acquired MRS spectrum showed sufficient SNR and comparable linewidth to the previous studies in the visual inspection. In addition, the CRLB values of the major metabolites seemed comparable, suggesting that high-field and short-TE MRS was reliably acquired and processed in the three voxels. Figure 3 illustrates representative (a) non-localized and (b) localized 31P MRS scans, obtained in the whole brain region of WT control mouse. Figure 4 illustrates high-resolution 3D T2 MRI with the segmentation, acquired in the brain of the (a) 5xFAD AD-model mouse and (b) WT control mouse with the hippocampus (red), PFC (blu) and entorhinal cortex (green) overlaid. As visually inspected, the acquired MRI scans showed that the SNR was generally maintained sufficient for the whole brain region with the high spatial resolution (100 μm). The co-registration and tissue compartmentalization in conjugate with the brain altas was reliably performed without any artifacts.Discussion and Conclusion
In this study, the AD-related changes in brain were investigated by high-field and short-TE 1H MRS and localized 31P MRS, and high-resolution T2-weighted MRI in conjugate with the altas-based automatic brain segmentation. By applying spectral registration and apodization to the separately stored FIDs, the quantification was reliable considering the CRLB values for the major metabolites. Significant reduction in GSH and tCr and nearly significant reduction (p < 0.069) in Tau was observed in the PFC of the 5xFAD AD-model mouse compared to the WT control mouse. Significantly reduced GABA, increased mIns and nearly significant reduction (p < 0.060) in tNAA was observed in the PFC of the 5xFAD AD-model mouse compared to the WT control mouse. In addition, by applying the automatic atlas-based segmentation to high-resolution 3D T2-weighted MRI, the volumetric changes can be assessed.Acknowledgements
This work was supported by the National Research Foundation of Korea Grant funded by the Korean Government (2018R1A2B2005343), and the Brain Research Program through the National Research Foundation of Korea (NRF) funded by the Ministry of Science and ICT & Future Planning (2017M3C7A1043838).References
1. Hübner NS et al. The connectomics of brain demyelination: Functional and structural patterns in the cuprizone mouse model. Neuroimage, 2017;146:1-18.
2. Koch et al. Atlas registration for edema-corrected MRI lesion volume in mouse stroke models. J Cereb Blood Flow Metab, 2019;39:313-323.
3. Stefan D. et al. Quantitation of magnetic resonance spectroscopy signals: the jMRUI software package. Meas. Sci. Technol, 2009;20:104035.
Figures