2967
Under-sampled spiral 31P-MRSI for dynamic exercise applications at 3T1Université de Lyon, INSA-Lyon, Université Claude Bernard Lyon 1, UJM-Saint Etienne, CNRS, Inserm, CREATIS UMR 5220, U1206, Lyon, France, Lyon, France, 2SIemens Healthcare SAS, Saint-Denis, France, 3Wolfson Brain Imaging Center, University of Cambridge, Cambridge, United Kingdom, 4SIemens Healthcare SAS, Erlangen, Germany
Synopsis
In this abstract, a novel approach based on spiral MRSI and under-sampling of the temporal dimension is applied in the case of dynamic phosphorus at 3T. The goal was to assess mitochondrial capacity of different individual muscles within the calf at once.
Introduction
Quantifying energetic muscular metabolism and mitochondrial capacity is of crucial interest to reveal muscular disorders, metabolic diseases or cardiovascular diseases. 31P spectroscopy is a well-known non-invasive way to monitor energetic metabolism and dynamic concentrations of phosphorylated metabolites during exercise or after, during recovery, and provides pieces of information on mitochondrial and oxidative capacity. In clinical practice, mostly non-localized 31P spectroscopy is done, preventing metabolic information from different individual muscles to be measured, and averaged information results from the whole muscle as collected at once by the surface coil used for the experiment. In this work, the recently proposed MRSI approach detailed in [5] coupling spiral k-space sampling and temporal under-sampling was applied on dynamic phosphorus experiment, to evaluate its performance to spatially resolve 31P signal within individual muscles of the calf at rest but also dynamically during controlled exercise at 3T.Methods
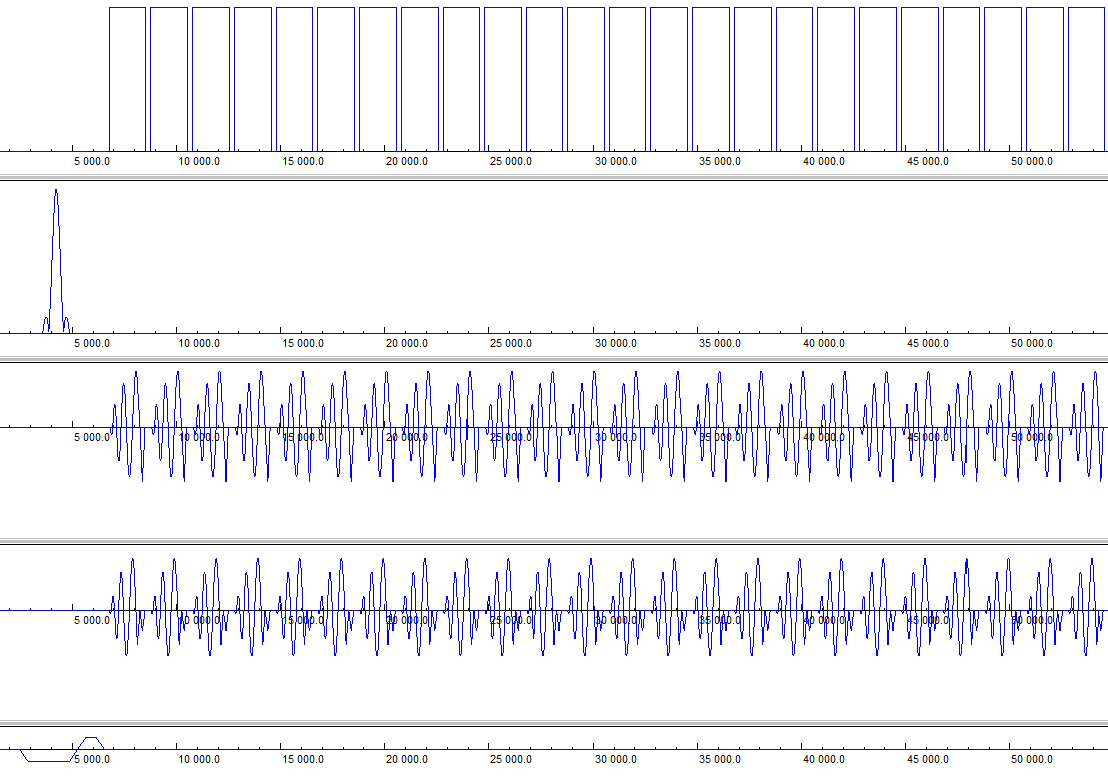
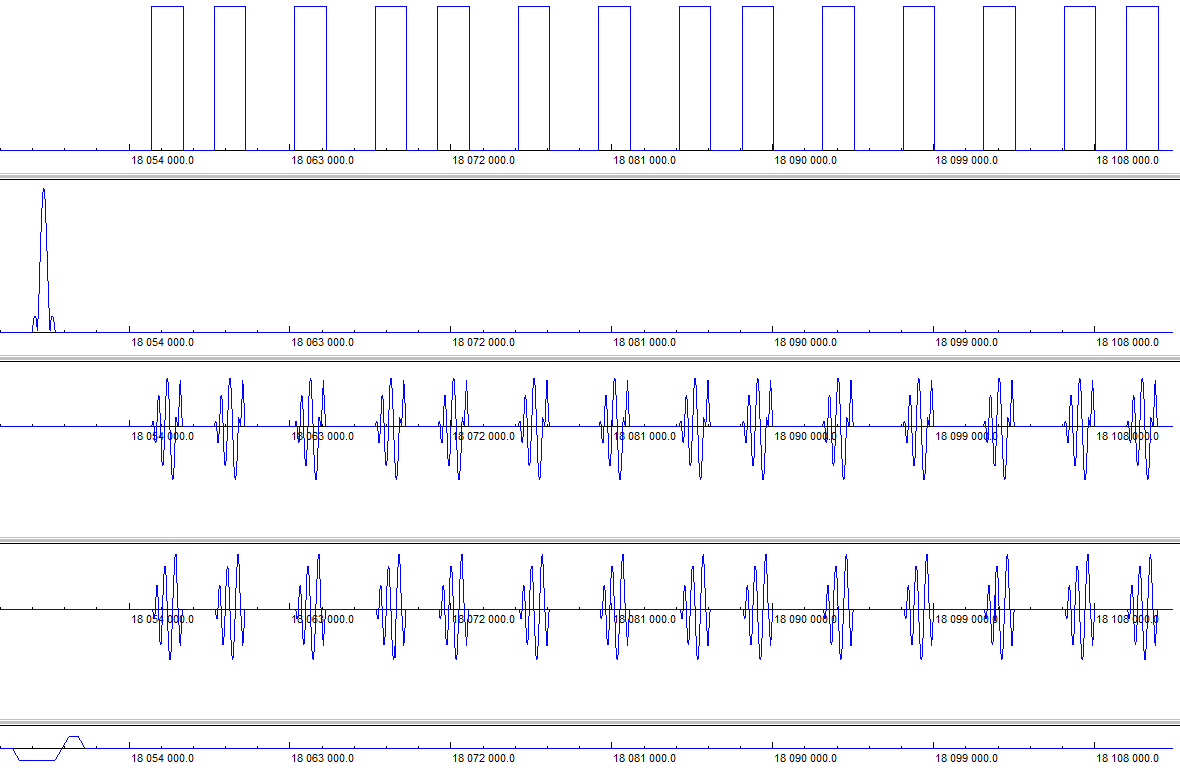
The sequence has been developed on a Siemens MR machine (figure 1). The prototype sequence has been tested on a Prisma 3T scanner (max slew rate SR= 200T/m/sec and Max Gradient amplitude Gmax=80mT/m). The total acquisition time Tacq depends on the number of spatial interleave Nspat, the number of temporal interleaves Ntemp (repetition of the spiral train with a delay equal to the spectroscopic temporal resolution) and the repetition time TR:Tacq = TR × Nspat × Ntemp
The method in [6] has been implemented (figure 2) as well. The SBS algorithm enabling to define the irregular sampling has been implemented on the scanner and outputs the temporal samples to acquire given the frequency support, the vector size and the reduction factor for the under-sampling that the user defines in a Special Card (on siemens MR machine windows interface).
31P experiments at rest were made using a 31P-CSI double phase encoding sequence with a TR of 4s, a bandwidth of 2000Hz and a 8x8 matrices size. A 31P-CSI spiral sequence with the same acquisition parameters has been done at rest. A reduction factor of 3 has been used for the under-sampled spiral CSI, with a frequency support chosen such that it contains PCr, Pi and gamma-ATP resonances. The resulting acquisition times were 2min56s for the fully temporal spiral CSI sequence and 1min36s in the under-sampled case, which results in a gain in the terms of acquisition time of 1.8. The two method fully and under-sampled are compared in terms of signal to reconstruction error ratio (SRER) which is computed according to the the fully and regularly sampled signal.
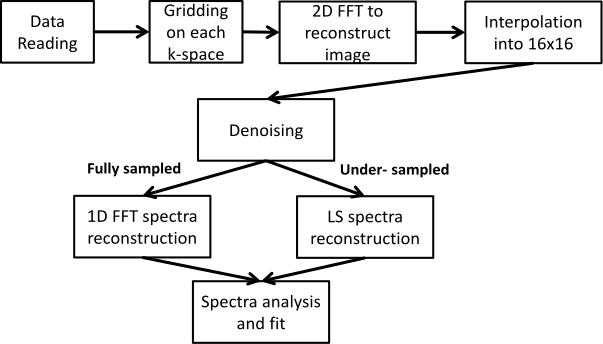
Dynamic 31P experiments were done with an isometric flexion movement. The TR used for dynamic experiments was of 2s for the fully sampled spiral CSI and under-sampled for the under-sampled spiral CSI. The bandwidth for proper 31P spectra reconstruction has been set to 2000Hz. The number of temporal interleaves was of 4 for the fully sampled spiral CSI and 2 for the under-sampled spiral CSI, which lead to a resolution between full reconstructed spectra of 8s in the fully sampled case and 4s in the under-sampled case. The data processing pipeline is given on figure 3.
Results
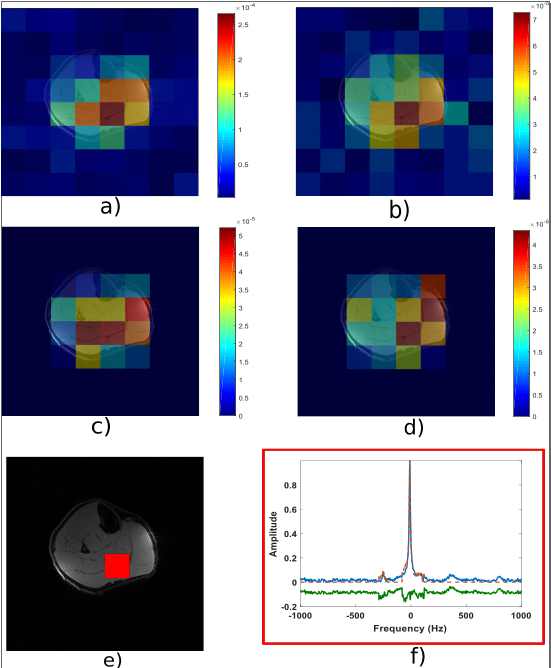
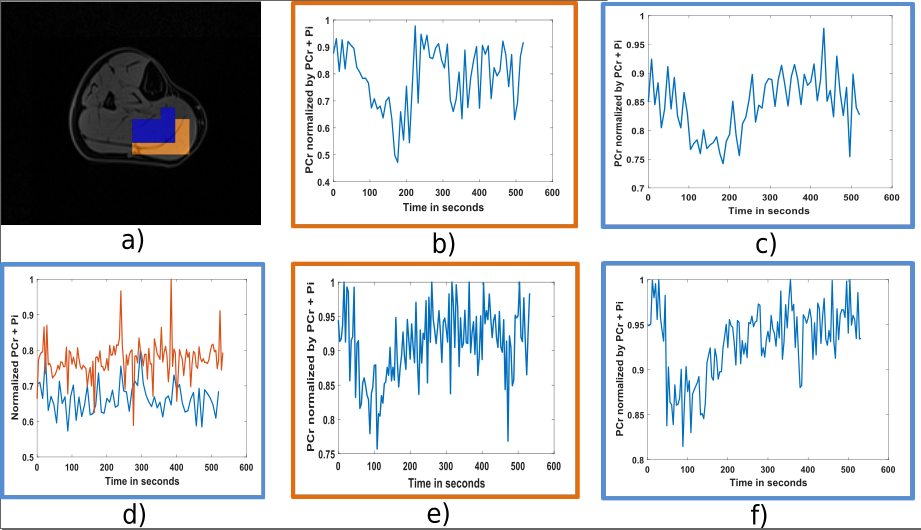
Figure 4 shows PCr and Pi maps acquired at rest with the two methods fully spiral CSI and under-sampled spiral CSI. Reconstructed spectra are shown as well for a voxel of the image. The SRER in the highlighted voxel is of 19, 01 dB, which corresponds to an energy of the reconstruction error 9 times smaller than the energy of the signal. The SRER has also been averaged within all the voxels containing soleus and gastrocnemius muscle and its value is 17, 31 dB. Concerning dynamic 31P experiments, PCr depletion was of 47 % in the soleus muscle and 34 % in the gastrocnemius muscle for the fully temporal spiral CSI case and 38 % in the soleus muscle and 31 % in the gastrocnemius muscle for the under-sampled spiral CSI case. Normalized PCr by PCr + Pi evolution over time is shown in figure 5 for both methods in the soleus and the gastrocnemius muscles. The sum of PCr and Pi is also given. PCr recovery constant times were of 45,4s in the soleus and 34,7s in the gastrocnemius for the fully sampled case and 44,2s in the soleus and 39,3s in the gastrocnemius for the undersampled case.Discussion
The novel fast spiral MRSI acquisition strategy has been presented and tested in-vivo on phosphorus experiments. The very first in vivo experiments at rest to compare the two methods resulted in satisfactory SRER. For dynamic phosphorus applications, we are particularly interested in PCr and Pi evolutions over time. The spectrum support has beenconsidered as sparse allowing to apply the acceleration method. Results showed that we were able to extract the recovery constant of PCr even in the under-sampled case. In the case of an undersampling, the temporal resolution of the dynamic experiment (time between each full 31P spectra) is lower than in the fully sampled case, here with a contained amplification of the noise.Acknowledgements
This work has been supported by Siemens Healthineers and the LABEX PRIMES (ANR-11-LABX-0063), program ”Investissements d’Avenir” (ANR-11-IDEX-0007) and carried out within the framework of France Life Imaging (ANR-11-INBS-0006). Some support was also received from the European Union’s Horizon 2020 research and innovation programme under grant agreement No 801075.
References
1. Posse, S., et al., MR spectroscopic imaging: principles and recent advances. Journal of magnetic resonance imaging : JMRI, 2013. 37(6): p.1301-25.
2. Adalsteinsson, E., et al., Volumetric spectroscopic imaging with spiral-based k-space trajectories. Magnetic Resonance in Medicine, 1998.39(6): p.889-898
3. Reeves, S.J. and L.P. Heck. Selection of observations in signal reconstruction. IEEE Trans. Signal Proc. 1995; 43: 788-791
4. Karkouri, J. et al., Irregular spiral acquisition for compressive sensing in MRSI, ISMRM 2017
5. Karkouri, J et al., Time samples selection in spiral acquisition for sparse magnetic resonance spectroscopic imaging, IEEE ICIP 2017
6. VALKOVIČ, Ladislav, CHMELÍK, Marek, MEYERSPEER, Martin, et al. Dynamic 31P–MRSI using spiral spectroscopic imaging can map mitochondrial capacity in muscles of the human calf during plantar flexion exercise at 7 T. NMR in Biomedicine, 2016, vol. 29, no 12, p. 1825-1834
Figures