2965
Volumetric mapping of the intracellular magnesium ion concentration in human calf muscles using 31P MRSI at 7 Tesla1Division of Medical Physics in Radiology, German Cancer Research Center (DKFZ), Heidelberg, Germany
Synopsis
Intracellular free magnesium ion concentration [Mg2+free] is an important parameter in the regulation of the energy metabolism and can be assessed non-invasively by the use of 31P MRSI. The purpose of this study is to show that volumetric mapping of [Mg2+free] in the human calf muscle is possible at B0=7T with a voxel size of 1 ml. The [Mg2+free] maps of healthy volunteers showed local differences, presumably resulting from different muscle fiber compositions. Two different approaches employed for the calculation of [Mg2+free] yielded comparable maps but different absolute values, indicating the need for further investigation.
Introduction
Phosphorus magnetic resonance spectroscopic imaging (31P MRSI) enables the localized non-invasive investigation of the energy metabolism in vivo. By using the chemical shift differences of the observed phosphorus resonances, one can calculate intracellular pH values as well as free magnesium ion concentrations ([Mg2+free])1-3, which may provide deeper insight into the metabolic processes of the investigated tissue. Recently, we observed local pH differences for different muscle groups when performing volumetric 31P MRSI at B0=7T with high spatial resolution4. To determine [Mg2+free] by means of 31P MRSI, up to now different approaches have been applied at field strengths of 1.5 and 3T in the human brain and calf muscle5-7. The mentioned studies suggest local differences in [Mg2+free], but were performed with only low spatial resolution.The purpose of this study was to demonstrate feasibility of volumetric mapping of the intracellular magnesium ion concentration in human calf muscles with high spatial resolution using 31P MRSI at B0=7T.
Methods
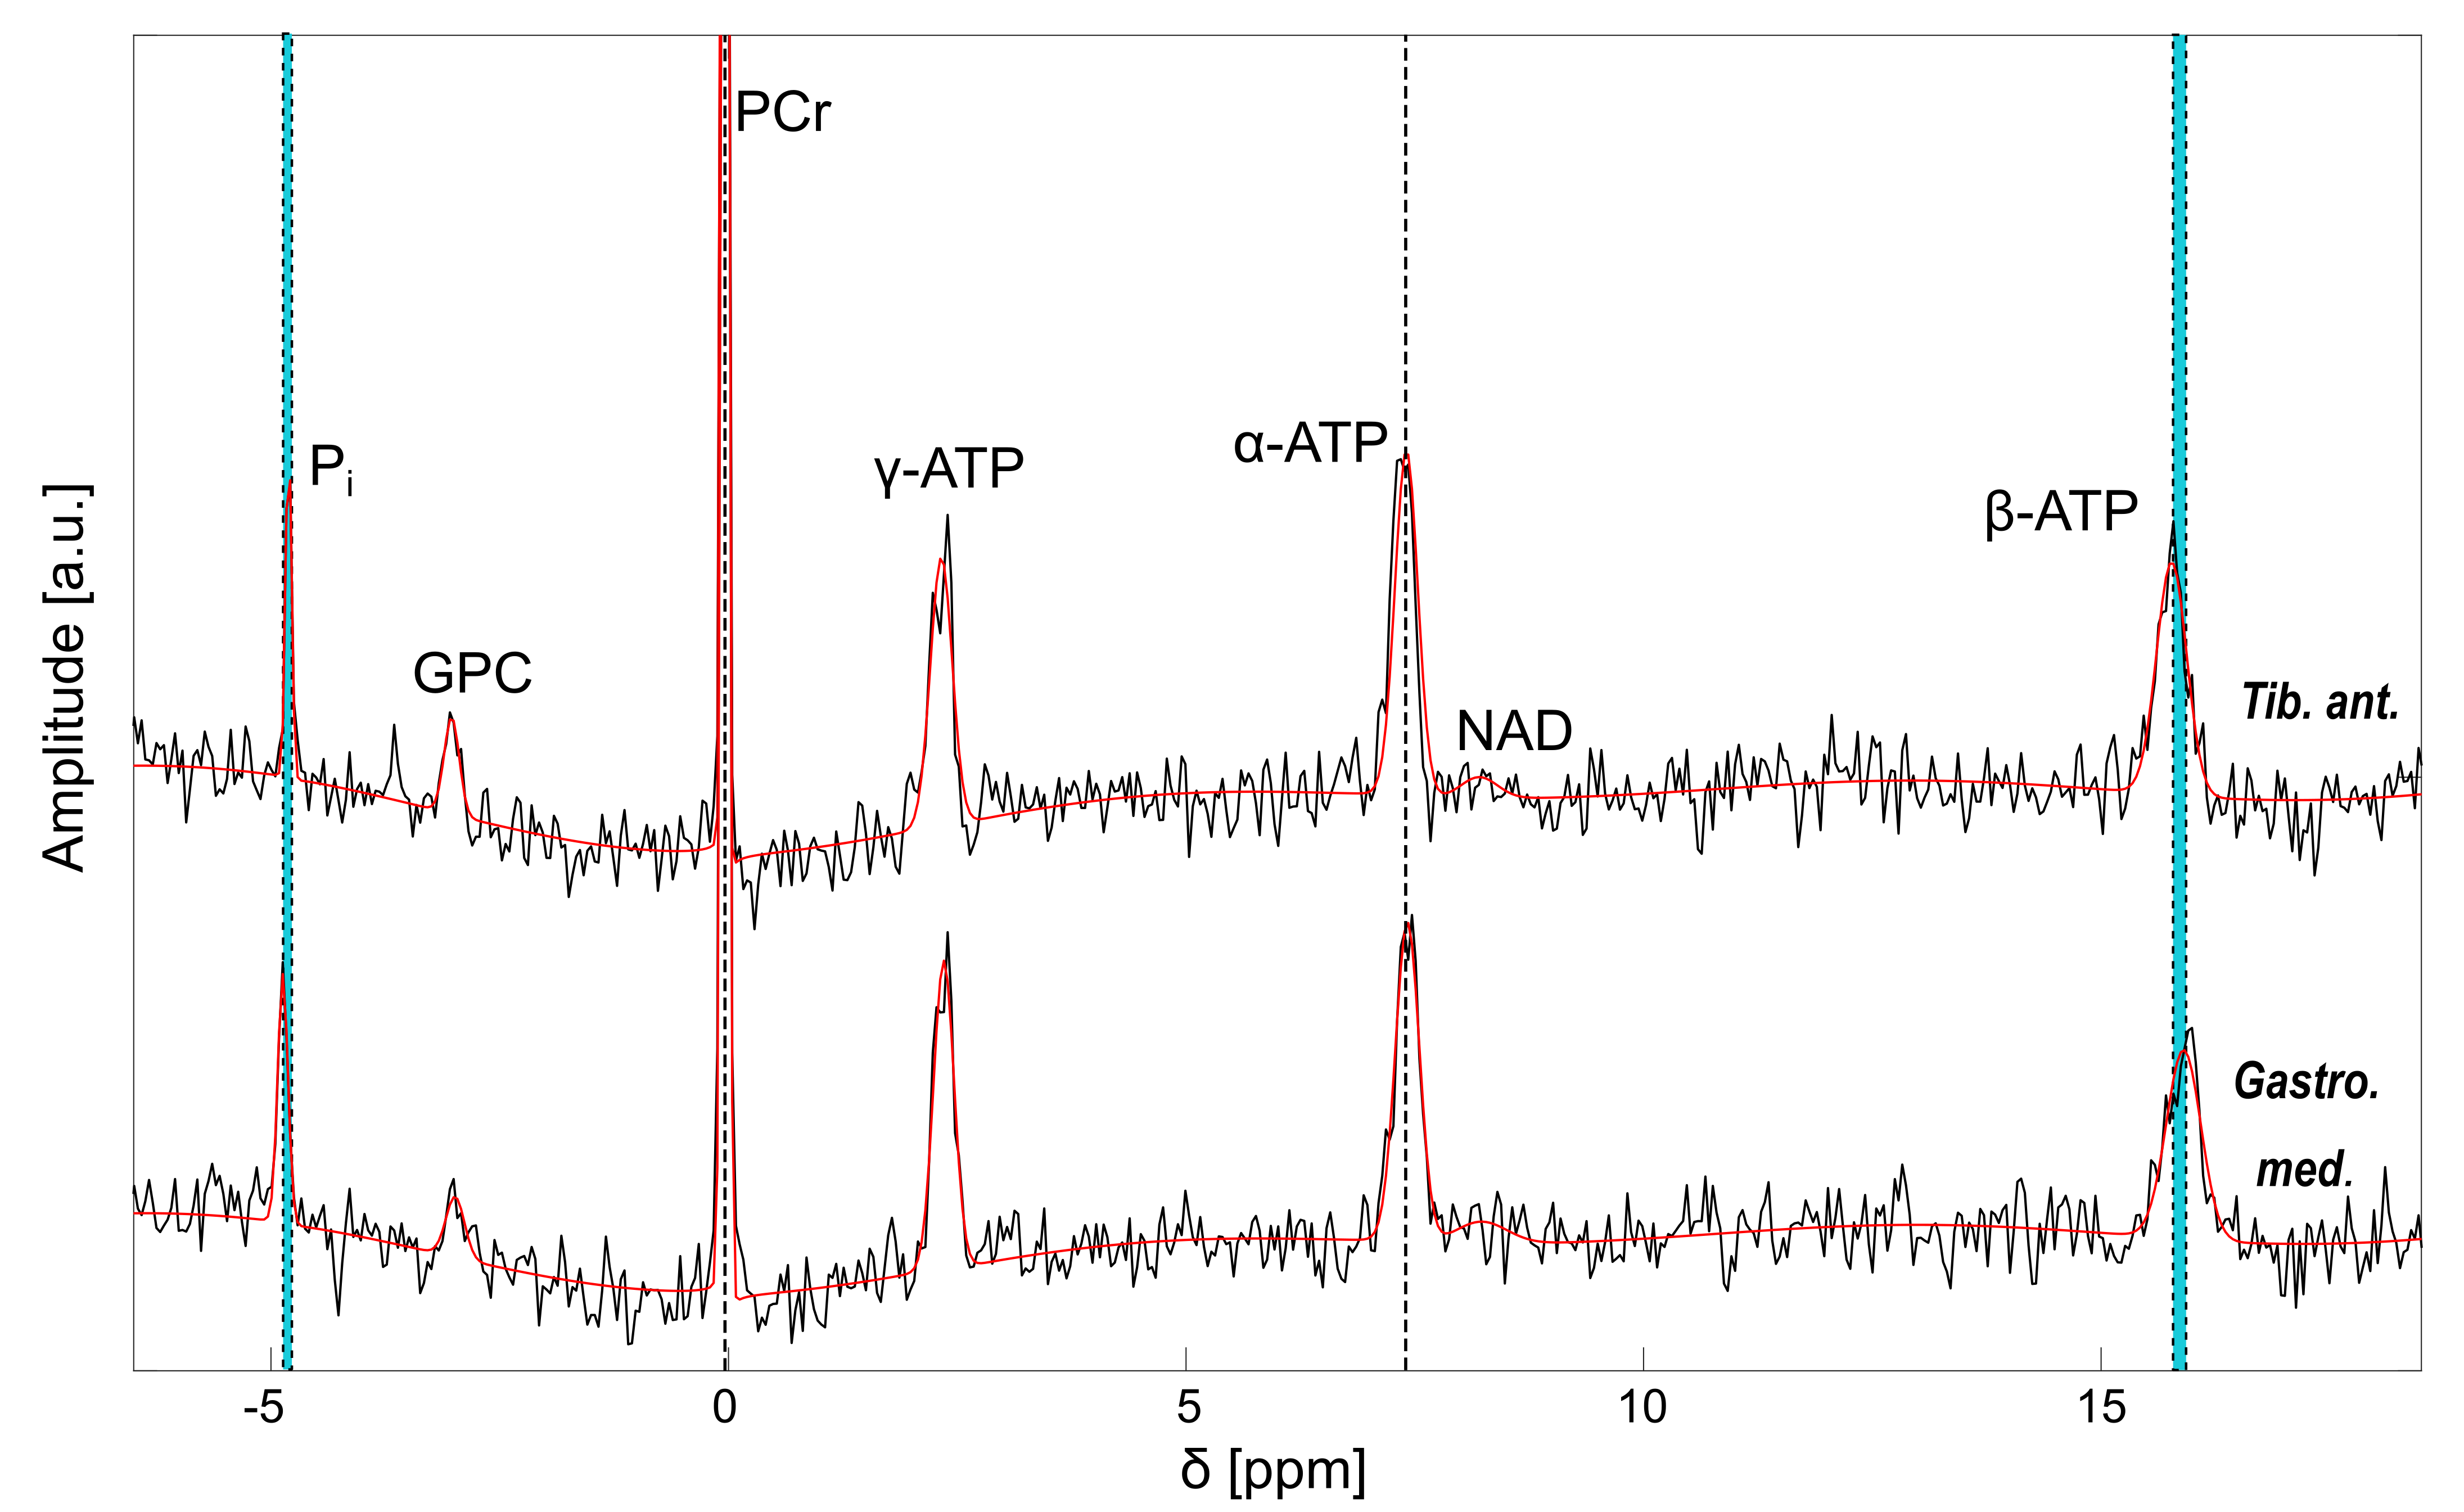
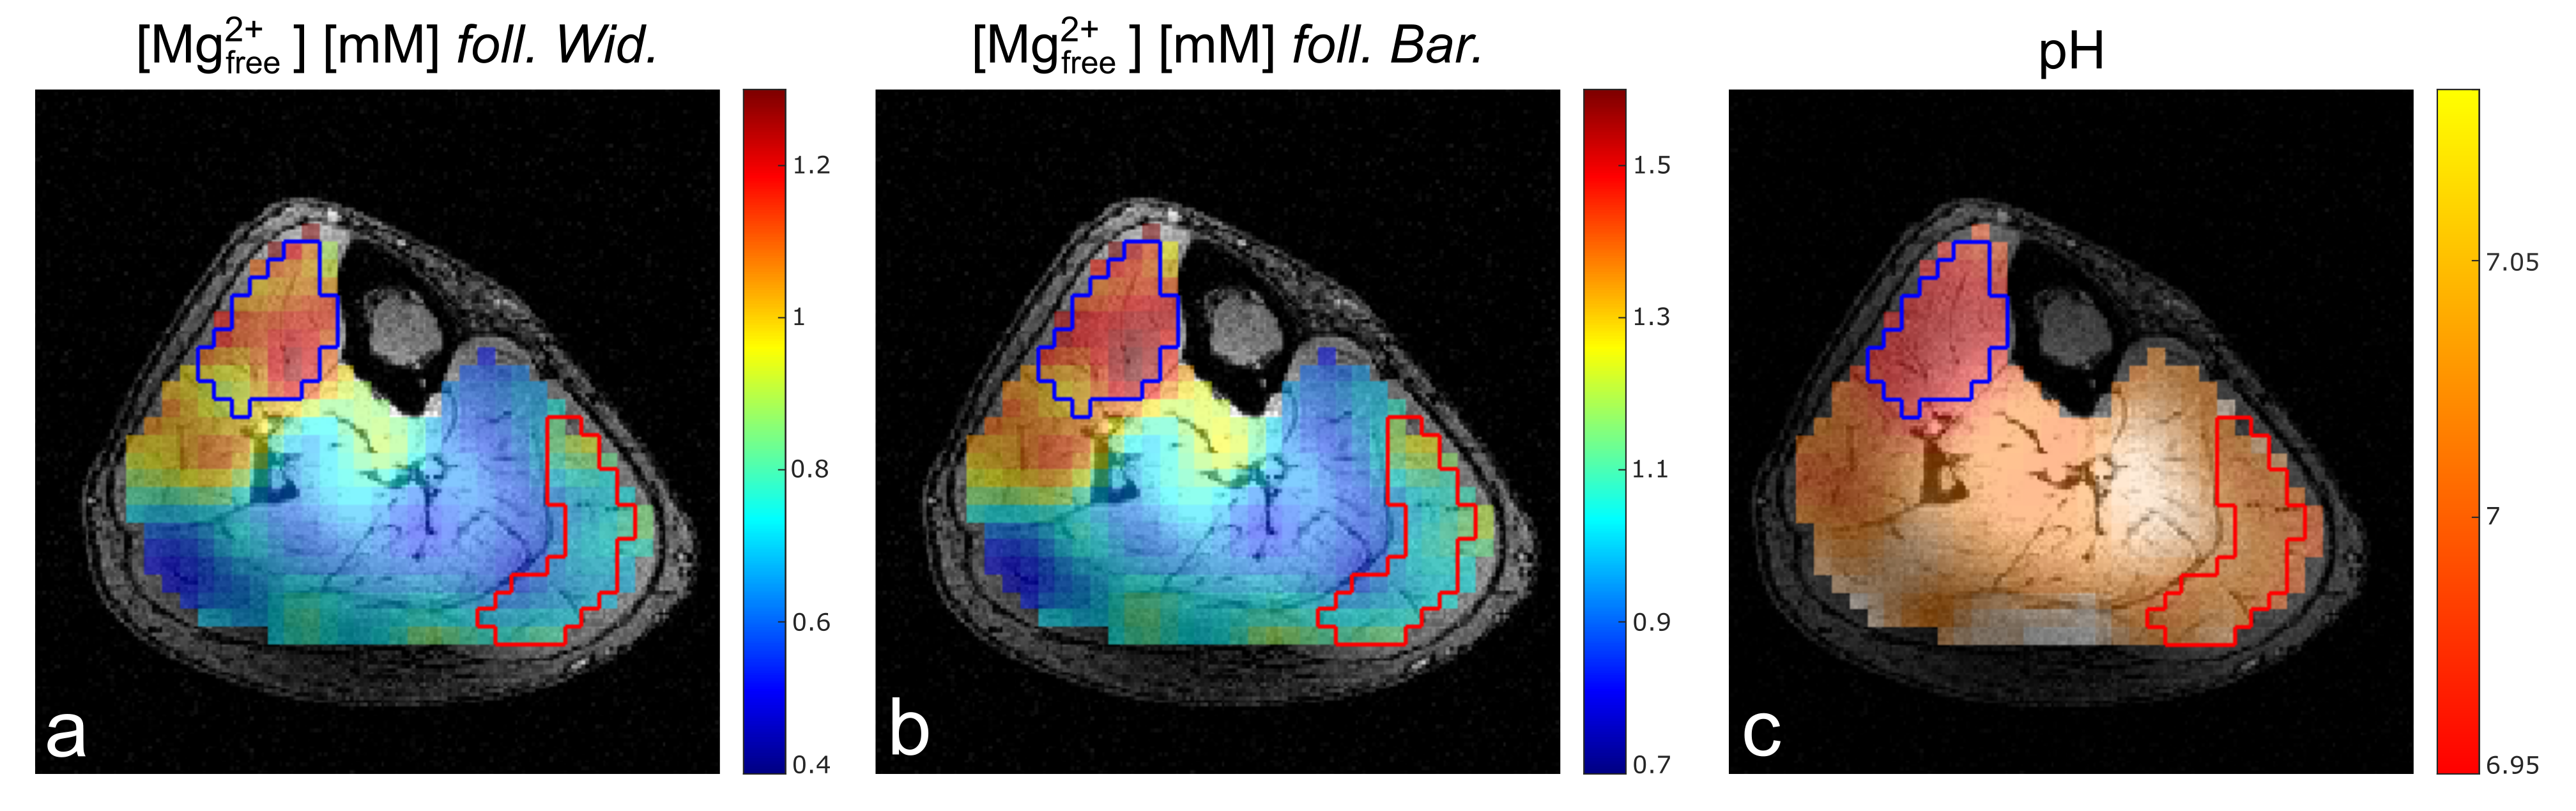
Four healthy volunteers (3 male / 1 female, age: 25-32) were examined on a 7-T whole-body MR system (Siemens Healthineers) using a double-resonant 31P-1H volume resonator (RAPID Biomedical). 31P MRSI data of calf muscles were acquired using an acquisition-weighted 3D CSI sequence (parameters: matrix size = 24×24×16, spatial resolution = 8×8×16 mm³, TR = 240ms, α = 20°, Δf = 5000 Hz, 1024 time points, Hamming-weighted k-space averaging with 16 averages in k-space center, Ttot = 56 min). All MRSI datasets were processed by one-fold spatial zero-filling and application of a 10-Hz Gaussian filter in the time domain. Localized 31P spectra were evaluated for seven detectable resonances (Phosphocreatine (PCr), three times Adenosine-5’-Triphosphate (ATP), Nicotinamide-Adenine-Dinucleotide (NAD), inorganic phosphate (Pi), Glycerophosphocholine (GPC)) using a customized Matlab (The MathWorks, Inc.) implementation of the AMARES algorithm8.[Mg2+free] was calculated using the local chemical shift separation of the α- and β-resonance of ATP, employing two different approaches. First, we calculated [Mg2+free] according to the approach after Widmaier et al.6 Second, we applied the approach by Barker et al.5, taking also into account influences of locally varying pH values for the calculation of [Mg2+free]. For this, intracellular pH values were calculated using the chemical shift difference between Pi and PCr according to the modified Henderson-Hasselbalch equation1. Voxelwise calculation yielded volumetric pH and [Mg2+free] maps for each volunteer.
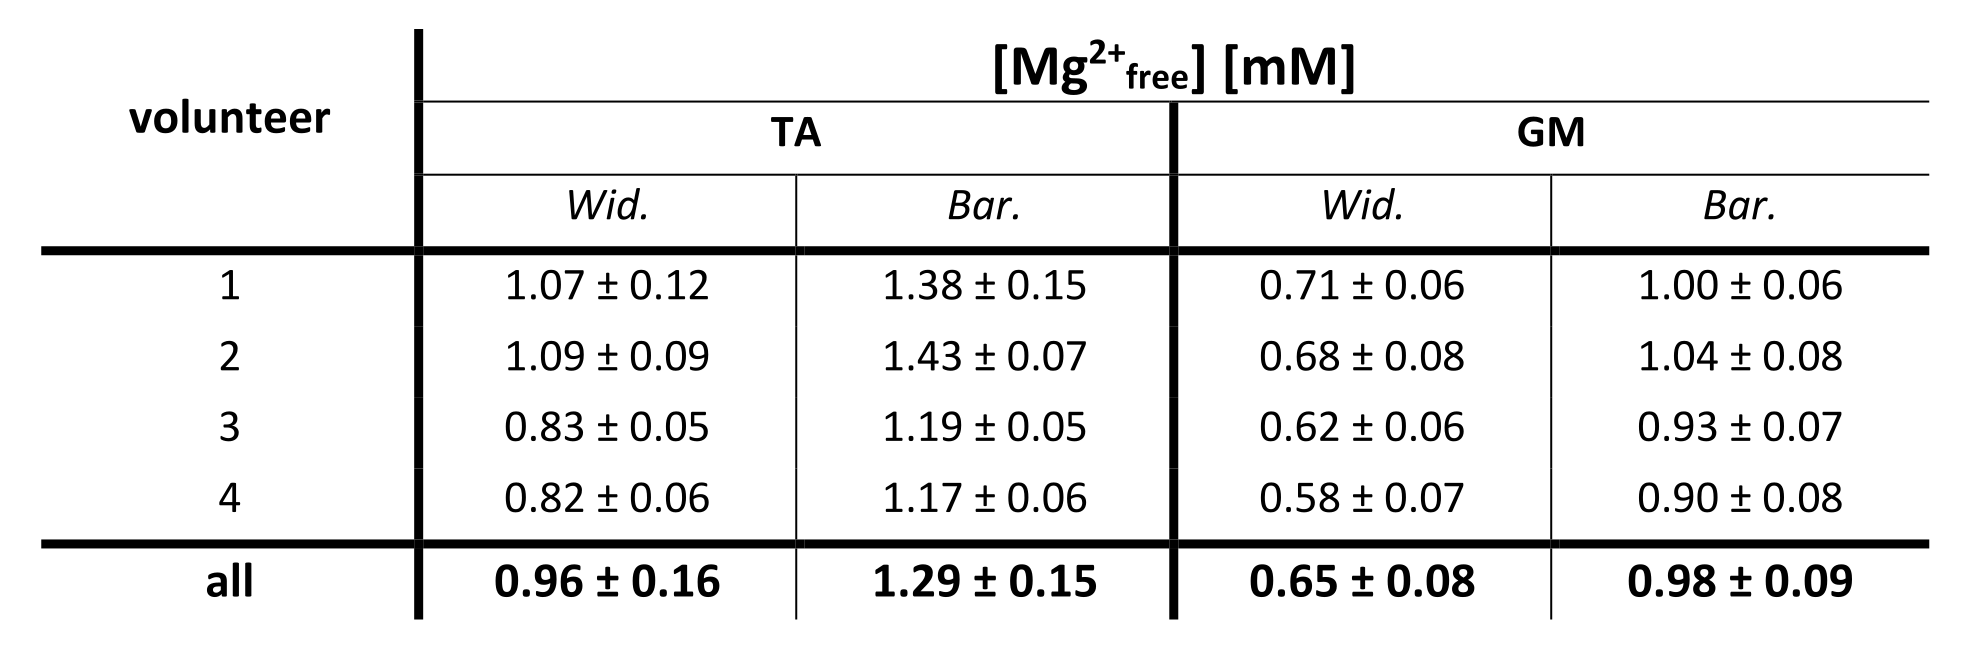
Regions of interest (ROIs) covering the muscles tibilias anterior (TA) and gastrocnemius medialis (GM) were drawn on the central transversal slice of the morphological 1H images using MITK9. The average number of voxels covered by the ROIs was (41±7) in the TA and (44±7) in the GM. Mean values and standard deviations of [Mg2+free] values were calculated for each volunteer individually, as well as across all volunteers.
Results
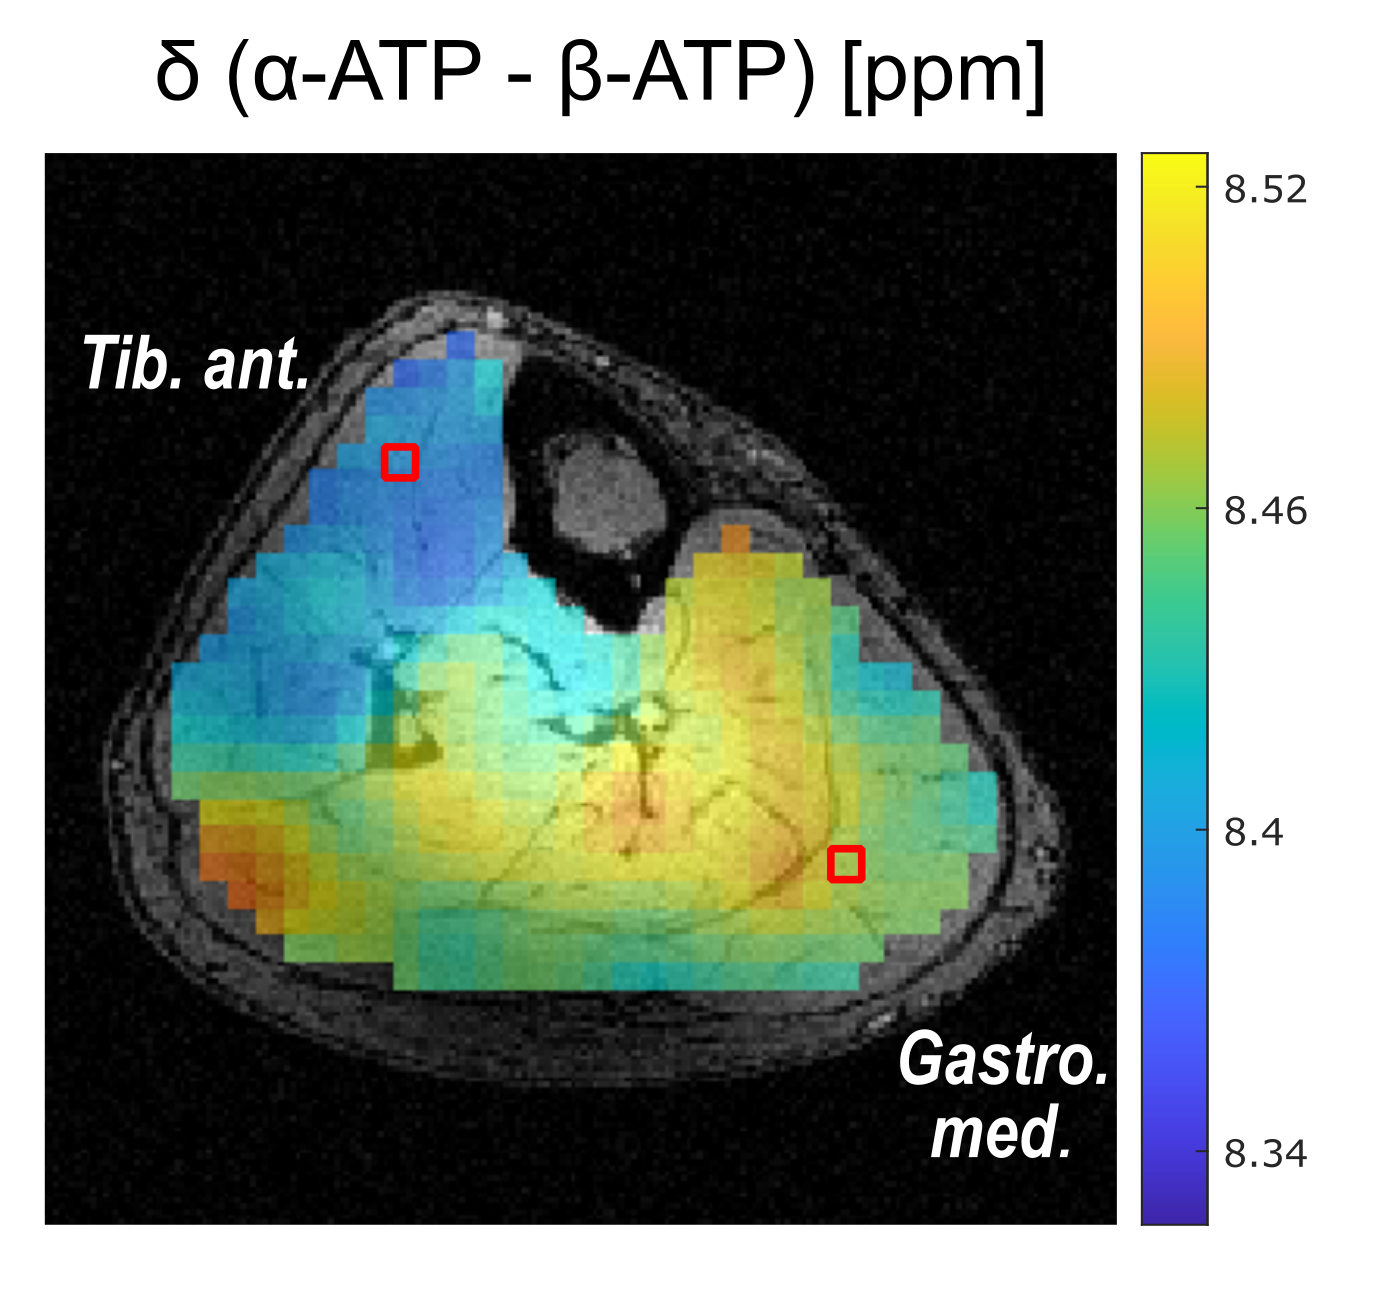
In all volunteers, localized 31P MR spectra of high quality were obtained, enabling the robust quantification of all detectable metabolites (Figure 1). These spectra revealed local differences in the chemical shifts of β-ATP and Pi, which persist after correction of local B0 shifts (Figure 2). The calculated [Mg2+free] maps reflect these local differences (Figure 3a and b) and show comparable structures in all volunteers. Local differences were also observable in the pH maps (Figure 3c).The [Mg2+free] maps generated according to the two mentioned approaches resemble each other in structure, but deviate in the calculated absolute values (Figure 3a and b). Absolute [Mg2+free] values calculated according to Widmaier et al. deviated on average by 0.33 mM from the values calculated after Barker et al.
The ROI analysis showed varying [Mg2+free] values for different muscle groups (Table 1).
Discussion
The observed local differences in β-ATP chemical shifts most likely reflect physiological differences (e.g. due to different muscle fiber compositions), as B0 field inhomogeneity (shifts persist after correction) and fitting uncertainties (Cramer-Rao Lower Bounds are smaller than the observed chemical shift differences) can be excluded as reasons. This is further supported by similar observed structures in pH and [Mg2+free] maps. A mutual effect on pH and [Mg2+free] calculation is unlikely, as [Mg2+free] concentrations are too low to explain the Pi shifts and β-ATP shifts are too strong to be induced by pH only.Local differences in [Mg2+free] have been reported before6, and the herein calculated values using the approach by Widmaier et al. agree with the reported ones for the muscle gastrocnemius. However, the calculated [Mg2+free] values using the approach by Barker et al. are significantly higher than those reported previously6,7. A possible reason could be the inclusion of the local pH value into the calculations of [Mg2+free] in this approach.
The total measurement time of the acquired datasets at 56 min is relatively long, but could be potentially reduced by factor of 2, as the signal-to-noise ratio of the spectra is sufficiently high.
Conclusion
31P MRSI at B0=7T enables the volumetric mapping of free, intracellular magnesium ion concentration in the human calf muscle, with voxels sizes of about 1 ml. The local differences in [Mg2+free] values observed in healthy volunteers most likely result from different muscle fiber compositions of various muscle groups. Depending on the evaluation method, different absolute [Mg2+free] values were obtained, showing the need for future validation of these approaches.Acknowledgements
No acknowledgement found.References
1. de Graaf RA. In Vivo NMR Spectroscopy: Principles and Techniques: 2nd Edition.; 2007.
2. Gupta RK, Benovic JL, Rose ZB. The determination of the free magnesium level in the human red blood cell by 31 P NMR. J Biol Chem. 1978;253(17):6172-6176.
3. Golding EM, Golding RM. Interpretation of 31PMRS spectra. Neurology.
4. Korzowski A, Bachert P. High-resolution 31 P echo-planar spectroscopic imaging in vivo at 7T. Magn Reson Med. 2018;79(3):1251-1259.
5. Barker PB, Butterworth EJ, Boska MD, Nelson J, Welch KMA. Magnesium and pH imaging of the human brain at 3.0 Tesla. Magn Reson Med. 1999;41(2):400-406.
6. Widmaier S, Hoess T, Jung WI, Staubert A, Dietze GF, Lutz O. 31P NMR Studies of human soleus and gastrocnemius show differences in the Jγβ coupling constant of ATP and in intracellular free magnesium. Magn Reson Mater Physics, Biol Med. 1996;4(1):47-53.
7. Iotti S, Malucelli E. In vivo assessment of Mg2+ in human brain and skeletal muscle by 31P-MRS. Magnes Res. 2008;21(3):157-162.
8. Vanhamme L, Van Huffel S. AMARES: Advanced Method for Accurate, Robust and Efficient Spectral fitting of MRS data with use of prior knowledge. J Magn Reson. 1997;43(129):1-2.
9. Nolden M, Zelzer S, Seitel A, et al. The medical imaging interaction toolkit: Challenges and advances: 10 years of open-source development. Int J Comput Assist Radiol Surg. 2013;8(4):607-620.
Figures