2964
Differential modulation of the cerebral energy consumption by two different tDCS settings as measured by 31P MR spectroscopy1INM-4, Forschungszentrum Juelich, Juelich, Germany, 2Department of Neurology, RWTH Aachen University Hospital, Aachen, Germany, 3INM-11, Forschungszentrum Juelich, Juelich, Germany, 4JARA-BRAIN-Translational Medicine, Aachen, Germany, 5Department of Neurology, RWTH Aachen University, Aachen, Germany
Synopsis
Abnormalities in energy regulation are thought to be linked to neurodegenerative and neuropsychiatric disorders. Here, we modulated the brain activity in M1 using sham/anodal tDCS with two different settings, and examined the effect on high-energy metabolites using in vivo 31P-MRS. PCr/Pi and ATP/Pi values showed a decreasing trend following the stimulation compared to the sham measurements and a statistically significant difference was shown between Pre-stimulation and Post-stimulations. However, differences in both PCr/Pi and ATP/Pi were not statistically significant when either a 10- or 20-minute stimulation protocol was applied, but longer stimulation showed a prolonged decrease in both PCr/Pi and ATP/Pi.
Introduction
The cerebral energy status is crucial for the regulation of all metabolic systems involved in human energy homeostasis.1 Several studies have provided molecular and neurophysiological evidence linking, for example, energy metabolism to metabolic syndrome2 in certain brain areas and it is thought that altered energy regulation could be associated with neuropsychiatric disorders3 and neurodegenerative diseases.4 Transcranial direct current stimulation (tDCS) is a non-invasive brain stimulation technique frequently used to enable the modulation of neuronal excitability and energy in humans. Previous studies have shown that spontaneous firing rates of cortical neurons in the primary motor cortex (M1) of the brain can be increased following anodal tDCS, leading to neuronal energy consumption.5 This modulation in energy is likely mediated by a decreased concentration of high-energy phosphates, e.g. adenosine triphosphate (ATP), phosphocreatine (PCr).However, the impact on energy regulation as a result of stimulation parameters, i.e. current amplitude and duration remains unclear and finding appropriate and optimal conditions for the treatment of disease is crucial. In order to evaluate the effect of the stimulation duration, we deliberately modulated the brain activity in M1 using anodal tDCS with 10- and 20-minute stimulation protocols, and examined the cerebral energy consumption using in vivo phosphorus MR spectroscopy (31P-MRS).
Material and methods
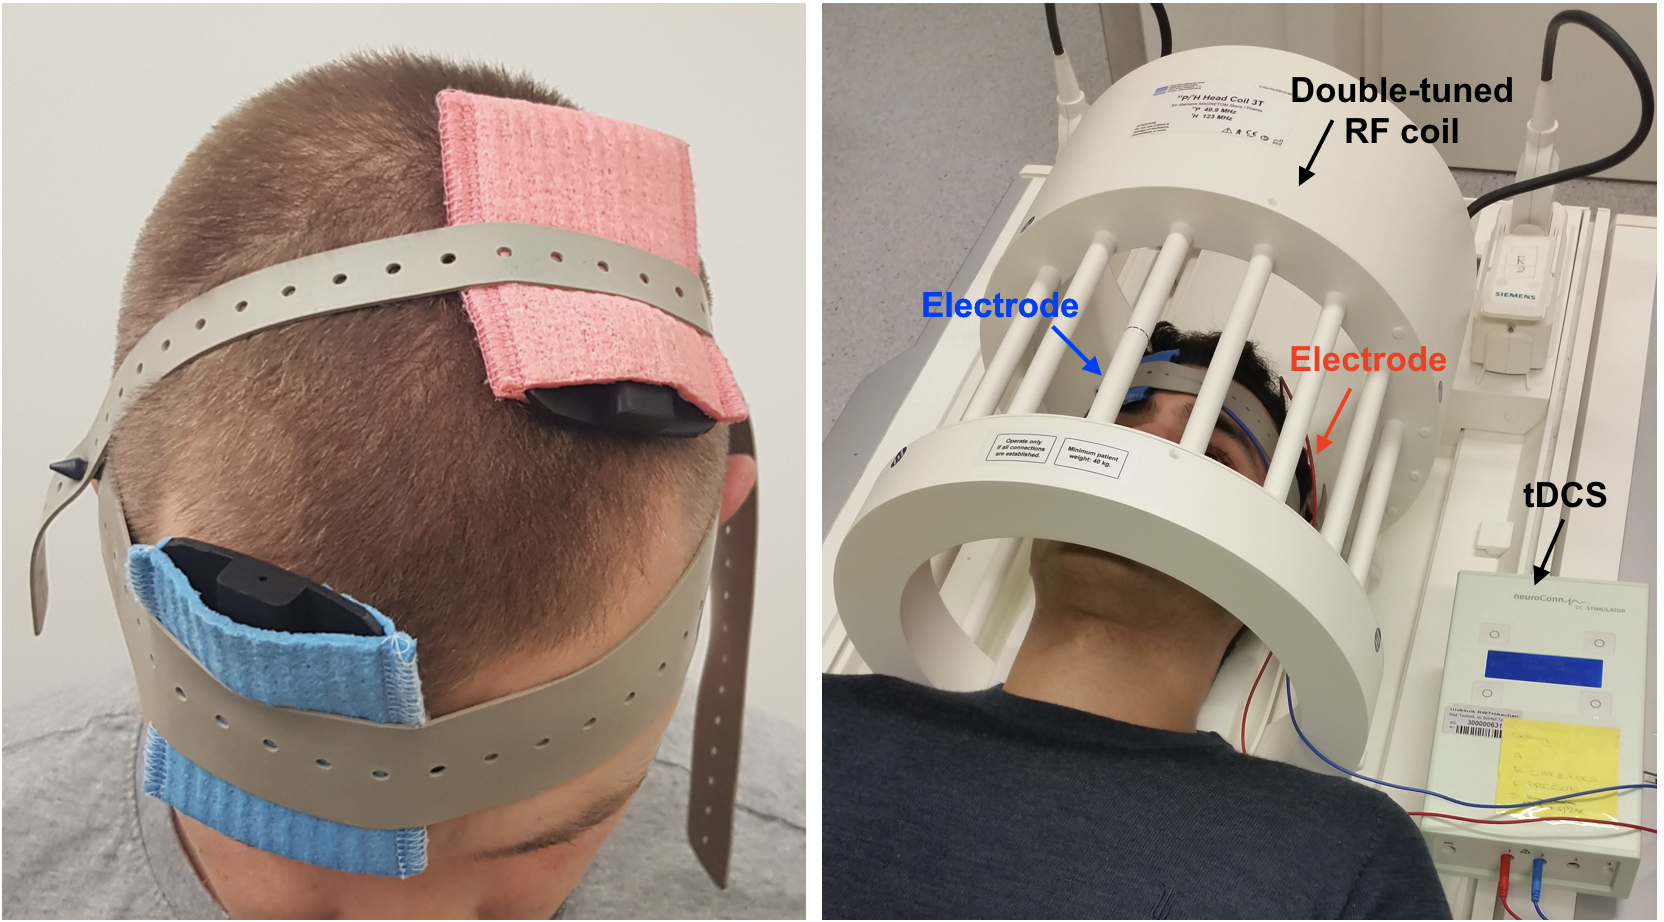
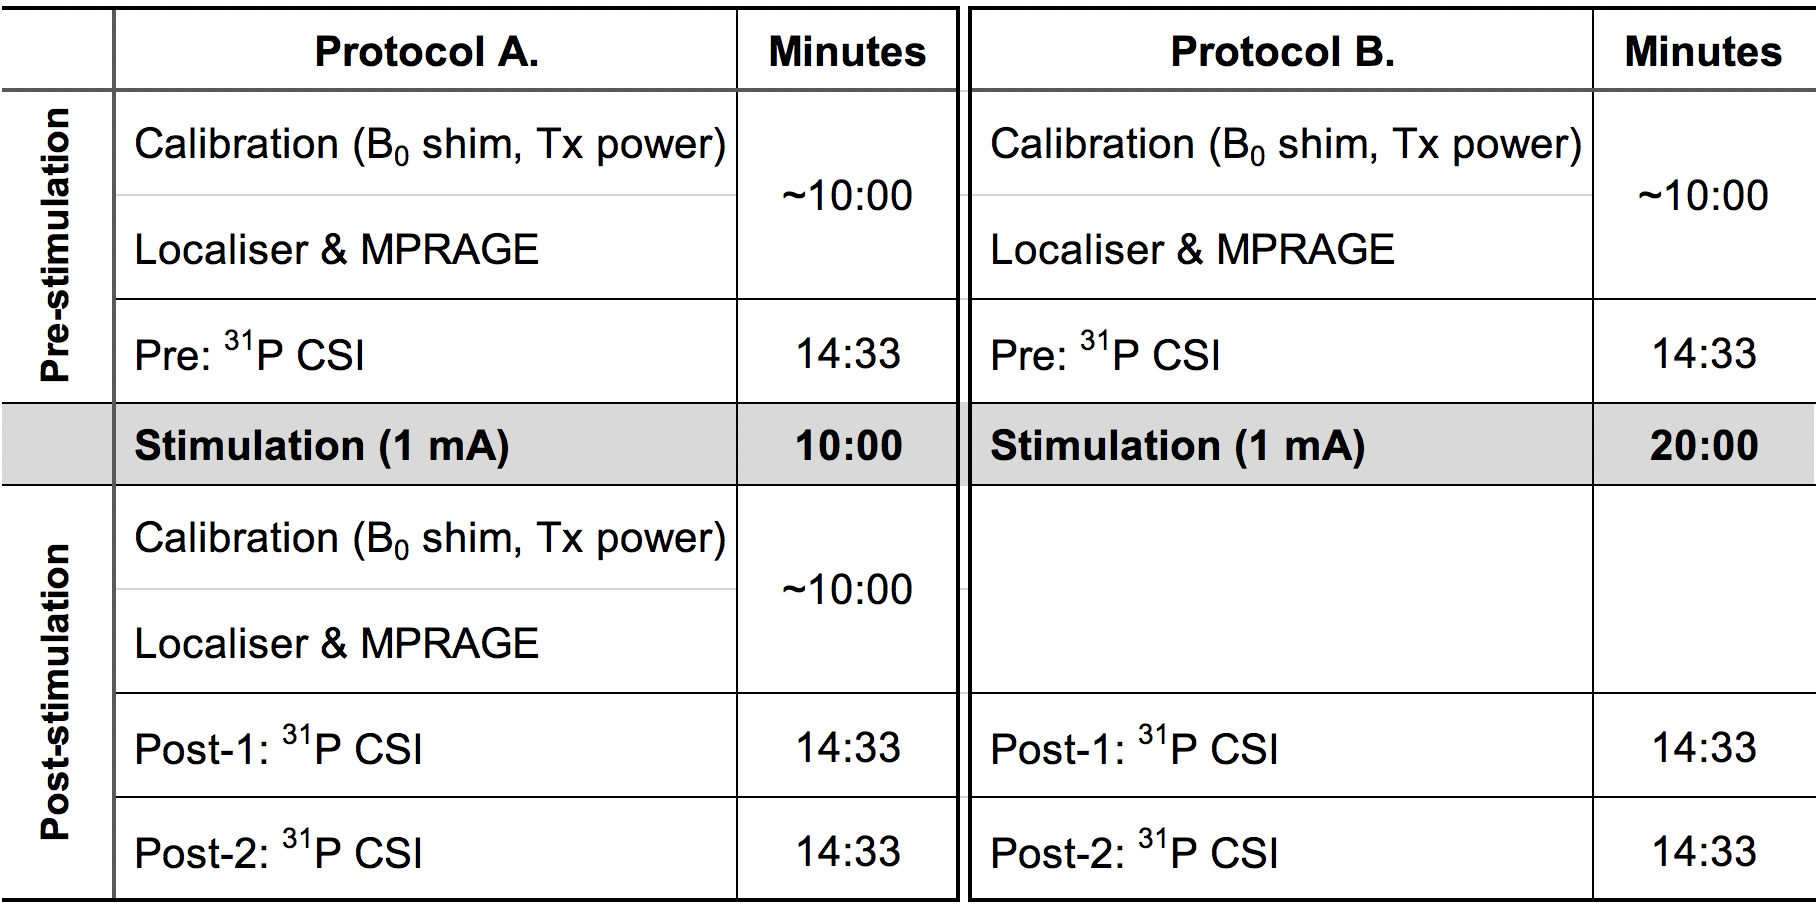
After informed consent was obtained in compliance with ethical and legal requirements, ten healthy volunteers (6 anodal and 4 sham) with no history of neurological or psychiatric diseases were recruited.All MR measurements were performed on a clinical 3 T MRI system using a double-tuned, 1H/31P head coil. Each experimental session started with an RF power calibration and shimming, and the acquisition of whole-brain anatomical images using an MP-RAGE sequence. The 3D anatomical image was then used to precisely locate a 30 × 30 × 30 mm3 voxel-of-interest within the hand area of the left M1. Figure 1 shows the position of the electrodes of tDCS and the overall setup for MRI. 31P-MR spectra were obtained using a nuclear Overhauser effect (NOE) enhanced 3D CSI sequence (TR = 3730 ms, TE = 2.3 ms, 6 averages, NOE = Waltz4).
Figure 2 shows an overview of the experimental scheme used in this study. One reference 31P spectrum was attained without the application of stimulation (Pre). Following sham or anodal stimulation, two consecutive post-stimulation measurements (Post-1 and Post-2) were carried out. In anodal stimulations, a 1 mA current was applied for two different durations, 10 or 20 minutes.
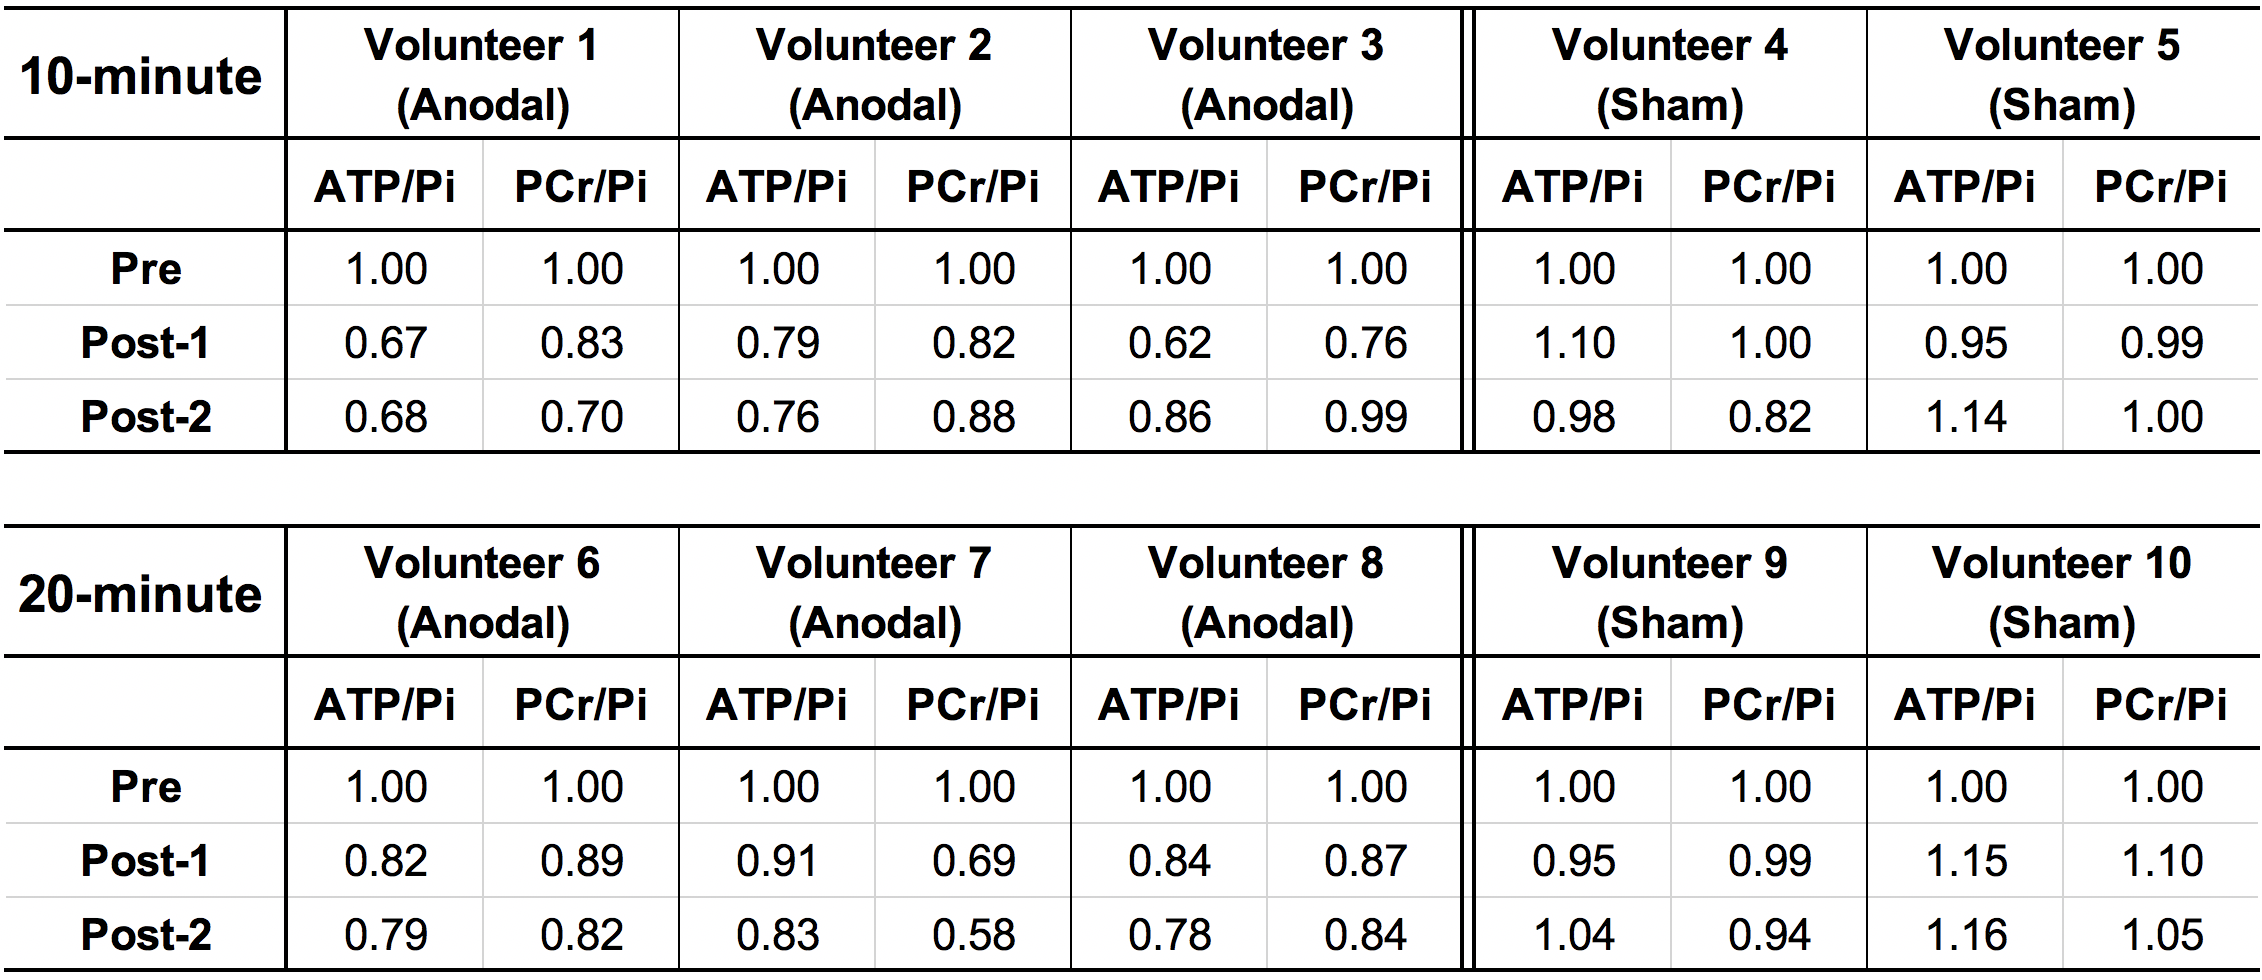
All 31P-MRS data were processed using the advanced method for the accurate, robust and efficient spectral fitting algorithm in the jMRUI software package.6 Phase and baseline corrections were applied to all baseline 31P spectra prior to the spectral fitting. The fitting also included prior knowledge of the expected frequencies of all 31P peaks. In order to investigate whether 10- and 20-minute tDCS protocols led to different stimulation effects, we calculated the values of g-ATP/Pi and PCr/Pi and conducted a one-way analysis of variance (ANOVA) with multiple comparison correction with p < 0.05. We compared the changes of ATP/Pi and PCr/Pi both in sham and anodal conditions between group 1 (10-minute) and group 2 (20-minute) for 2 time points (Post-1 and Post-2), separately. We also conducted ANOVA with p = 0.05 and compared the values of ATP/Pi and PCr/Pi for anodal stimulation (Pre, Post-1 and Post-2) for group 1 and group 2 separately. The effect size η² for ANOVA was also calculated.
Results
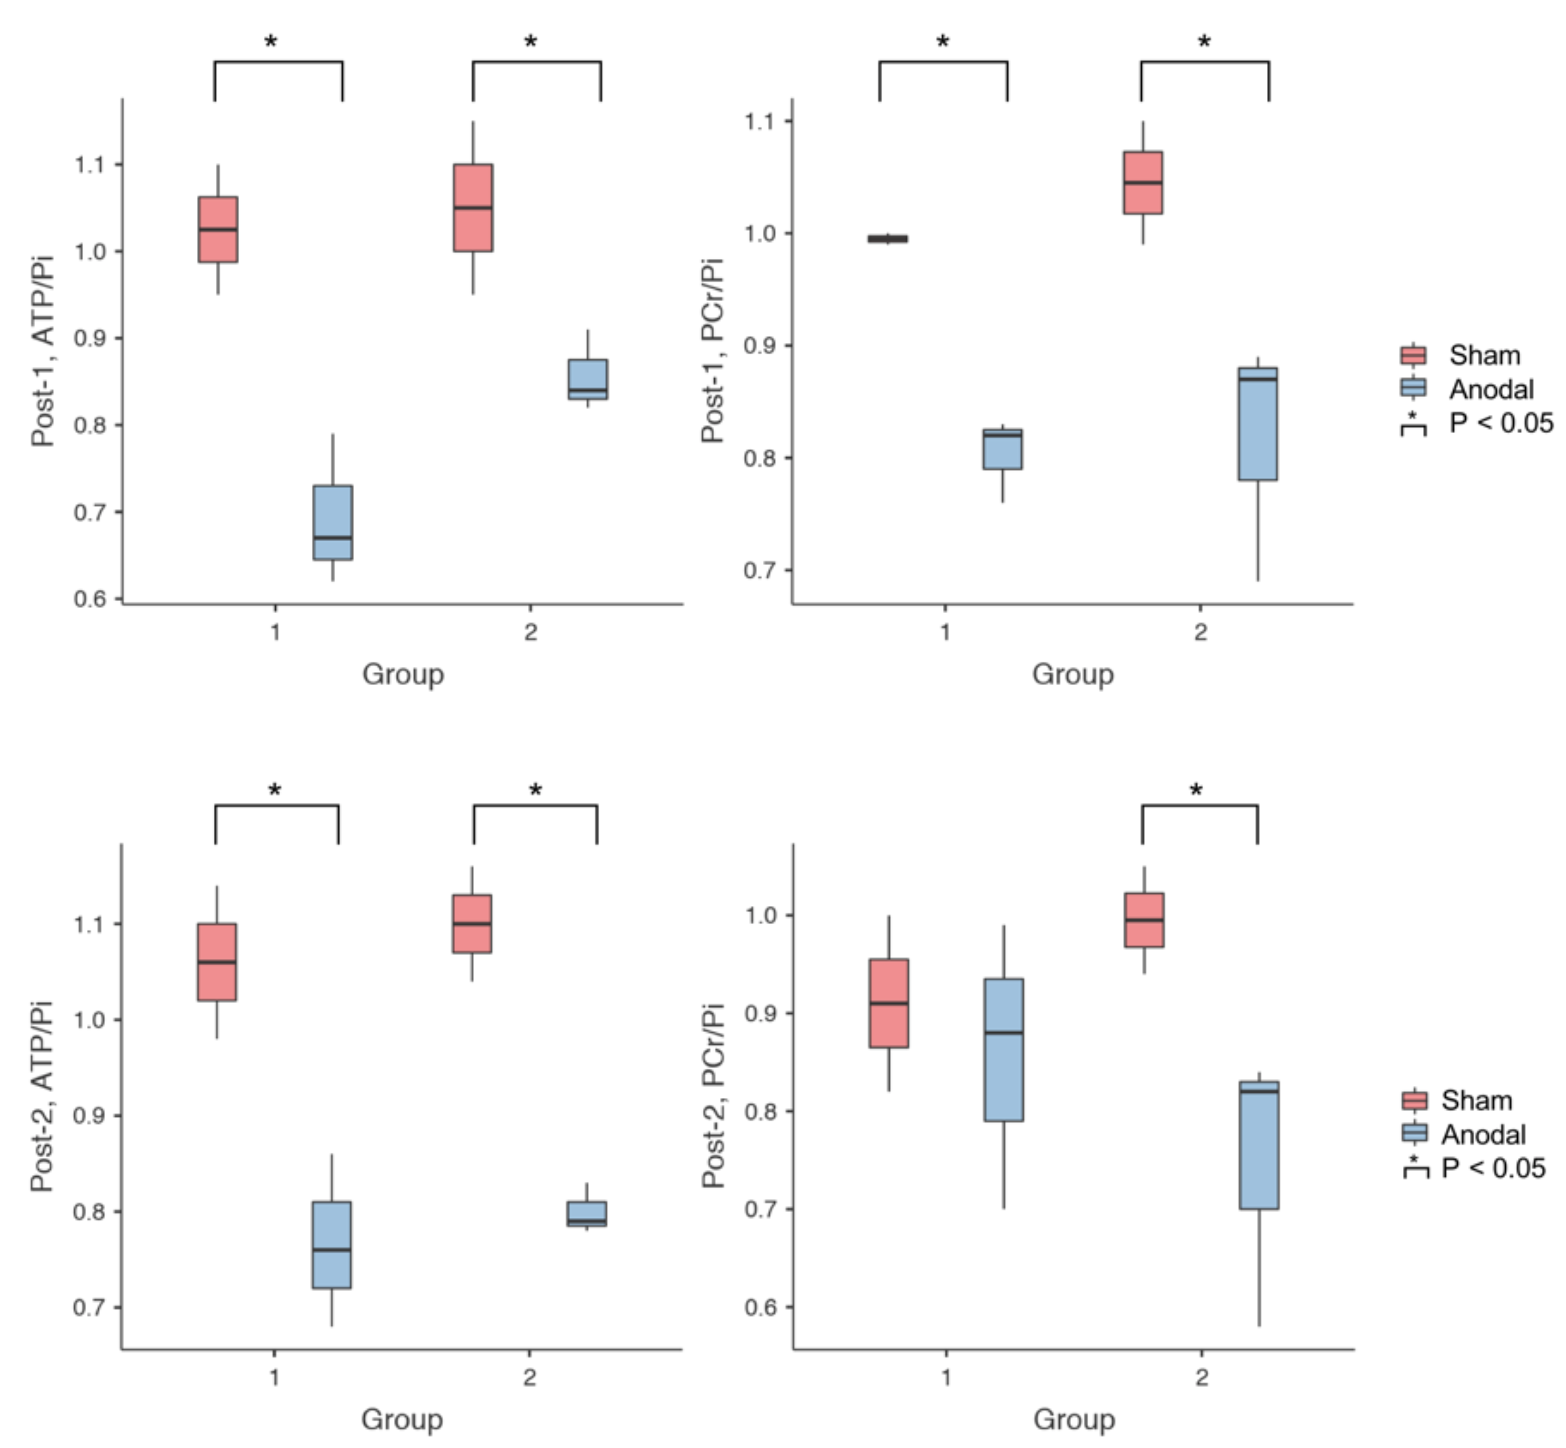
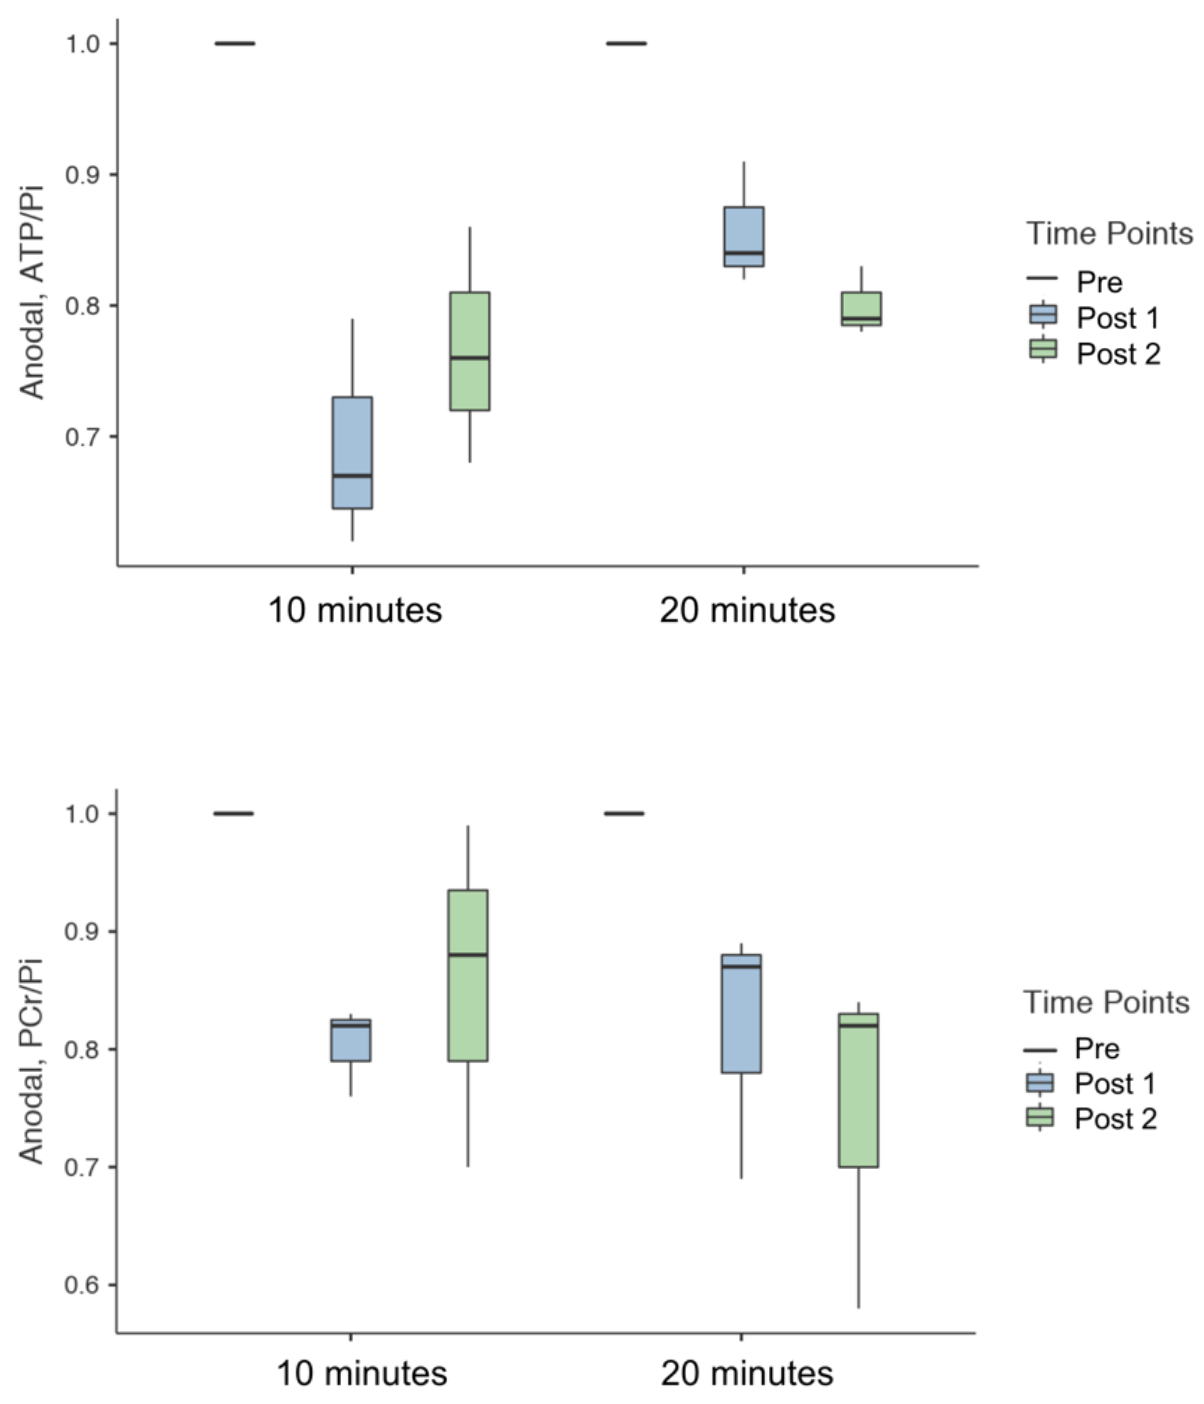
Figure 3 summarises the values of 31P metabolites, i.e. ATP/Pi and PCr/Pi. The Post-1 and Post-2 were normalised to the Pre-stimulation. Figure 4 shows the statistical differences between sham and anodal tDCS, regardless of the stimulation duration. The differences for ATP/Pi and PCr/Pi Post-1 (as well as Post-2, except PCr/Pi) are significant compared to the Pre-stimulation values, which is in agreement with previous examinations.5 The boxplots shown in Figure 5 display the effects of 10-minute and 20-minute stimulations. Although the results for Post-1 and Post-2 using a 20-minute anodal stimulation protocol are slightly higher in comparison to that using a 10-minute protocol, there were no statistically significant differences.Discussion
We have demonstrated the effect of using different settings of stimulation on high-energy metabolites in the brain (in M1) in healthy volunteers. PCr/Pi tended to follow a decreasing trend following the anodal stimulation in comparison to the sham4 but did not reach a statistically significant difference using either the 10- or 20-minute stimulation protocols. ATP/Pi values also decreased after the stimulation and showed a statistically significant difference between Pre and Post-1, as well as Pre and Post-2 values. This effect was also seen in both 10-minute and 20-minute stimulation protocols. However, the effect size was slightly higher in the 20-minute protocol compared to the 10-minute protocol (10-minute: η² = 0.83 and 20-minute: η² = 0.916). Additionally, the stimulation effect seemed to be prolonged in the 20-minute protocol. No statistically significant difference was found in the values of ATP/Pi between Post-1 and Post-2 time points. In the future, we intend to study the effect with various selections of current strength and duration, and also intend to apply this to patient groups.Acknowledgements
No acknowledgement found.References
1. Peters A, et al. The selfish brain: competition for energy resources. Neurosci Biobehav R. 2004;28:143.
2. Soares MJ, Cummings NK, Ping-Delfos WLCS. Energy metabolism and the metabolic syndrome: Does a lower basal metabolic rate signal recovery following weight loss? Diabetes Metab Syndr. 2011;5(2):98-101.
3. Penninx BWJH, Lange SMM. Metabolic syndrome in psychiatric patients: overview, mechanisms, and implications. Dialogues Clin Neurosci. 2018;20(1):63-73.
4. Bonvento G, et al. Imaging and spectroscopic approaches to probe brain energy metabolism dysregulation in neurogenerative diseases. J Cerebr Blood F Met. 2017;37(6):1927-1943.
5. Binkofski F, et al. Brain Energy Consumption Induced by Electrical Stimulation Promotes Systemic Glucose Uptake. Biol Psychiat. 2011;70(7):690-5.
6. Vanhamme L, van den Boogaart A, Van Huffel S. Improved method for accurate and efficient quantification of MRS data with use of prior knowledge. JMR. 1997;129(1):35-43.
Figures