2963
31P Transversal Relaxation Times in the Human Brain at 9.4T1High-Field MR Center, Max Planck Institute for Biological Cybernetics, Tübingen, Germany, 2Advanced Imaging Research Center, UT Southwestern Medical Center, Dallas, TX, United States
Synopsis
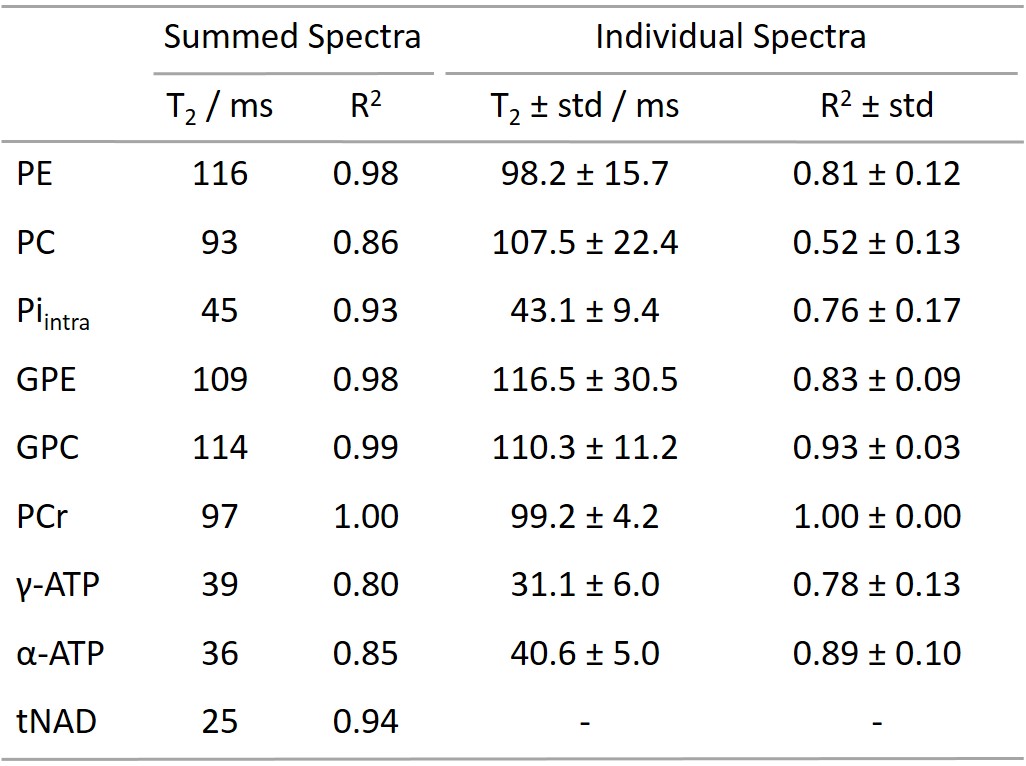
31P transversal relaxation times in the human brain at 9.4T are reported. These values are useful to optimize measurement protocols, and to perform absolute quantification. Measurements were performed using a STEAM sequence. To account for J-evolution of homonuclear spin-spin coupled metabolites, basis sets were modeled in VeSPA and spectra were fitted in LCModel. The measured T2 relaxation times are between 93ms and 116ms for phosphomonoesters and –diesters and PCr, and between 25ms and 45ms for Piintra, ATP and tNAD.
Introduction
Phosphorus MR spectroscopy is a powerful tool to noninvasively assess bioenergetics of the human brain. To optimize spectroscopy sequences, and to get quantitative metabolite concentrations, the field strength (B0) dependent T1 and T2 relaxation times are of high importance. T1 31P relaxation times have recently been measured in the human brain at 9.4T1, but T2 relaxation times were only determined at lower B02-5. This study aims to determine transversal relaxation times in the human brain at 9.4T using a STEAM6 sequence.Methods
Experiments were performed on a 9.4T whole-body MRI scanner (Siemens) using a home-built double-tuned 31P/1H human head array7. In order to increase the transmit field strength (B1+) locally, the entire power was only applied to the three bottom 31P coil elements using a 3-way power splitter.For spatial localization, a 31P STEAM sequence with Hamming-windowed sinc pulses (1.5ms, TBWP: 6.0, TR: 5s, TM: 5ms) and a four step cogwheel phase cycling scheme (COG4(0,1,2;3))8 was used. A volume of interest (5x5x5cm3) was chosen in the occipital lobe. 5 healthy volunteers (29.6 ± 2.7 years, 3 female, 2 male) were recruited.
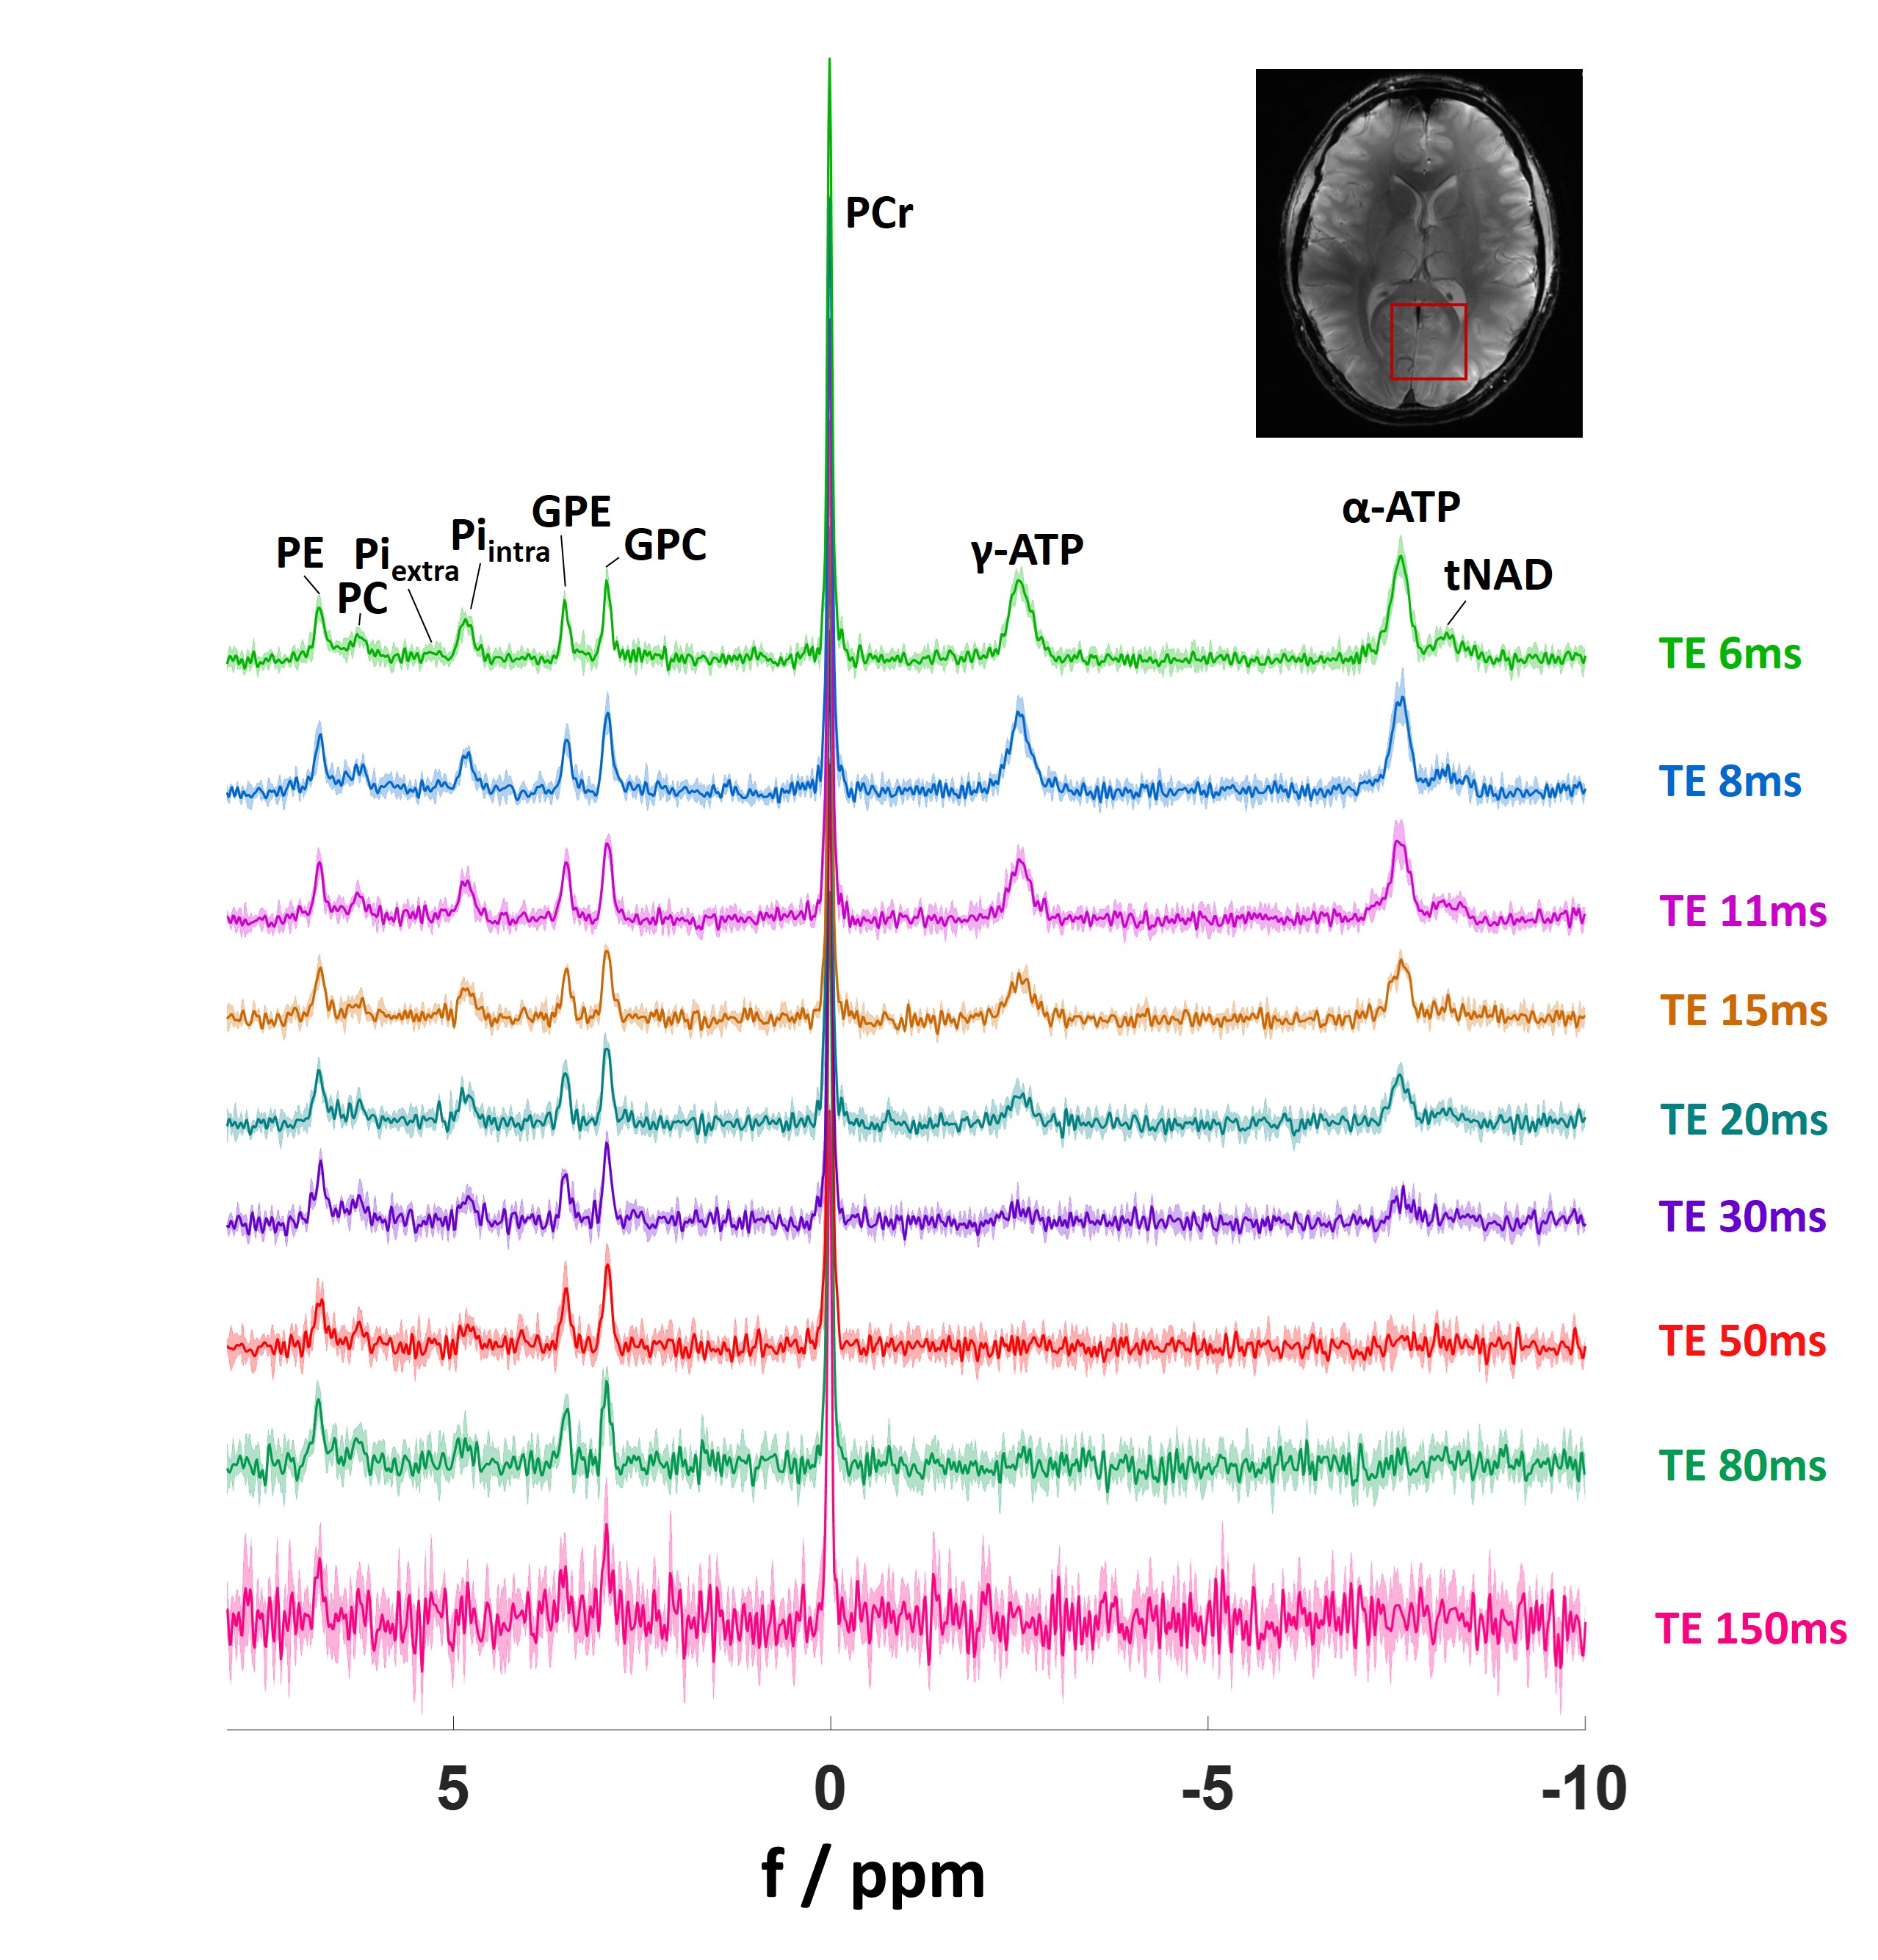
An echo-time series (TE = 6, 8, 11, 15, 20, 30, 50, 80, 150ms, Fig. 1) with NEX = 116 was chosen to characterize the T2 relaxation times.
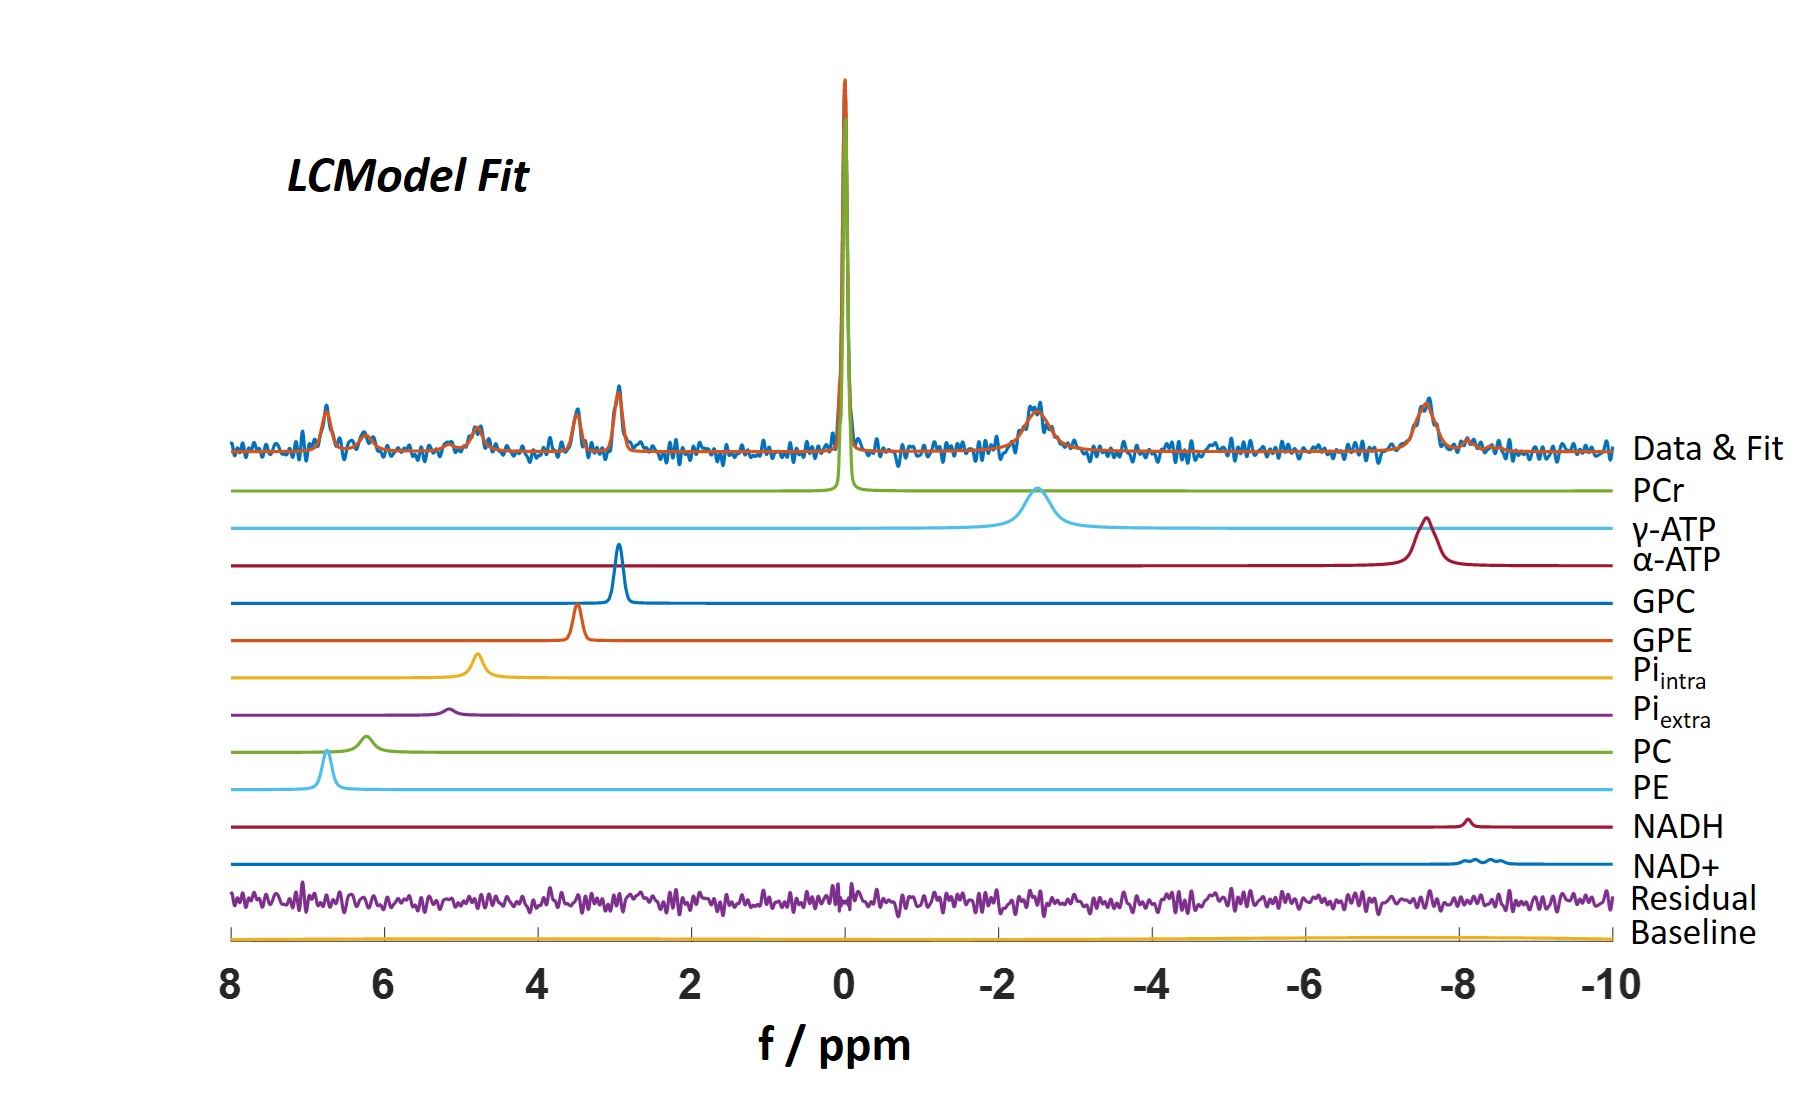
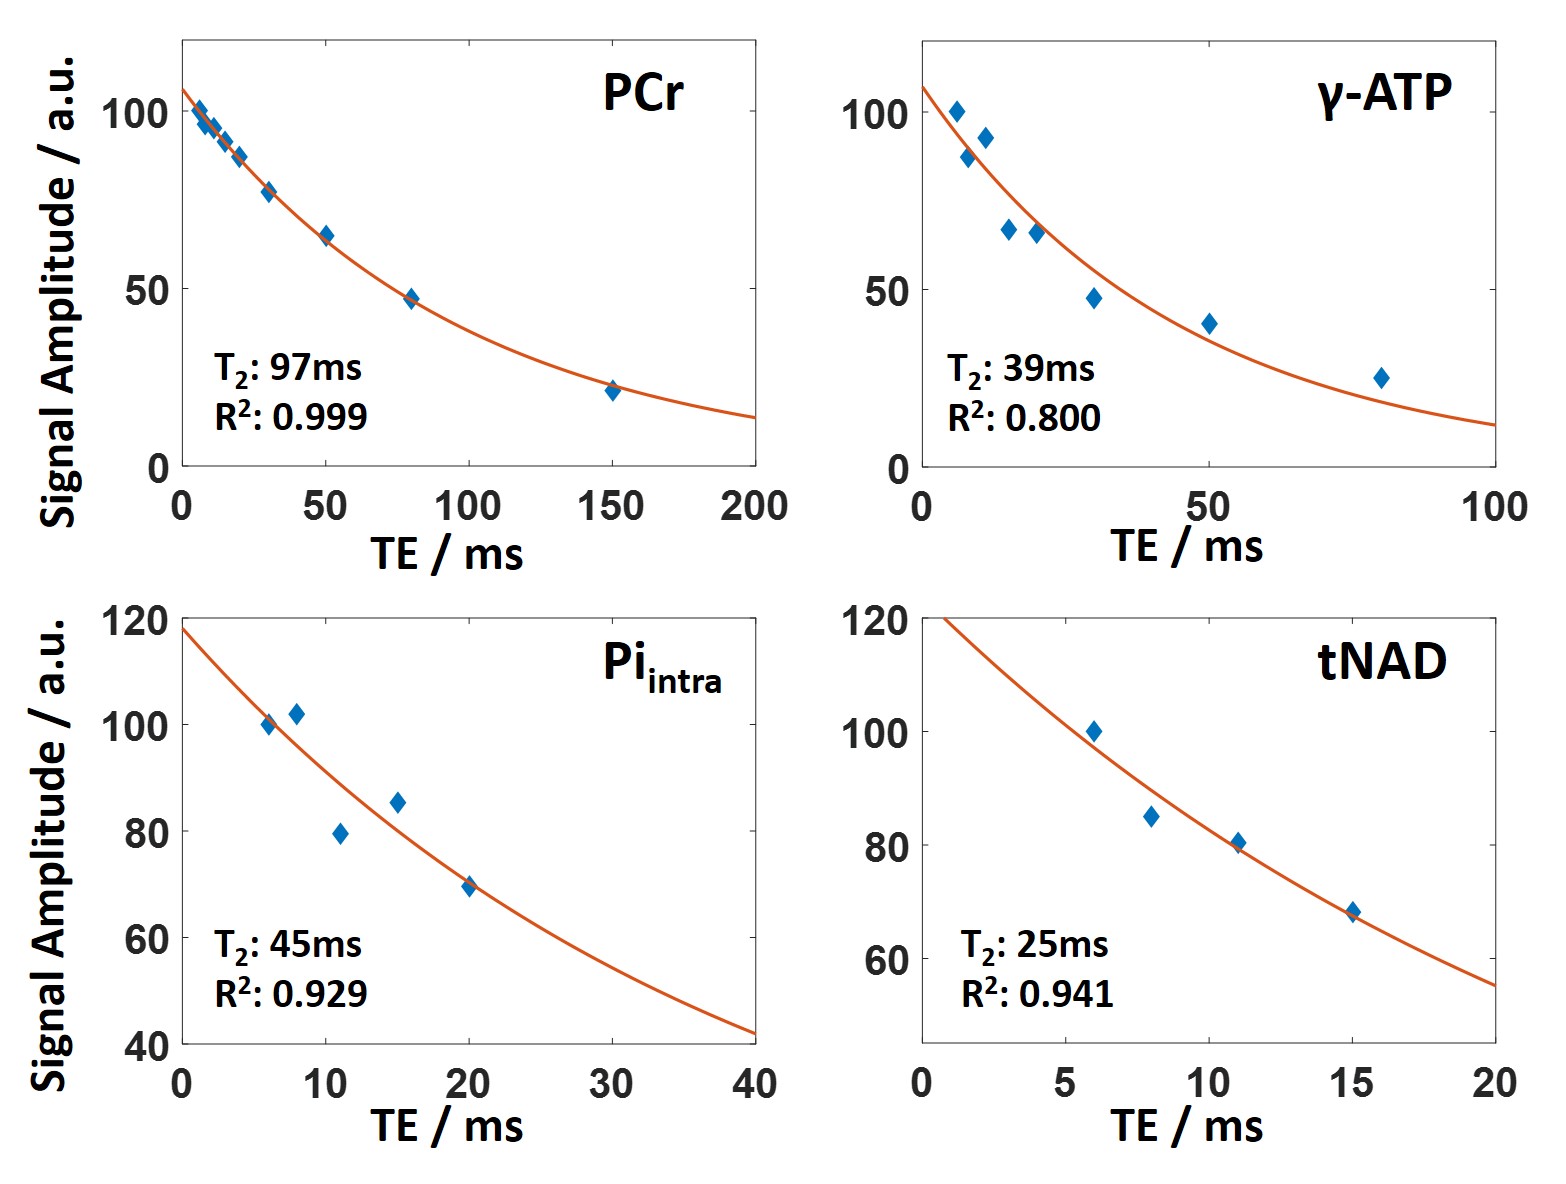
Raw data were processed by an in-house written MATLAB software. Since T2 relaxation times of homonuclear spin-spin coupled resonances, such as ATP, are affected by J-coupling9, basis sets that fully consider J-evolution were simulated using the VeSPA simulation tool10 with an ideal STEAM sequence matching our TM and TEs. In the fit model, Lorentzian linewidths were adjusted for every metabolite separately. Summed and individual spectra were then fitted using LCModel (v-6.3)11, as suggested by Deelchand et al12 (Fig. 2). For T2 calculations, a single exponential two-parameter fit was applied to the TE specific metabolite concentrations.
Results
Figure 1 shows mean spectra and their standard deviations for the echo time series across all subjects. Note that all spectra were normalized to PCr. Spectra show good consistency across subjects. 9 metabolites from phosphomonoesters to total NAD (NADH, NAD+) are clearly visible. A sample LCModel fit of an individual spectrum with TE = 8ms is shown in Figure 2.Representative fits to the exponential T2 relaxation model are presented in Figure 3 for signal amplitudes obtained from the summed spectra fits of different metabolites. Fits are shown for the highest SNR metabolite PCr and the lowest SNR metabolite tNAD as well as for two intermediate SNR metabolites γ-ATP and Piintra. Average coefficients of determination for fits of individual spectra are R2 = 1.0 ± 0.0 for PCr and range between 0.76 ≤ R2 ≤ 0.93 for all other metabolites except PC, which is significantly lower (R2 = 0.52). Coefficients of determination for the summed spectra are higher for all metabolites and range between 0.80 ≤ R2 ≤ 1.0. Reliable fitting of tNAD is only possible for signal intensities obtained from summed spectra. Detailed results of all T2 relaxation times and R2 for all investigated metabolites are summarized in Table 1. Overall, the calculated transversal relaxation times of per subject observations and summed observations agree well.
Discussion
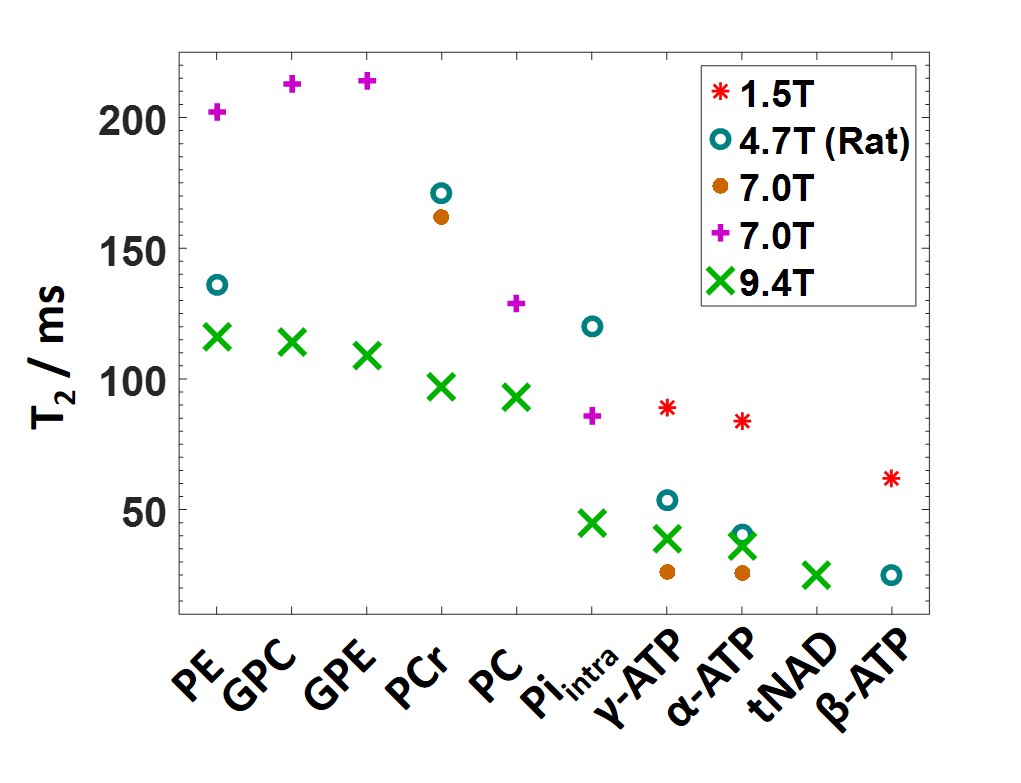
This work presents T2 relaxation times of nine 31P metabolites measured in the human brain at 9.4T. Calculated T2 for PC shows a high inter-subject variation and a low fit precision. This suggests that PC cannot accurately be fitted in a per subject spectrum, and T2 values for PE and PC obtained from spectra summed across subjects are more reliable. For summed spectra, it is possible to reliably fit tNAD to calculate T2. The summation of the two metabolites NAD+ and NADH could lead to errors, but gives a first hint on the expected order of magnitude of their T2 relaxation time.In the literature, there is a large variation in T2 values reported by other groups, especially for ATP (Figure 4). Our measured T2 values are in good agreement with relaxation times at 1.5T2 and 7T5 and rat data at 4.7T13. A decrease in T2 for all metabolites can be seen. However, there are several groups that report lower ATP T2 at lower fields3,4 which contradicts the theoretically predicted reduction in T2 at higher fields due to dominating chemical shift anisotropy14. These lower ATP T2 values reported may be attributed to an incomplete accounting of the influence of the homonuclear J-coupling of ATP on the behavior of spin echoes2,9,15. In our study, we modeled and fitted ATP as a J-coupling spin system for correct T2 estimation, which yields results comparable to T2 values measured with frequency selective sequences.
Conclusion
31P transversal relaxation times of human brain metabolites at 9.4T are reported. Our results add to previous work and characterize nine human brain T2 relaxation times in one measurement series. Also, we report a tNAD T2 relaxation time, which was not taken into account at lower field strengths. The results are useful for absolute quantification of 31P metabolites in healthy subjects, but also confirm the limited usability of echo-base MRS methods at UHF.Acknowledgements
Funding by the European Union (ERC Starting Grant, SYNAPLAST MR, Grant Number: 679927 and Horizon 2020, CDS-QUAMRI, Grant Number: 634541) and by the Cancer Prevention and Research Institute of Texas (CPRIT) (Grant Number: RR180056) is gratefully acknowledged.References
1Pohmann R, Raju S, Scheffler K. T1 values of
phosphorus metabolites in the human visual cortex at 9.4T. Proc. Intl. Soc.
Mag. Reson Med. 2018;26:3994.
2Jung S, Widmaier S, Bunse M, et al. 31P
Transverse Relaxation Times of ATP in Human Brain in Vivo. Magn Reson Med.
1993;30:741-743.
3Merboldt KD, Chien D, Haenicke W, et al. Localized
31P NMR Spectroscopy of the Adult Human Brain in Vivo Using Stimulated-Echo
(STEAM) Sequences. J Magn Reson.
199;90:343-361.
4Lei H, Zhu X-H, Zhang X-L, et al. In
Vivo 31P Magnetic Resonance Spectroscopy of the Human Brain at 7T: An Initial
Experience. Magn Reson Med. 2003;49:199-205.
5Van der Kemp JM, Klomp DWJ, Wijnen JP. 31P T2s
of Phosphomonoesters, Phosphodiesters, and Inorganic Phosphate in the Human
Brain at 7T. Magn Reson Med. 2019;80:29-35.
6Frahm J, Merboldt K-D, Haenicke W. Localized
Proton Spectroscopy Using Stimulated Echoes. J Magn Reson. 1986;72:502-508.
7Avdievich NI, Ruhm L, Dorst J, et al. Double-Tuned
31P/1H Human Head Array with High Performance at Both Frequencies for Chemical Shift
Spectroscopic Imaging (CSI) at 9.4T. Proc. Intl. Soc. Mag. Reson Med.
2019;26:3994.
8Landheer K, Juchem C. Simultaneous optimization
of crusher and phase cycling schemes for magnetic resonance spectroscopy – and
extension of DOTCOPS. Magn Reson Med. 2019;00:1-12.
9Straubinger K, Jung W-I, Bunse M, et al. Spin-Echo
Methods for the Determination of 31P Transverse Relaxation Times of the ATP NMR
Signals in Vivo. Magn Reson Imaging. 1994;23:121-129.
10Soher BJ, Semanchuk P, Todd D, Steinberg J,
Young K. VeSPA: integrated applications for RF pulse design, spectral
simulation and MRS data analysis. Proc. Intl. Soc. Mag. Reson Med.
2011;19:1410.
11Provencher SW. Estimation of metabolite
concentrations from localized in vivo proton NMR spectra. Magn Reson Med. 1993;30(6):672-9.
12Deelchand DK, Nguyen T-M, Zhu X-H, et al. Quantification
of in vivo 31P NMR brain spectra using LCModel. NMR Biomed. 2015;28:633-641.
13Remy C, Albrand JP, Benabid AL, et al. In Vivo
31P Nuclear Magnetic Resonance Studies of T1 and T2 Relaxation Times in Rat
Brain and in Rat Brain Tumors Implanted to Nude Mice. Magn Reson Med.
1987;4:144-152.
14de Graaf RA. Dynamic aspects. In vivo NMR
spectroscopy — principles and techniques, 2nd ed. Chichester, UK: John Wiley
& Sons; 2007. p 111–128.
15Mulkern RV, Greenman RL, Rybicki FJ. Comments
on Ultrahigh Field 31P ATP T2 Values. Magn Reson Med. 2003;50:654-658.
Figures