2962
Quantification of 31P Human Brain spectra at 9.4T using ISIS and SPECIAL-semiLASER1High-Field MR Center, Max Planck Institute for Biological Cybernetics, Tübingen, Germany, 2High-Field MR Center, Department of Biomedical Imaging and Image-guided Therapy, Medical University of Vienna, Vienna, Austria, 3Advanced Imaging Research Center, UT Southwestern Medical Center, Dallas, TX, United States
Synopsis
For phosphorus single voxel MR spectroscopy, ISIS is often the method of choice, but it requires an 8 steps encoding scheme and post-acquisition signal combination which makes it prone to motion. Therefore, a SPECIAL-semiLASER sequence for 31P MRS was implemented in this study, which only needs two encoding steps for 3D localization. Spectra from the human brain acquired at 9.4T with both sequences are compared in terms of absolute SNR and SNR efficiency. Absolute SNR as well as SNR efficiency is lower for SPECIAL-semiLASER, but calculated concentrations are comparable.
Introduction
For phosphorus single voxel MR Spectroscopy, ISIS1 is a commonly used localization technique. This technique offers good localization with high SNR due to short echo times, but is susceptible to stochastic sources of variation since 8 scans are required to obtain one three-dimensional spectrum2. Therefore, in this study, SPECIAL-semiLASER3,4 was implemented and tested for 31P MRS. SPECIAL-semiLASER requires a longer minimum echo time, but needs only 2 scans for localization. For both sequences, spectra were acquired from healthy resting human brains at 9.4T, and compared in terms of absolute SNR and SNR efficiency.Methods
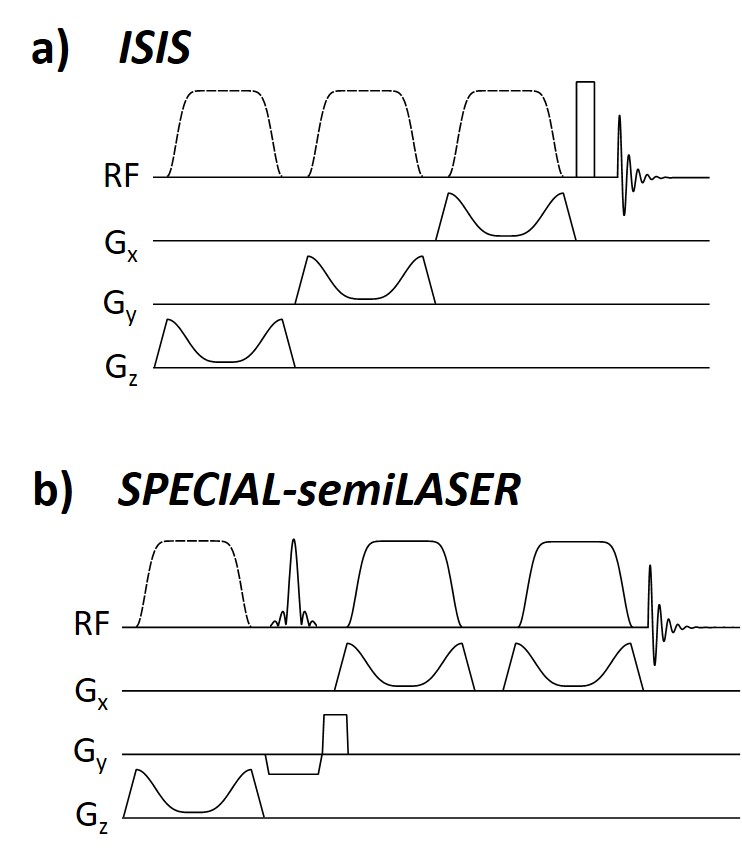
All measurements were performed on a 9.4T whole-body MRI scanner (Siemens) using a home-built double-tuned 31P/1H human head array5, in which the entire power was only applied to the three bottom 31P coil elements.In this study, the two multi-shot sequences ISIS (TE: 0.425ms) and SPECIAL-semiLASER (TE: 17ms) were compared (Fig. 1). Both sequences use GOIA-W(16,4) pulses6 (5ms, gradient amplitude 25mT/m, inversion bandwidth 12.9kHz for 3cm slices and 21.4kHz for 5cm slices7) for inversion. For excitation, ISIS uses a frequency selective rectangular pulse (0.25ms, 4.5kHz) and SPECIAL-semiLASER a slice-selective Hamming-windowed sinc pulse (1.5ms, TBWP 6.5). No phase cycling or crusher gradients were implemented.
Absolute SNR was compared with a repetition time of 25s (≥5xT18) to guarantee full relaxation. 64 averages were acquired for one volunteer (28 years). For SNR efficiency comparison, 8 healthy volunteers (28 ± 2.8 years, 4 female, 4 male) were recruited. The measurement time was 10 minutes for both sequences, which resulted in TRISIS: 5s and 120 averages, and, due to SAR limitations, in TRSPECIAL-semiLASER: 6s and 100 averages. Volumes of interest of 5x5x5cm3 and 3x3x3cm3 were chosen in the occipital lobe.
Raw data were processed (averaging, truncation, SVD coil combination based on PCr9, zero-order phase correction, no filtering) by an in-house written MATLAB software. SNR was calculated in the frequency domain as ratio between the metabolite peak heights and the spectral noise between 15 ppm and 30 ppm. For quantification, data were fitted using an in-house written MATLAB implementation of AMARES10. The model function was optimized in a way to match the Voigt line shape. Obtained concentrations were corrected for T18 and T2 relaxation (recently measured at our institute).
Results
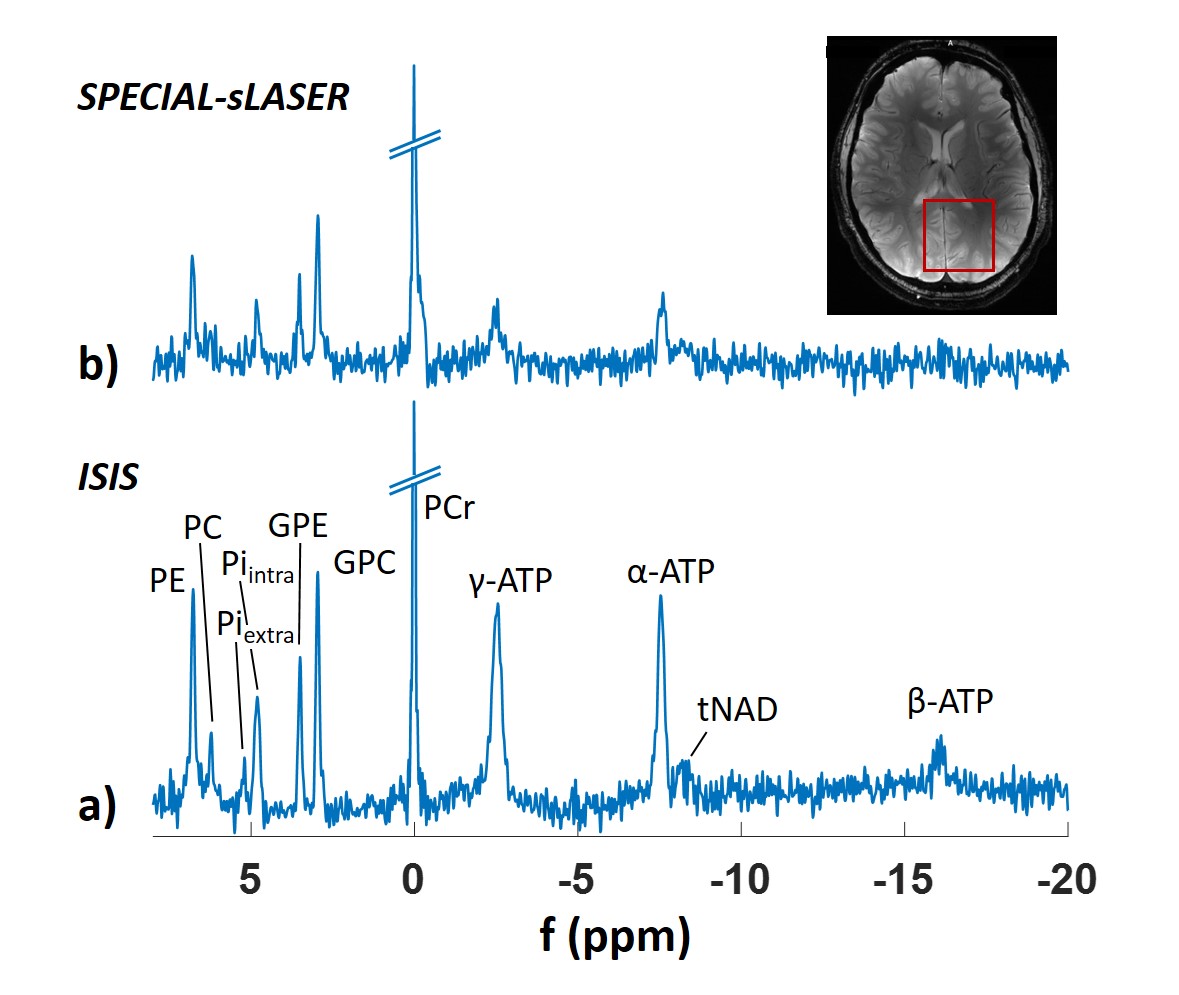
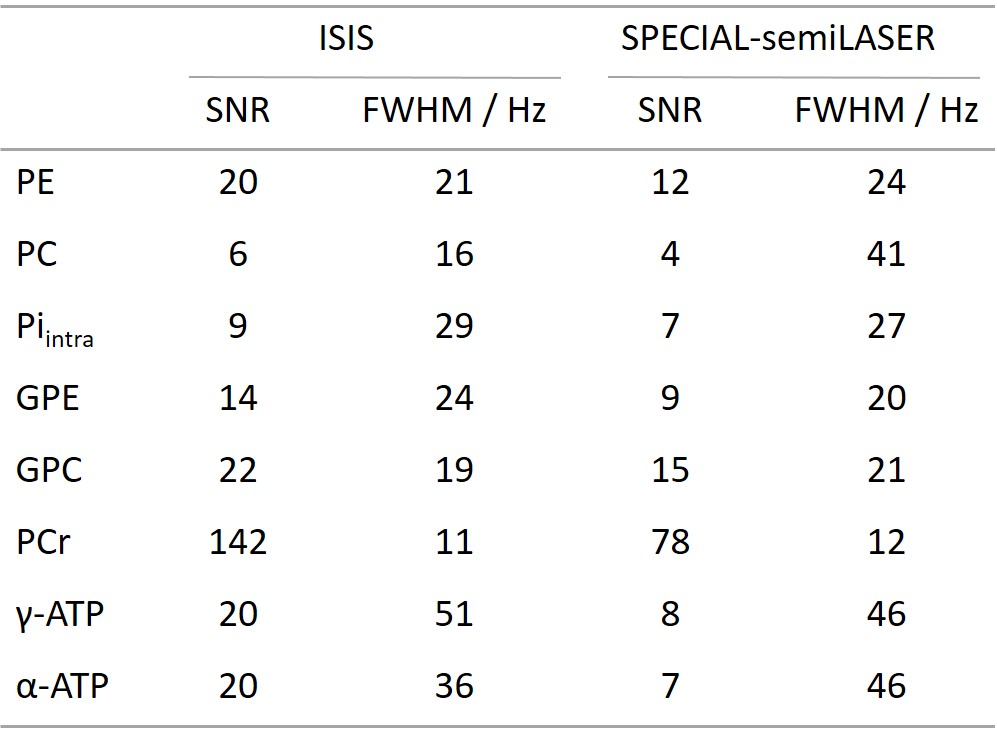
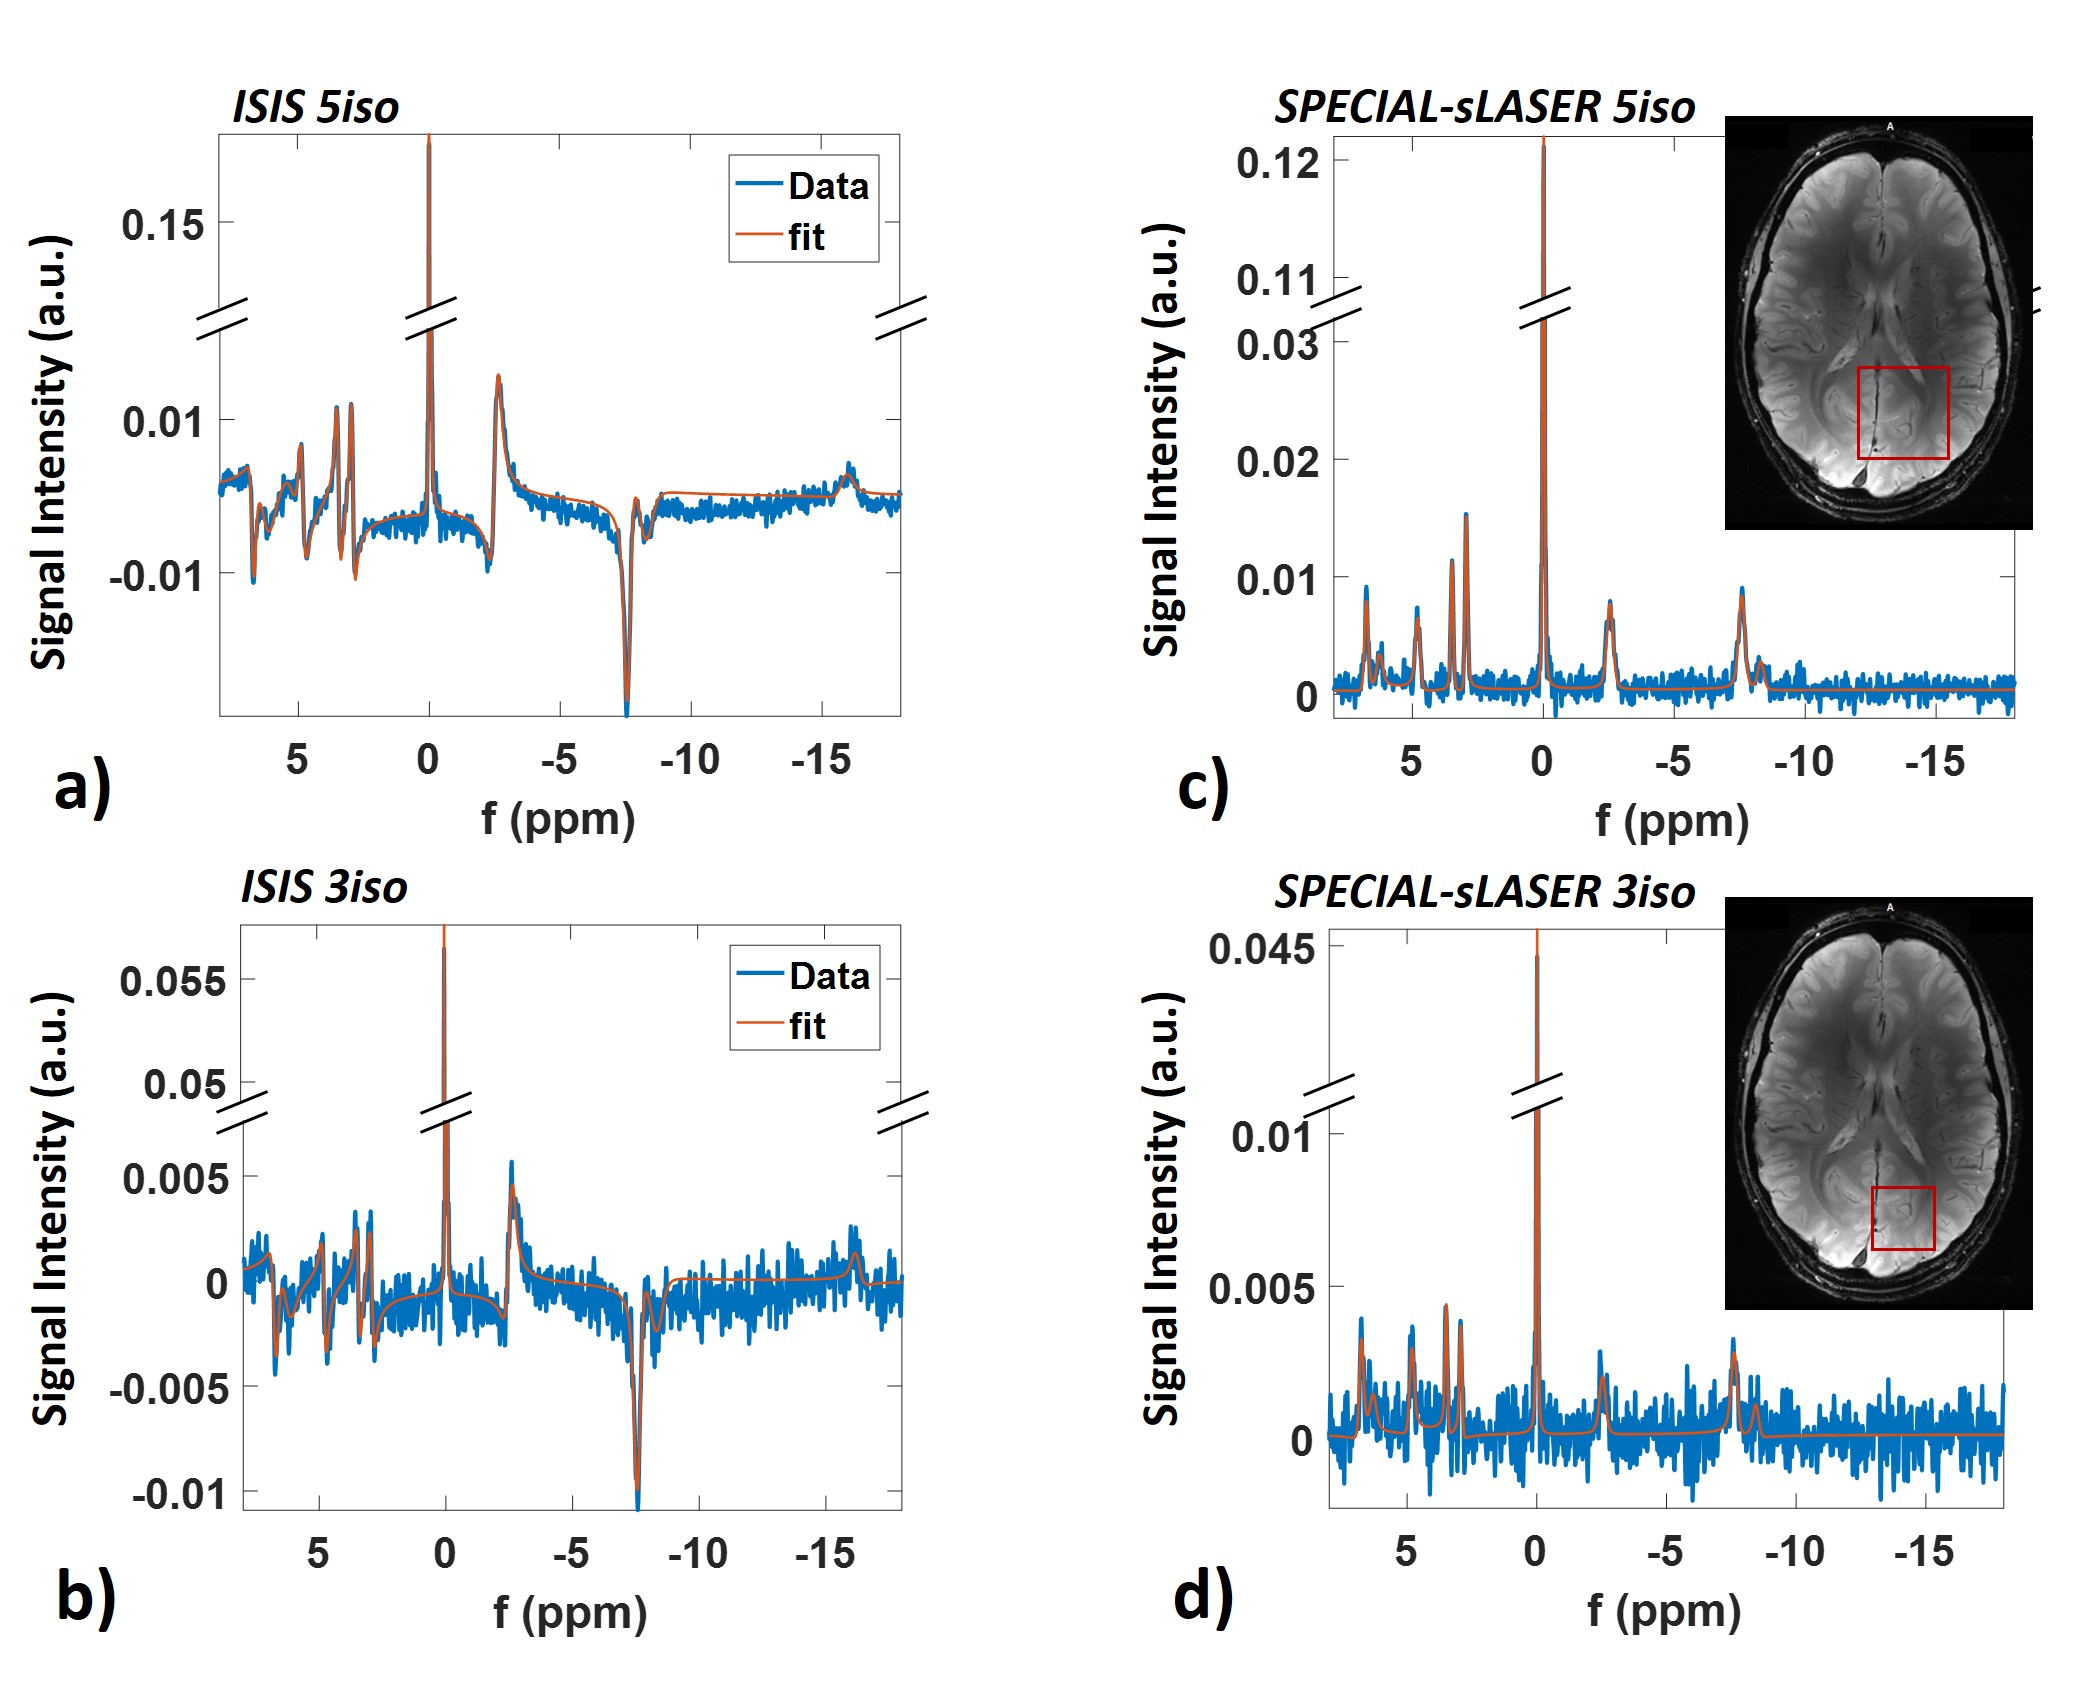
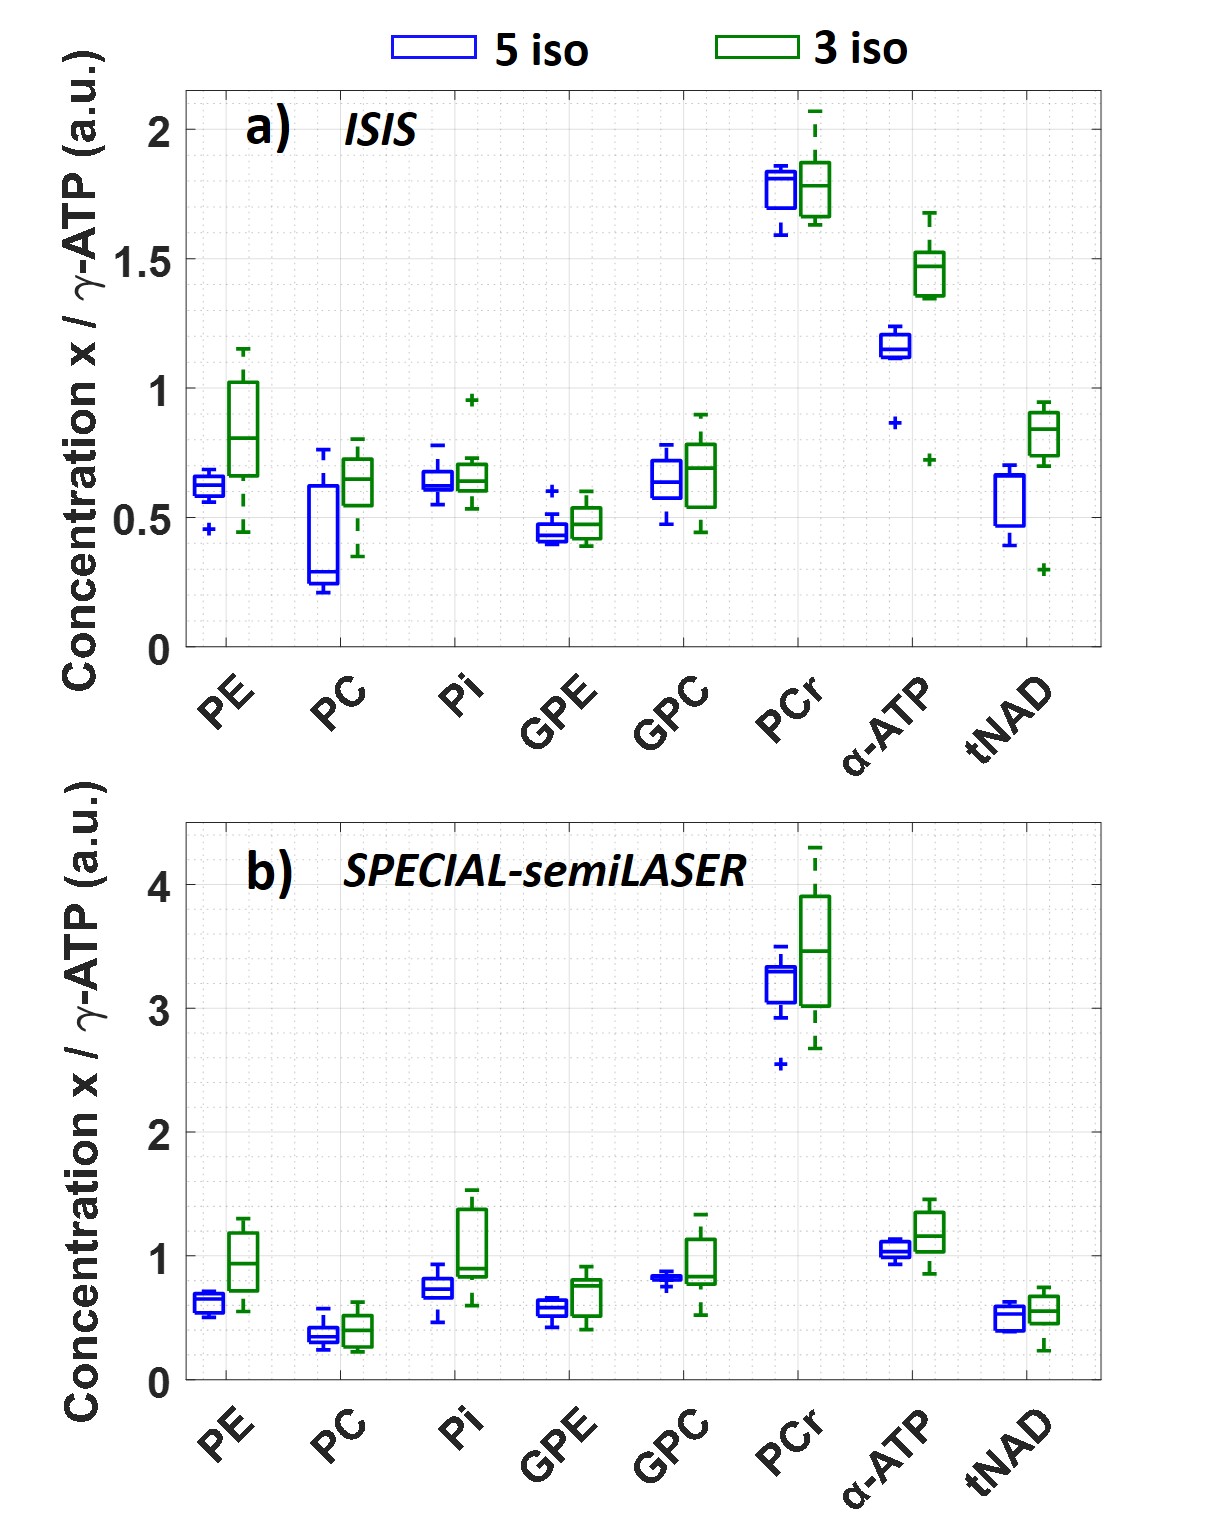
Figure 2 shows spectra obtained for the absolute SNR measurement in a 5x5x5cm3 voxel (inset) for a) ISIS and b) SPECIAL-semiLASER localization. SNR and FWHM values are summarized in Table 1. For phosphomonoesters and –diesters and inorganic phosphate, SNR of SPECIAL-semiLASER is on average 35% lower, for PCr 45% lower, and for ATP 60% lower in comparison to ISIS.Spectra from the SNR efficiency measurements and corresponding AMARES fits are shown in Figure 3 for voxel sizes of 5x5x5cm3 and 3x3x3cm3 in the upper and lower row, respectively, and the two sequences ISIS (left column) and SPECIAL-semiLASER (right column). SNR of phosphomonoesters, Pi and phosphodiesters of SPECIAL-semiLASER spectra is 30% lower than in ISIS spectra, PCr is 20% lower, and ATP is 65% lower. AMARES quantification results for ISIS (a) and SPECIAL-semiLASER (b) are reported in Figure 4. Concentrations are given as ratio to γ-ATP. The results are corrected for relaxation, but not for pulse profile distortions.
Discussion
The amount of reduction in absolute SNR for SPECIAL-semiLASER in comparison to ISIS corresponds to T2 relaxation losses11,12 due to a longer minimum TE in SPECIAL-semiLASER. The linewidths are comparable for all metabolites except PC. The PC signal seems broadened when detected with SPECIAL-semiLASER, but it is difficult to detect due to low SNR which may render the FWHM estimate inaccurate. Another error source might be an overlap with 2,3-diphosphoglycerate from blood12.SNR efficiency of the two sequences is not only limited by T2 losses, but also by SAR, and therefore by longer TR and less averages per unit time for SPECIAL-semiLASER. Frequency resolution in both sequences enables the quantification of 8 metabolites. The β-ATP peak is strongly attenuated in ISIS spectra and not visible in SPECIAL-semiLASER due to limited excitation bandwidths.
Even though a direct comparison of quantification results to other studies is not trivial since we report concentrations not corrected for pulse profile distortions, concentrations measured with ISIS are similar to previously calculated concentrations measured at 7T with a non-localizing FID sequence13. For tNAD, our measured concentrations are much higher than that previous 7T data propose13. Concentrations from SPECIAL-semiLASER spectra are comparable to ones obtained from ISIS, but show a wider dispersion since spectra suffer from lower SNR and fit reproducibility. PCr concentration is remarkably higher than in ISIS spectra, which might be due to a worse localization efficiency, and, therefore possible muscle contamination.
We did not determine significant differences between different voxel sizes.
Conclusion
This study presents a comparison of ISIS and SPECIAL-semiLASER localization for 31P MRS in the human brain at 9.4T. Though SPECIAL-semiLASER requires longer TE and TR, and therefore SNR is lower in comparison to ISIS, good spectral quality can be obtained. Fitting results show good reproducibility. Measured metabolite concentrations are comparable for both sequences, except a higher PCr concentration in SPECIAL-semiLASER.Acknowledgements
Funding by the European Union (ERC Starting Grant, SYNAPLAST MR, Grant Number: 679927) and by the Cancer Prevention and Research Institute of Texas (CPRIT) (Grant Number: RR180056) is gratefully acknowledged.References
1Bogner W, Chmelik M, Andronesi OC, et al.
In Vivo 31P Spectroscopy by Fully Adiabatic Extended Image Selected In
Vivo Spectroscopy: A Comparison Between 3T and 7T. Magn Reson Med.
2011;66(4):923-930.
2Keevil SF. Spatial localization in nuclear
magnetic resonance spectroscopy. Phys Med Biol. 2006;51:R579-R636.
3Steinseifer IK, Mekle R, Gruetter R, et
al. Implementation of GOIA-Wurst Pulse in a SPECIAL Localization
Sequence at 7 T. In Proceedings of the Annual Meeting of ISMRM, Montreal,
Canada, 2011. Abstract 1431.
4Fuchs A, Luttje M, Boesiger P, et al. SPECIAL
Semi-LASER with Lipid Artifact Compensation for 1H MRS at 7T. Magn Reson Med.
2013;69:603-612.
5Avdievich NI, Ruhm L, Dorst J, et al. Double-Tuned
31P/1H Human Head Array with High Performance at Both Frequencies for Chemical
Shift Spectroscopic Imaging (CSI) at 9.4T. Proc. Intl. Soc. Mag. Reson Med.
2019;26:3994.
6Andronesi OC, Ramadan S, Ratai E, et al.
Spectroscopic imaging with improved gradient modulated constant adiabaticity
pulses on high-field clinical scanners. J Magn Reson. 2010;203(2):283-293.
7Chmelík M, Just Kurková I, Gruber S, et al.
Fully adiabatic 31P 2D-CSI with reduced chemical shift displacement error at 7T
– GOIA-1D-ISIS/2D-CSI. Magn Reson Med. 2013;69(5):1233-1244.
8Pohmann R, Raju S, Scheffler K. T1 values of
phosphorus metabolites in the human visual cortex at 9.4T. Proc. Intl. Soc.
Mag. Reson Med. 2018;26:3994.
9Bydder M, Hamilton G, Yokoo T, et al. Optimal
phased-array combination for spectroscopy. Magn Reson Imaging.
2008;26(6):847-850.
10Vanhamme L, van den Boogaart A, van Huffel S.
Improved Method for Accurate and Efficient Quantification of MRS Data with USE
of Prior Knowledge. J Magn Reson.
1997;129:35-43.
11Lei H, Zhu X-H, Zhang X-L, et al. In
Vivo 31P Magnetic Resonance Spectroscopy of the Human Brain at 7T: An Initial
Experience. Magn Reson Med. 2003;49:199-205.
12Van der Kemp WJM, Klomp DWJ, Wijnen JP. 31P T2
of Phosphomonoesters, Phosphodiesters, and Inorganic Phasphate in the Human
Brain at 7T. Magn Reson Med. 2018;80:29-35.
13Ren J, Sherry AD, Malloy CR. 31P-MRS of healthy
human brain: ATP synthesis, metabolite concentrations, pH, and T1 relaxation
times. NMR Biomed. 2015;28:1455-1462.
14Nassirpour S, Chang P, Henning A. High and
ultra-high resolution metabolite mapping of the human brain using 1H FID MRSI
at 9.4T. 2018;168:211-212.
Figures